JWeiland Profile picture
Sep 8 2 tweets 1 min read Twitter logo Read on Twitter
September 8th US update:

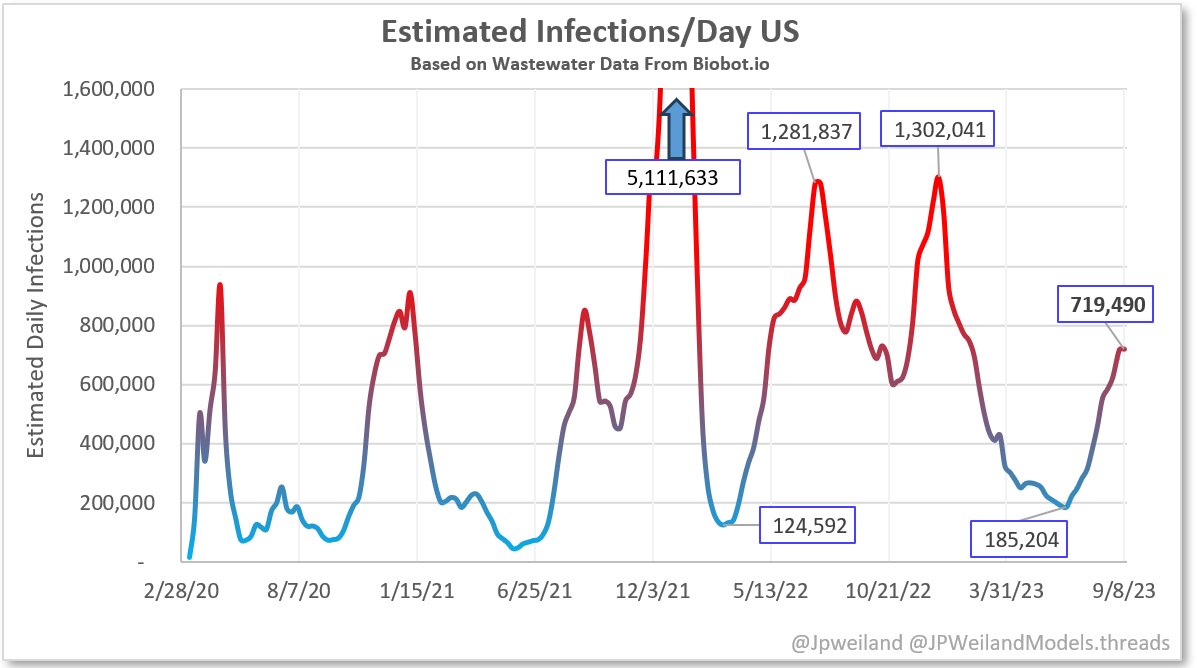
Community spread of Covid is "high", with a correction upwards last week as well. Current estimates:

🔸720,000 new infections/day
🔸1 in every 460 new people were infected today
🔸1 in every 46 people currently infected Image
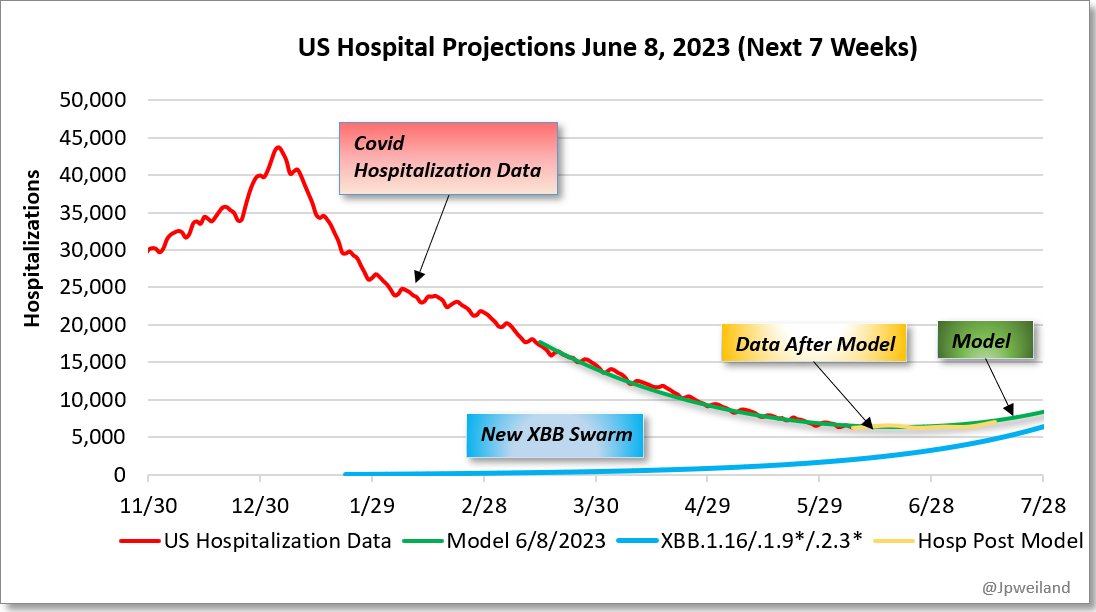
I plan on updating my forecast model in the next week for the next month's outlook.

• • •

Missing some Tweet in this thread? You can try to force a refresh
 

Keep Current with JWeiland

JWeiland Profile picture

Stay in touch and get notified when new unrolls are available from this author!

Read all threads

This Thread may be Removed Anytime!

PDF

Twitter may remove this content at anytime! Save it as PDF for later use!

Try unrolling a thread yourself!

how to unroll video
  1. Follow @ThreadReaderApp to mention us!

  2. From a Twitter thread mention us with a keyword "unroll"
@threadreaderapp unroll

Practice here first or read more on our help page!

More from @JPWeiland

Aug 28
One more week of data on hospitalizations to check the model accuracy. Out 5 weeks now.

Model date: Jul 18
Last Hosp data: Jul 8 (always 9-16 days behind current date)
Image
Going to post the couple models before that as well. Here's the results from the June 8th model (4-5 weeks):


Image
And here is the previous model from March that predicted out past 8 weeks.

Image
Read 4 tweets
Aug 20
For sake of comparison, what happened with Omicron? A thread:

First, we had 3 highly mutated sequences from Botswana/South Africa. Within a few days we had enough data from SA to estimate growth advantage of 500%
1/
Then, we were able to see quick case growth in South Africa. The case growth roughly agreed with the advantage estimate. A couple days after this the Re increased to 3.6.
2/
A few days later I modeled how this might play out in the US. At this time there were only 3 sequences in the US. And it did play out as predicted.
3/

Read 7 tweets
Aug 17
August 17th update (Biobot): US community spread is back up to "high" with an estimated 610,000 daily new infections.

Similar levels in all 4 US regions.

🔸610,000 new infections/day⬆️
🔸1 in every 550 new people were infected today
🔸1 in every 55 people currently infected Image
This rise is still due to EG.5.1, FL.5.1, and XBB.1.16.6 along with some immune waning.

It is not due to the new, heavily mutated variant BA.2.86. There was the US' first sequence reported today (Michigan). We are watching this one *very* closely.

Slide from @jbloom_lab Image
As some of us suspected past week, the "surprising" jump in Midwest cases last week was indeed an anomaly. It's back to matching the increases in the other 3 regions.

https://t.co/L6HifRTlOb
Image
Read 5 tweets
Aug 14
The variants we've seen since 2022 each only have a few S mutations at a time, so their potential was limited.

This unnamed new one has 24.
Omicron had 32.

We don't know yet where this will land on this chart. Given the mutation profile, it has a much larger range of outcomes. Image
Maybe our exposure to other Omicrons will stunt it, and maybe it made too many advantage tradeoffs to be highly successful like Omicron initially was. We don't know yet. But we know it's quite different. Here is my count for new S mutations from EG.5.1 (blue also new). Image
@LongDesertTrain is one of the top experts on mutations. I trust his expertise on evaluating the new mutations.

He's been saying effectively the same thing: it has a high "potential" but we won't know until more sequences come in.

Read 5 tweets
Jul 20
Model for next 5 weeks:

Anticipating increases into August, driven by EG.5.1, FL.1.5, and XBB.1.16.6.

Each of these have advantage over XBB.1.16, XBB.2.3 etc.

The lack of cases for the last 4 months is expected to have increased the number of people susceptable to infection. Image
It also makes sense that the Northeast is seeing the biggest uptick on wastewater, considering their levels of the faster variants are higher than the rest of the US.

21 day seq data from @RajlabN dashboard
Image
Image
The common driver between these variants seems to be the F456L mutation on the spike. They also have various other escape mutations.
Read 6 tweets
Jul 14
I made a simple Omicron simulation with the following assumptions: R0=8 and avg. protection after infection is 9 months. No seasonal effect etc.

Then I applied NPI that cut the chance of infection per interaction by 7 in 10.

Found the results really interesting!
1/ Image
🔹️3 to 4 waves are expected per year with 0 NPI, even though about 1 infection/yr/capita
🔹️70% effective NPI reduces frequency of waves just less than 2 per year
🔹️But total infections over time were only reduced ~30%
🔹️All the waves started to dampen to flat over time
2/ Image
I didn't anticipate the difference in wave frequencies, but I did expect that the total reduction would be much less than 70%. The pool of susceptibles grows high enough to still create sizable waves.suppressed.
3/
Read 7 tweets

Did Thread Reader help you today?

Support us! We are indie developers!


This site is made by just two indie developers on a laptop doing marketing, support and development! Read more about the story.

Become a Premium Member ($3/month or $30/year) and get exclusive features!

Become Premium

Don't want to be a Premium member but still want to support us?

Make a small donation by buying us coffee ($5) or help with server cost ($10)

Donate via Paypal

Or Donate anonymously using crypto!

Ethereum

0xfe58350B80634f60Fa6Dc149a72b4DFbc17D341E copy

Bitcoin

3ATGMxNzCUFzxpMCHL5sWSt4DVtS8UqXpi copy

Thank you for your support!

Follow Us on Twitter!

:(