Mike Hoerger, PhD MSCR MBA Profile picture
Sep 9, 2023 4 tweets 3 min read Read on X
PMC C0VID-19 Tracker, Sep 6, 2023

U.S. #wastewater levels are higher than during 70% of the pandemic:
🔹1.95% (1 in 51) are infectious
🔹Nearly 1 million C0VID cases per day
🔹Causing >40,000 #LongCovid cases per day

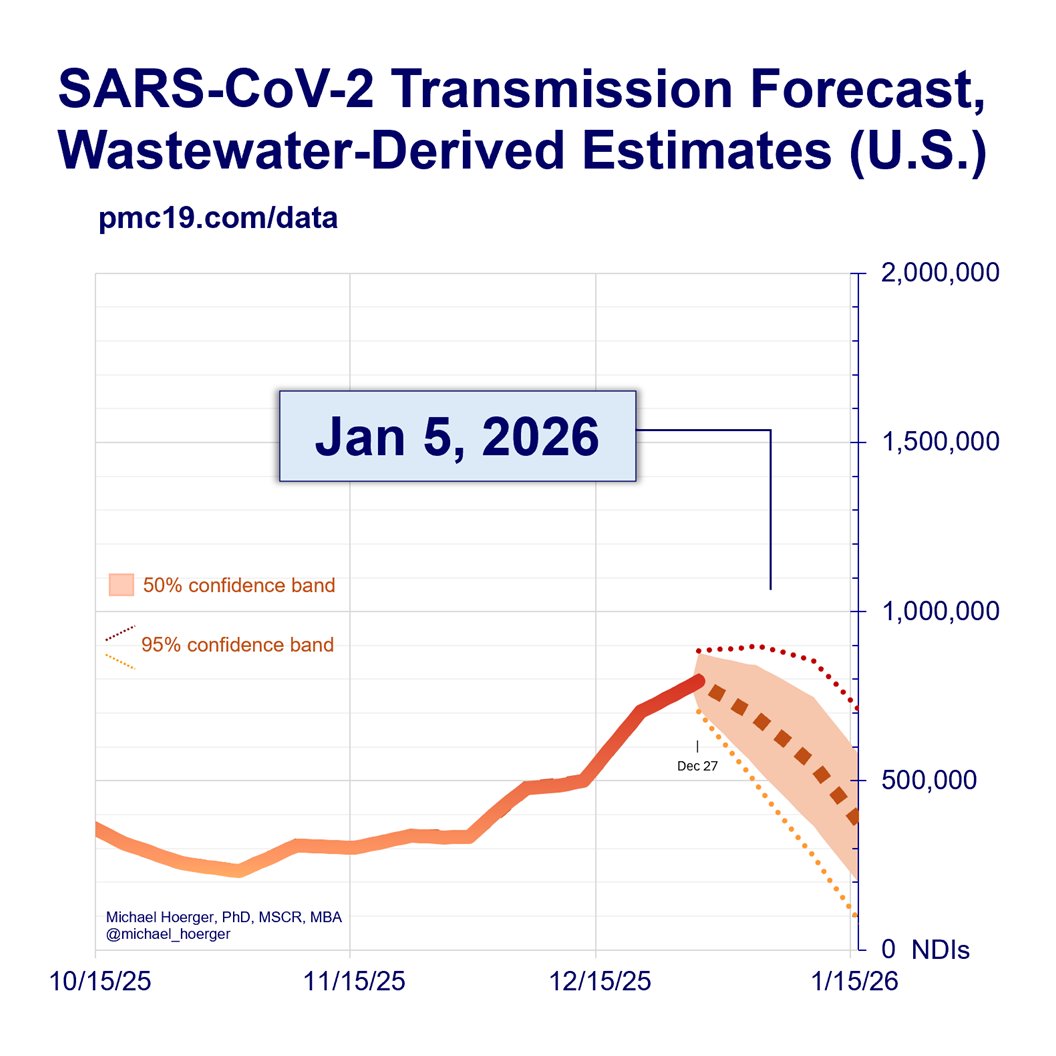
Let's look at these wildly divergent forecasts for the next 4 weeks.

Real-time Model: If you assume Biobot is reporting accurate real-time wastewater data each week, follow the red line. This says we have peaked on our late summer wave. That would be great news in terms of less morbidity and mortality. The problem is that real-time reports have been prone to error lately, more often than not underestimating wastewater levels, and then corrected later.

Alt Model 1 (Turtle): The turtle model moves slow, like a turtle. It assumes the most recent week's data from Biobot are useless and ignores them. By ignoring the most recent data, it will be slow to detect a quick change in transmission, like a peak. It basically expects "more of the same" for a little longer. See green line.

Alt Model 2 (Cheetah): The cheetah model moves fast, like a cheetah. It assumes that if last week's Biobot wastewater data underreported levels by X% that this week's current real-time data are also underreporting by that same percent. Last week's real-time data were corrected upward by 15%, which makes a huge difference in forecasting whether we're leveling off or on a steep incline. The cheetah model has us getting up to 1.4 million cases/day, so this is a good model for a worst-case scenario. See yellow line.

Composite Model: This is the average of the three models. It's what we use in the red box for estimating cases 4 weeks from now. It's a good estimate if trying to cite a point estimate to coworkers (e.g., "The U.S. will see about 1 million new cases/day the next several weeks). However, from a forecasting perspective, it's less useful because the underlying models are so divergent. See black line.

Big-Picture Framing
The current state of the pandemic is extremely bad. Expect approximately 1 million new U.S. cases per day the next several weeks. Less if we're lucky, and more if we're not. As a psychologist, I would characterize denial about the current C0VID wave to peak in the next couple weeks. Most people believe "the pandemic is over" and we're "after C0VID." Expect further gaslighting for now.

#MaskUp #VaxUp #Ventilate #HEPA #CorsiRosenthalBox #remotework

1/
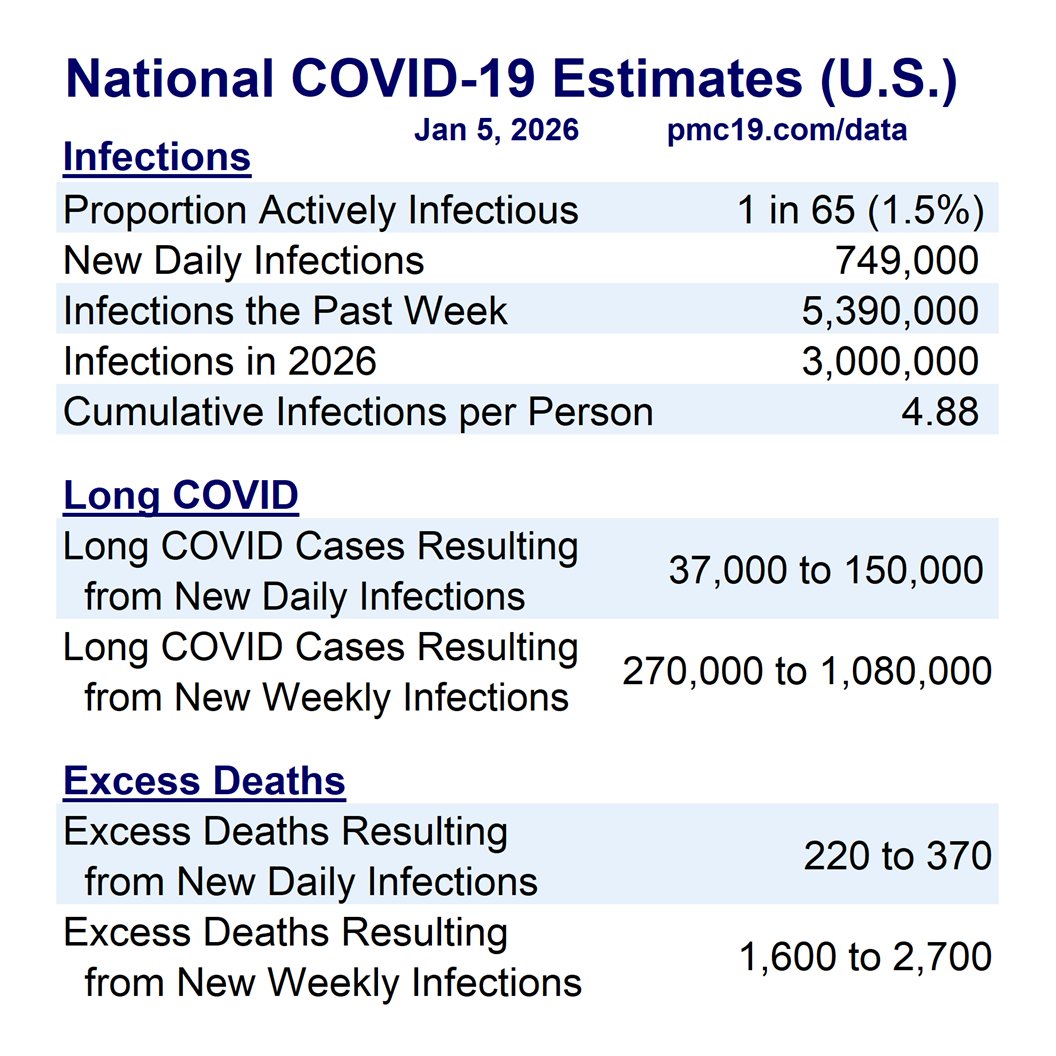
PMC 6-month view of wastewater levels, case estimates, and near-term forecast.   CURRENT ESTIMATES FOR September 6, 2023 Wastewater Levels (copies/mL) 641 New Daily Cases 933,000 % of Population Infectious 1.95% (1 in 51 people) New Daily Long C0VID Cases  47,000 to 187,000   4-WEEK FORECAST FOR October 4, 2023 Wastewater Levels (copies/mL) 716 (12% higher) New Daily Cases 1,042,000 % of Population Infectious 2.18% (1 in 46 people) New Daily Long C0VID Cases  52,000 to 208,000
Let's zoom out from the 6-month view to the full pandemic.

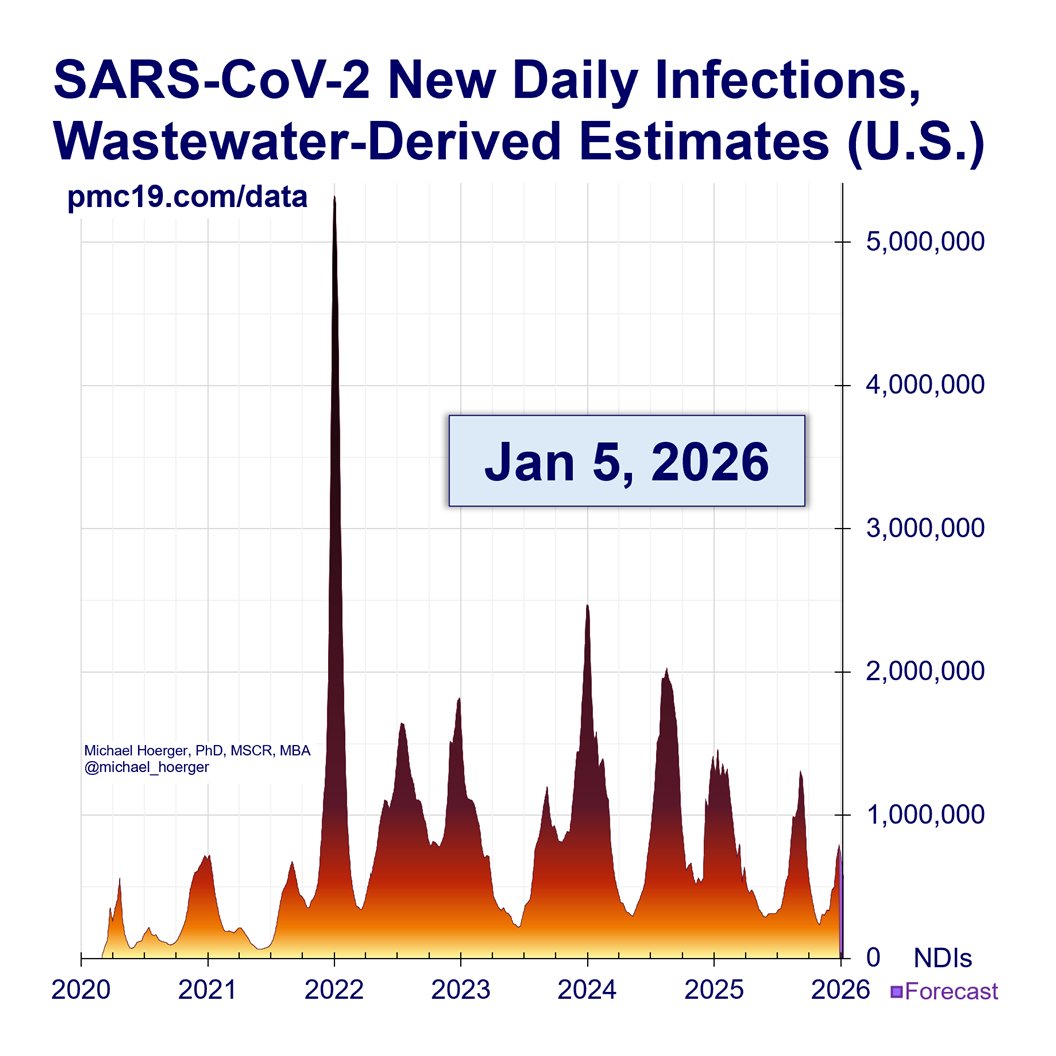
Given current levels and forecasts, we're in a wave of transmission similar to the winter of 2020-21 or Delta. 🔥🔥

178 million infections & >8 million #LongCovid cases in 2023 thus far.

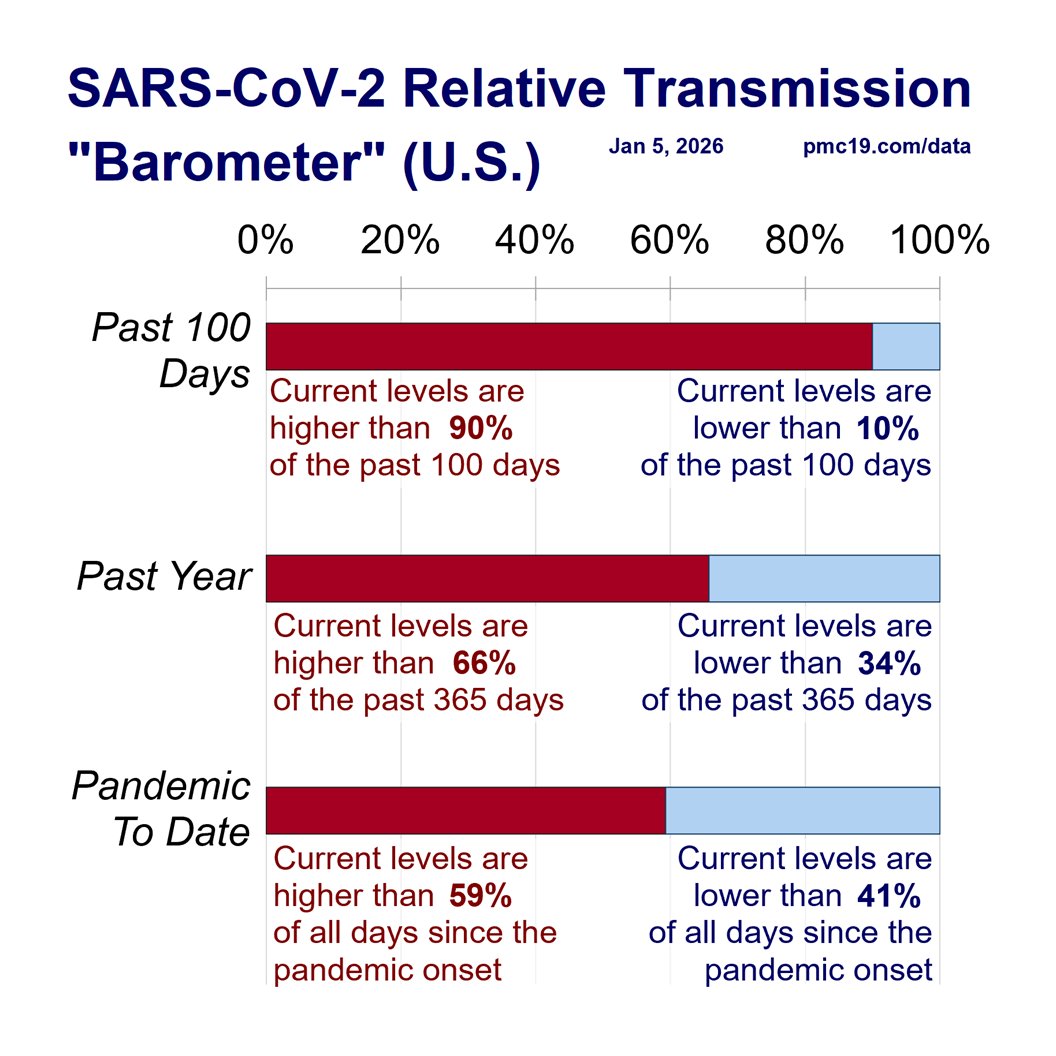
2/ There is more COVID-19 transmission today        than during 70% of the pandemic.  CURRENT ESTIMATES FOR September 6, 2023 Wastewater Levels (copies/mL) 641 New Daily Cases 933,000 % of Population Infectious 1.95% (1 in 51 people) New Daily Long COVID Cases  47,000 to 187,000   WEEKLY ESTIMATES FOR September 6, 2023 New Weekly Cases 6,500,000 New Weekly Long COVID Cases  327,000 to 1,306,000   2023 CUMULATIVE ESTIMATES AS OF September 6, 2023 Total 2023 Cases To Date 178,600,000 Total 2023 Long COVID Cases To Date  8,930,000 to 35,720,000
With about 2% of the U.S. population actively infectious with C0VID, school and in-person work remain extremely risky.

Offer remote activities. #MaskUp. #VaxUp again when allowed. Read up on and improve indoor air quality. Avoid indoor dining. #RapidTest frequently.

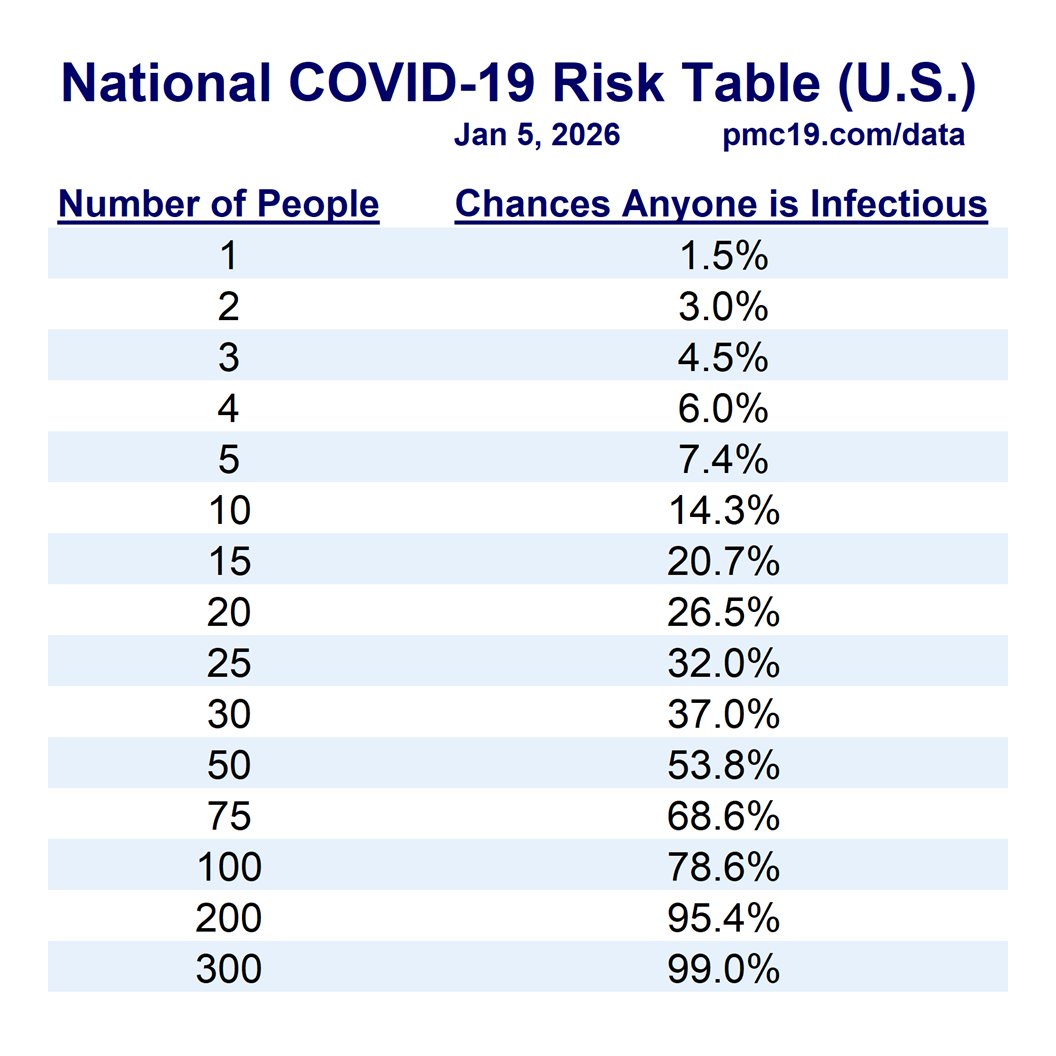
3/ Number of People,	Chances Anyone is Infectious 1	2.0% 2	3.9% 3	5.7% 4	7.6% 5	9.4% 6	11.2% 7	12.9% 8	14.6% 9	16.3% 10	17.9% 15	25.6% 20	32.6% 25	38.9% 30	44.6% 35	49.8% 40	54.5% 50	62.7% 75	77.2% 100	86.1% 150	94.8% 200	98.1% 300	99.7% 400	>99.9% 500	>99.9% 25	38.9% 30	44.6% 35	49.8% 40	54.5% 50	62.7% 75	77.2% 100	86.1% 150	94.8% 200	98.1% 300	99.7% 400	>99.9% 500	>99.9%
Here's the full PMC C0VID-19 Dashboard for Sep 6, 2023.

Please share here and across other platforms if you found any of the above Tweets helpful. I'd love to hear how you're using the data and if it's helped you with any "wins" on #pandemic safety.

Thank you 🙏

4/
Overall PMC C0VID Dashboard. A series of tables and figures summarized in each of the preceding Tweets (text and alt text).

• • •

Missing some Tweet in this thread? You can try to force a refresh
 

Keep Current with Mike Hoerger, PhD MSCR MBA

Mike Hoerger, PhD MSCR MBA Profile picture

Stay in touch and get notified when new unrolls are available from this author!

Read all threads

This Thread may be Removed Anytime!

PDF

Twitter may remove this content at anytime! Save it as PDF for later use!

Try unrolling a thread yourself!

how to unroll video
  1. Follow @ThreadReaderApp to mention us!

  2. From a Twitter thread mention us with a keyword "unroll"
@threadreaderapp unroll

Practice here first or read more on our help page!

More from @michael_hoerger

May 15
1) Good luck getting any new federal research to support #LongCOVID until "covid" is dropped from the dirty words that get grant applications triaged to the trash bin.

You know which senator to call.

I just did, and got a staffer instead of voicemail.Lengthy list of words that get federal grants triaged to the trash bin, unfunded after favorable review, or defunded if already in progress.   Includes "Covid-19," and no, it's not a matter of simply restating as "SARS2" or "The Rona." It might make it one step further in the review process, but this gets checked closed, and it will get canned. Hundreds of hours of work, flushed down the toilet.   And that's the point.
2) I told the staffer that #LongCOVID is affecting millions and that no research will be funded to address this while "covid" remains on the banned word list.

I asked if they wanted to hear more. He did...

Here's the word list, btw
pen.org/banned-words-l…
3) I told them about my family member who was a strong Special Forces veteran, got covid once, & according to their neurologist, it triggered #LongCOVID in the form of Dementia w/Lewy Bodies.

DLB is one of the worst conditions imaginable. After a 2yr battle, they died in 2024.
Read 5 tweets
May 3
30 million excess deaths attributable to COVID is a tremendous underestimate because most analyses insufficiently account for mortality displacement.

In the U.S., it's about 50% worse than people realize.
Mortality displacement or "harvesting" is the idea that so many people died of COVID in the early pandemic that we should actually expect to see *fewer* deaths today if COVID were "over."
In fact, we see similar or slightly higher mortality relative to pre-pandemic levels. Despite the millions of people that have died, the mortality faucet keeps running strong. It should have slowed.
Read 9 tweets
Apr 22
🧵1 of 8 | PMC Dashboard, April 21, 2025 (U.S.)

🌤️Only 1 in 5 days of the pandemic have seen transmission as low as today
🌤️1 in 196 actively infectious
⚡️BUT still 1.7 million weekly infections, resulting in >85,000 LC cases and up to 1,000 deaths

I'll walk you through it... Current Levels for Apr 21, 2025	 % of the Population Infectious	 0.5% (1 in 196)	 New Daily Infections	 244000	 New Weekly Infections	 1708000	 Resulting Weekly Long COVID Cases	 85,000 to 342,000	 Resulting Weekly Excess Deaths	 600 to 1,000	 	 Monthly Forecast	 Average % of the Population Infectious	 0.7% (1 in 147)	 Average New Daily Infections	 324800	 New Infections During the Next Month	 9744000	 Resulting Monthly Long COVID Cases	 487,000 to 1,949,000	 Resulting Monthly Excess Deaths	 3,500 to 5,800	 	 Running Totals	 Infections Nationwide in 2025	 62331000	 Average Number of Infecti...
🧵2 of 8 | PMC Dashboard, April 21, 2025 (U.S.)

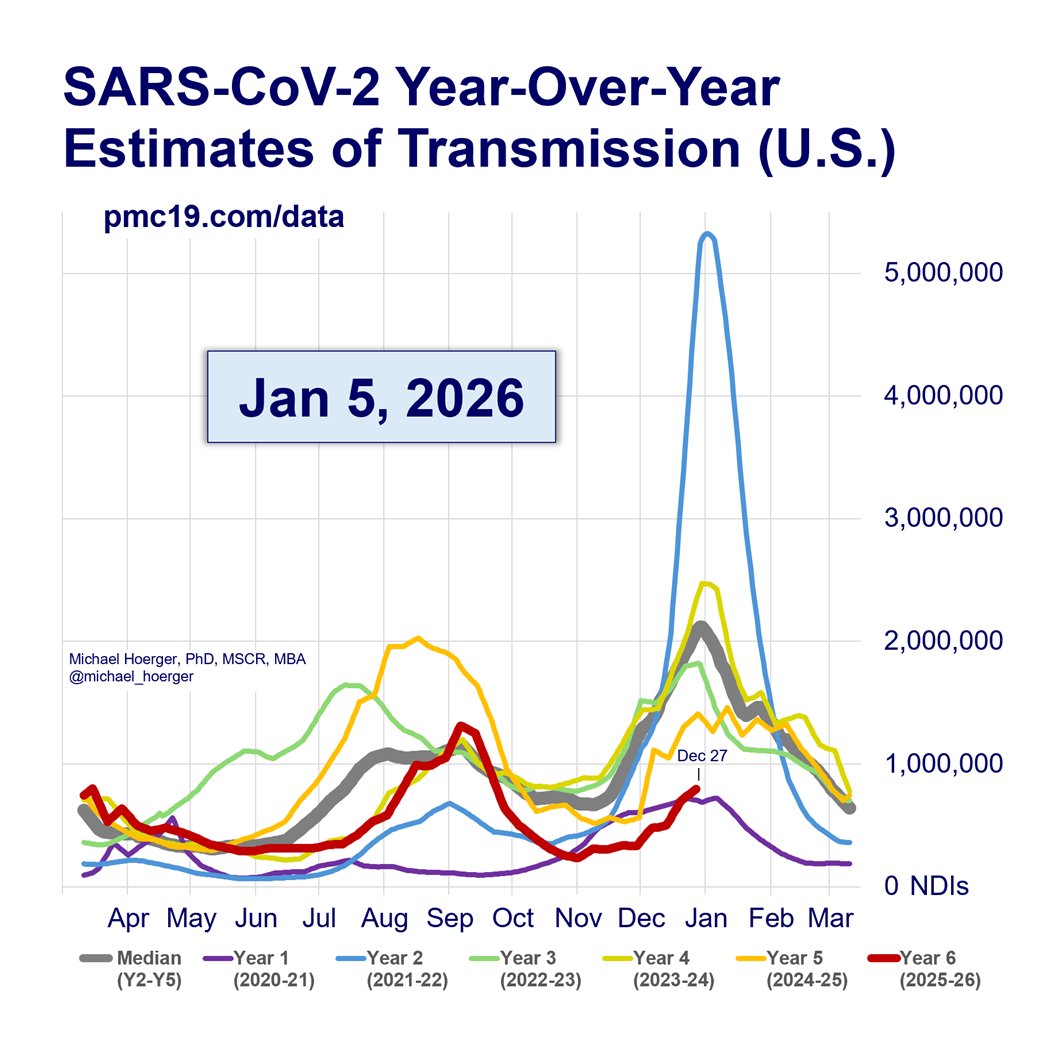
We're in the 6th year. See the small red line, bottom left. Notice how closely it tracks the median (gray), year 4 (yellow), & year 5 (orange).

Acknowledging caveats, those are plausible gist-level scenarios for months ahead. year over year graph, summarized in post
🧵3 of 8 | PMC Dashboard, April 21, 2025 (U.S.)

Expect steady transmission bouncing up and down around the current national lull-level estimate the next several weeks. 200-350k daily infections nationally.

This is about as low as lulls bottom out anymore. Past 12 months and forecast, summarized in post
Read 8 tweets
Apr 14
🧵1/5 | PMC Dashboard, Apr1il 14, 2025 (U.S.)

🔹2.2 million weekly infections
🔹1 in 149 actively infectious
🔹>100,000 LC cases resulting from the week's infections
🔹>800 deaths resulting from the week's infections
🔹"Lull" transmission steady/slightly decliningCurrent Levels for Apr 14, 2025	 % of the Population Infectious	 0.7% (1 in 149)	 New Daily Infections	 320000	 New Weekly Infections	 2240000	 Resulting Weekly Long COVID Cases	 112,000 to 448,000	 Resulting Weekly Excess Deaths	 800 to 1,300	 	 Monthly Forecast	 Average % of the Population Infectious	 0.7% (1 in 138)	 Average New Daily Infections	 345366.6667	 New Infections During the Next Month	 10361000	 Resulting Monthly Long COVID Cases	 518,000 to 2,072,000	 Resulting Monthly Excess Deaths	 3,700 to 6,200	 	 Running Totals	 Infections Nationwide in 2025	 60891000	 Average Number of ...
🧵2/5 | PMC Dashboard, Apr1il 14, 2025 (U.S.)

Year-over-year transmission (red line, lower left) is tracking the median (grey), year 4 (yellow), and year 5 (orange) closely.

If that trend continues, expect steady yet bumpy transmission the next couple months, until June/July.line graphs, described in tweet
🧵3/5 | PMC Dashboard, Apr1il 14, 2025 (U.S.)

The heat map shows only 4 states in the CDC 'high' level and none in the 'very' high level.

Check local data. Those timing activities to lulls may see a clear opportunity.heat map, described in tweet
Read 6 tweets
Apr 9
The NIH Clinical Center drops universal masking after 5 months of protecting patients, family, & staff.

Wastewater-derived estimates indicate 2.79 million Americans are getting Covid per week AND top actuaries suggest an American dies of Covid every 3 minutes.

🧵1/5 Masks are optional beginning April 11. Staff will mask on request.
These are the current wastewater-derived estimates of transmission.

2.79 million Covid infections/week in the U.S. in the current high "lull."
🧵2/5
This thread with video explains in exquisite detail how every 3 minutes in 2025 an American dies of Covid.

🧵3/5
Read 5 tweets
Apr 7
1) PMC COVlD Dashboard, April 7, 2025 (U.S.)

🔹1 in 120 actively infectious
🔹1 in 3 chance of exposure in a room of 50
🔹2.8 million weekly infections
🔹>140,000 resulting LC cases from the week's infections
🔹>1,000 deaths resulting from the week's infections Current Levels for Apr 7, 2025	 % of the Population Infectious	 0.8% (1 in 120)	 New Daily Infections	 399000	 New Weekly Infections	 2793000	 Resulting Weekly Long COVID Cases	 140,000 to 559,000	 Resulting Weekly Excess Deaths	 1,000 to 1,700	 	 Monthly Forecast	 Average % of the Population Infectious	 1.0% (1 in 105)	 Average New Daily Infections	 455766.6667	 New Infections During the Next Month	 13673000	 Resulting Monthly Long COVID Cases	 684,000 to 2,735,000	 Resulting Monthly Excess Deaths	 4,900 to 8,100	 	 Running Totals	 Infections Nationwide in 2025	 55591000	 Average Number of...
2) Watch this video to understand how we use excess death data from one of the world's largest reinsurers to estimate how this week's infections will result in >1,000 deaths.
3) Transmission is steady or declining across much of the nation, but remains high in 11 states and DC, per the CDC.

Other sources, such as WastewaterSCAN, show a near doubling of transmission in the Northeast the past few weeks, so remain cautious.
Read 4 tweets

Did Thread Reader help you today?

Support us! We are indie developers!


This site is made by just two indie developers on a laptop doing marketing, support and development! Read more about the story.

Become a Premium Member ($3/month or $30/year) and get exclusive features!

Become Premium

Don't want to be a Premium member but still want to support us?

Make a small donation by buying us coffee ($5) or help with server cost ($10)

Donate via Paypal

Or Donate anonymously using crypto!

Ethereum

0xfe58350B80634f60Fa6Dc149a72b4DFbc17D341E copy

Bitcoin

3ATGMxNzCUFzxpMCHL5sWSt4DVtS8UqXpi copy

Thank you for your support!

Follow Us!

:(