
Expert in weighing medical evidence, cancer, COVID forecasting & mitigation, health disparities, financial analytics. 120 publications. PhD program director.
 COVID-19 persists in 2026.
 With limited data reported, Mississippi has an estimated 1 in 27 residents actively infectious.
 Transmission varies considerably by state.
 On average, Americans have have 5.0 cumulative SARS-CoV-2 infections.
 Transmission estimates have been marginally corrected upward.
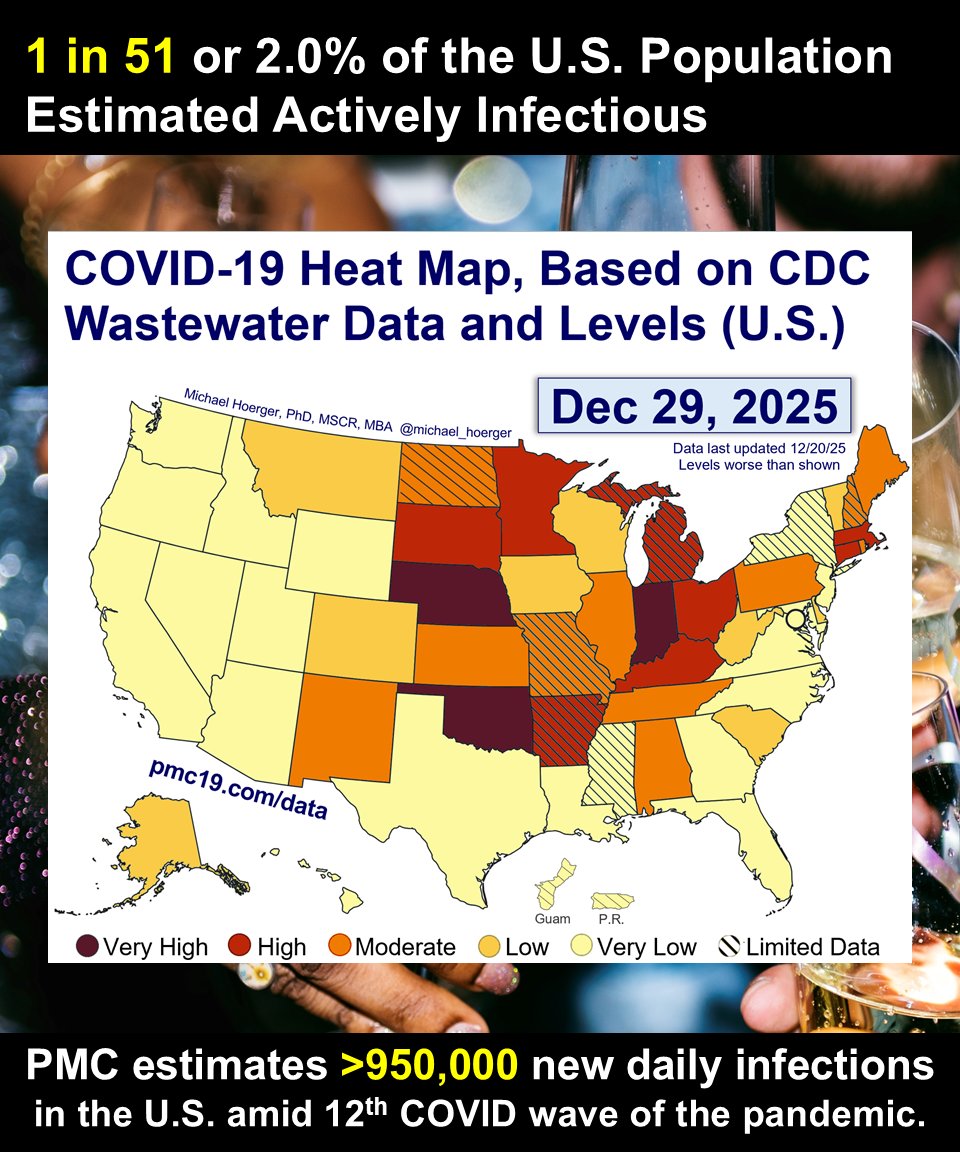
 Nationally, we are seeing an estimated 892,000 new daily SARS-CoV-2 infections, meaning a 1 in 4 chance of exposure in a room of 15 people. Risk varies considerably by state.
 Notice that #Connecticut has excellent SARS-CoV-2 wastewater surveillance. It's "Very High" across much of the state, per CDC.
 Levels are "Moderate" to "Very High" in 26 states.


 🧵2/10
🧵2/10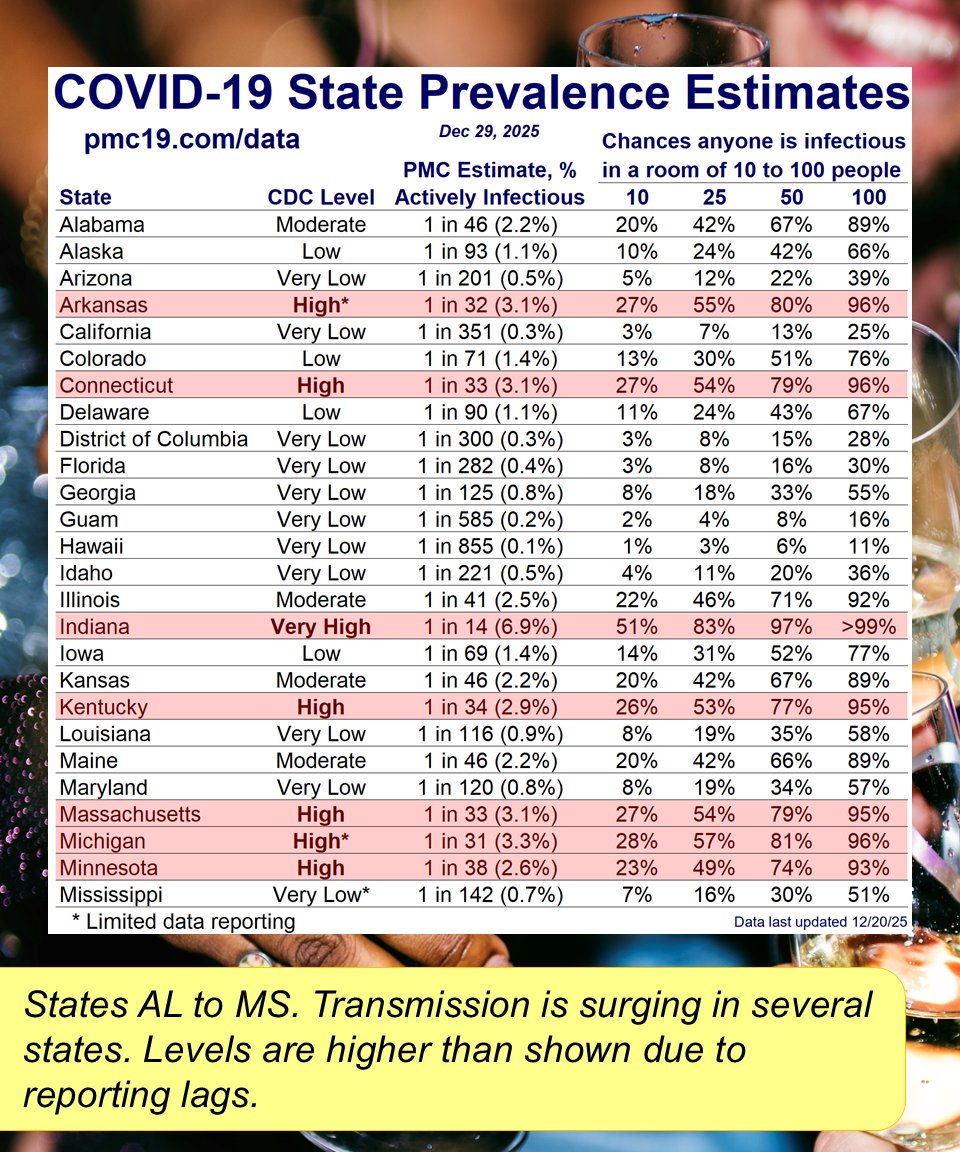
 PMC estimates 1 in 26 people in Indiana are infectious and 1 in 39 in Connecticut.
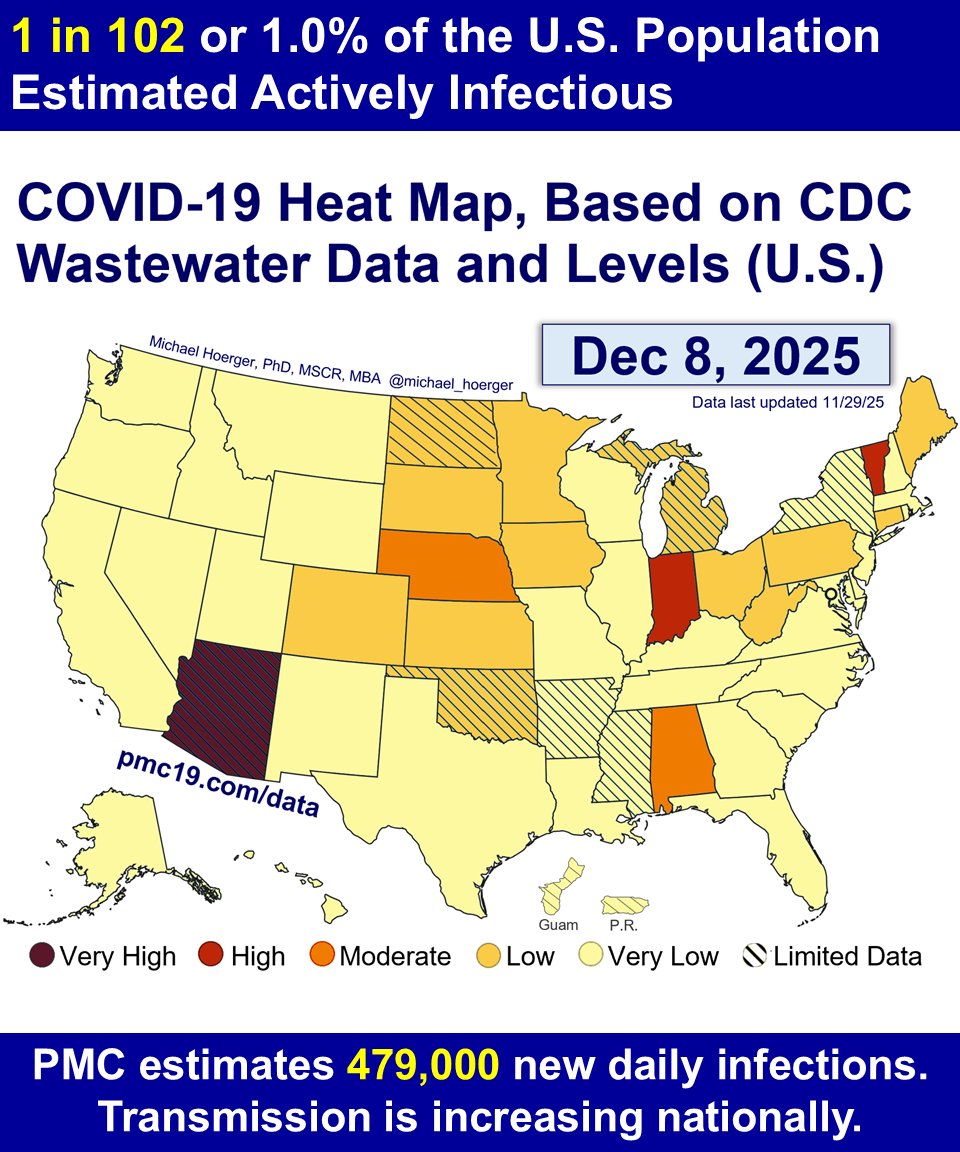 PMC COVlD Update, Dec 8, 2025 (U.S.)
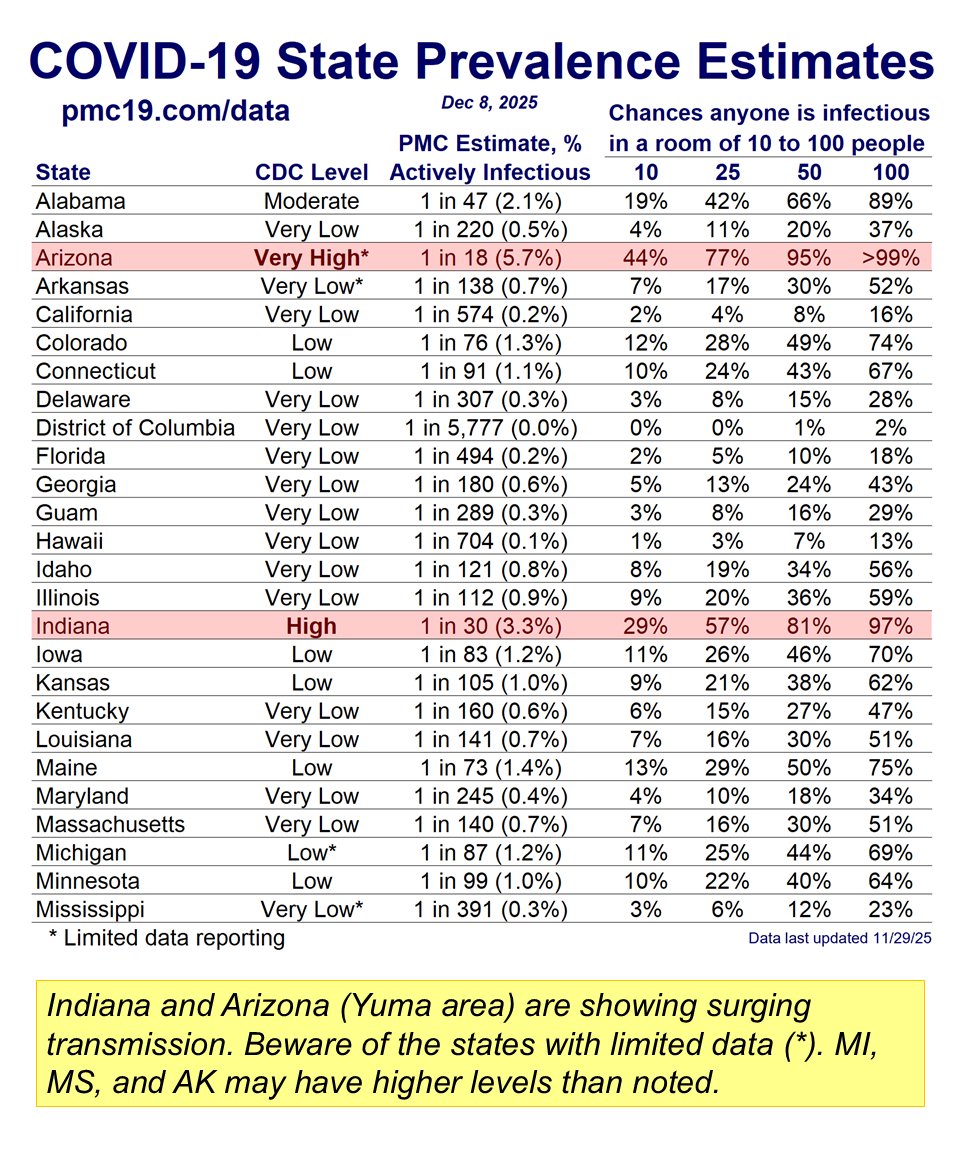
 PMC COVlD Update, Week of Nov 24, 2025 (U.S.)
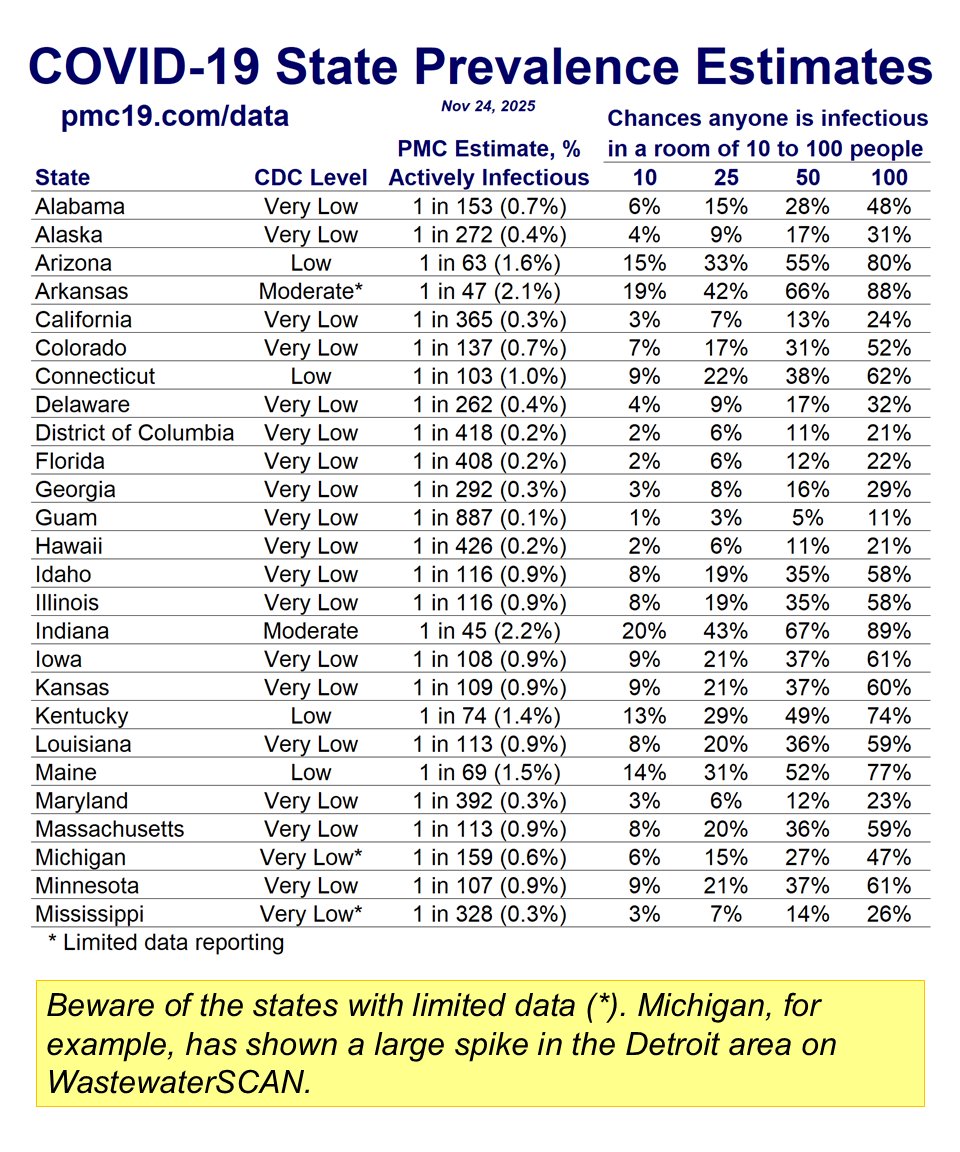
 PMC COVID Update, Week of Nov 10, 2025 (U.S.)
 PMC COVlD Update, Nov 3, 2025 (U.S.)
 PMC COVlD Update, Oct 27, 2025 (US)
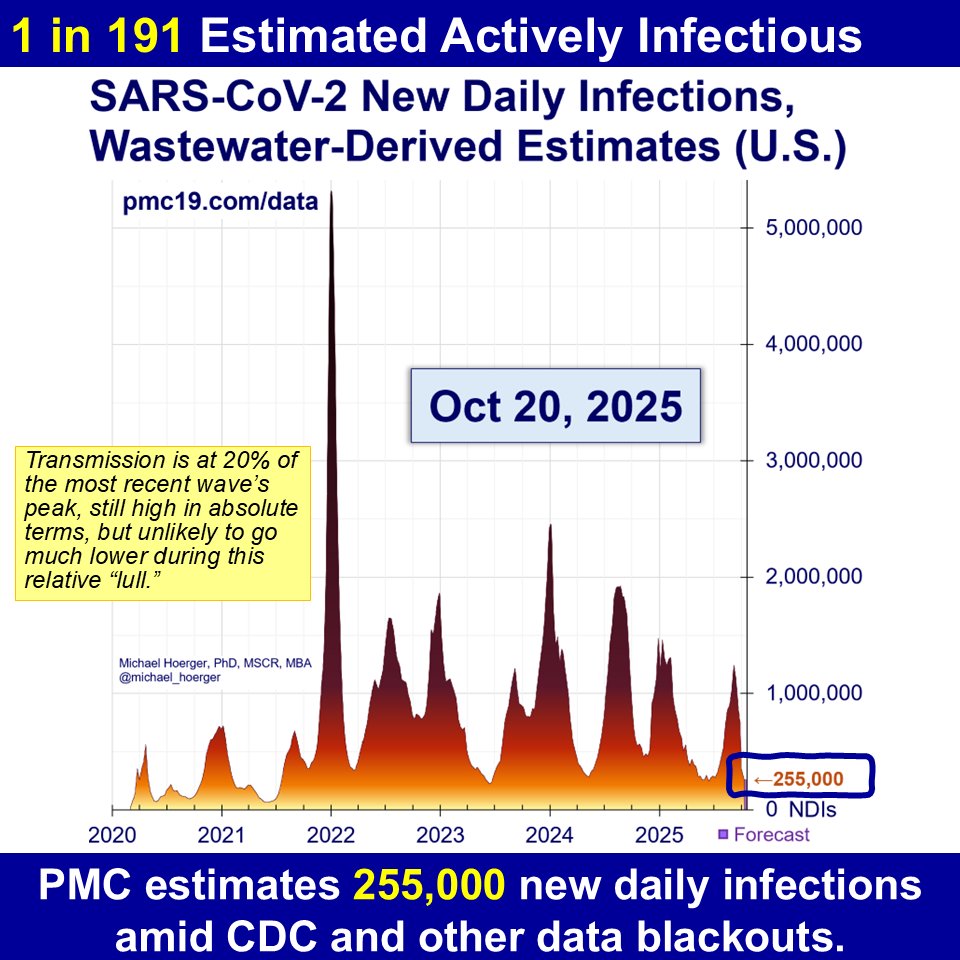 PMC COVlD Update, Oct 20, 2025 (U.S.)
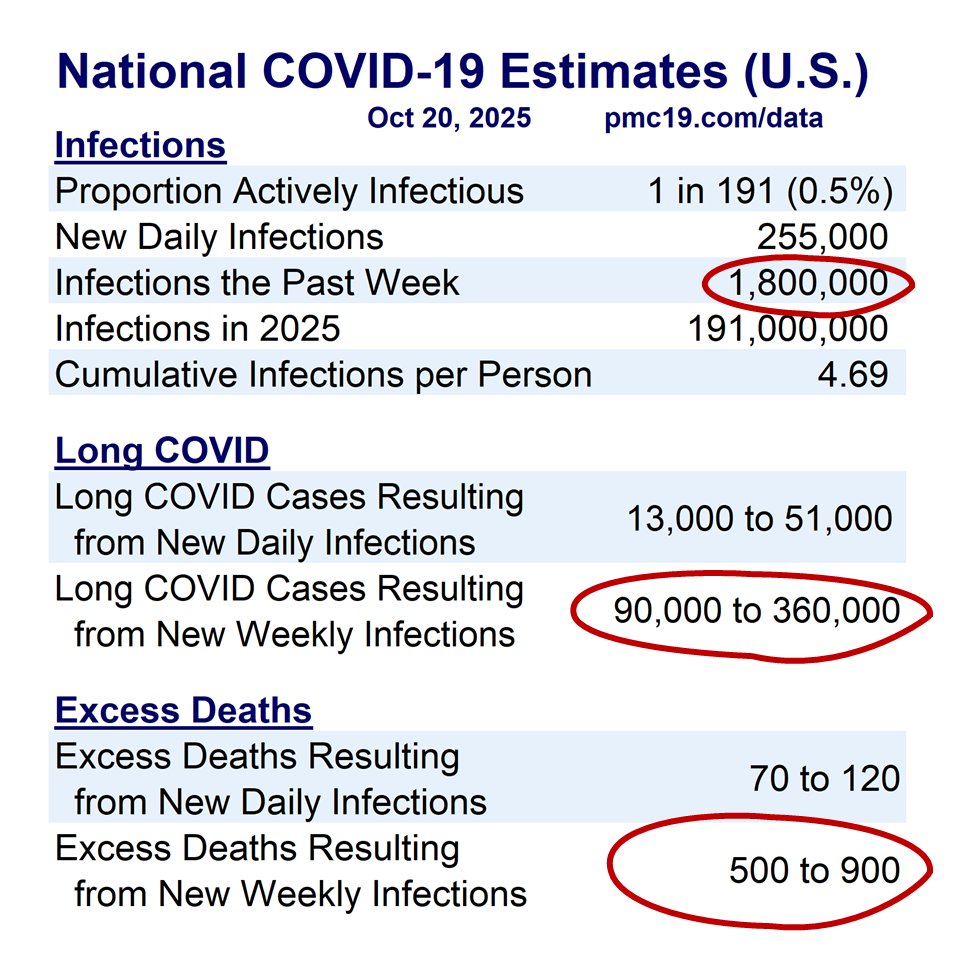
 Data in #Austria show a rising COVlD wave. The x axis (bottom) has infrequent labels, but the data shown go through October 8th.
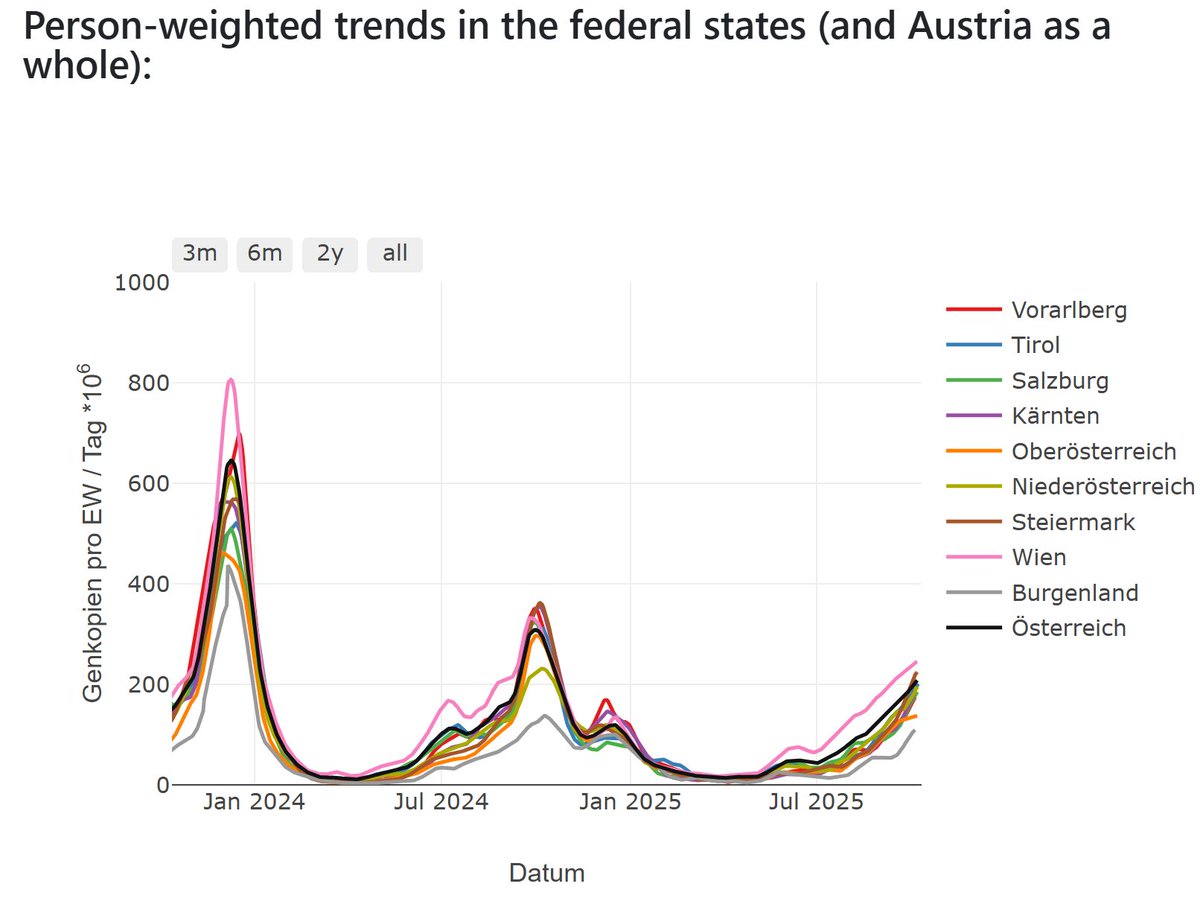
 PMC COVlD Update, Week of Oct 6, 2025 (U.S.)