If your county has Biobot #wastewater data, here's information on how to estimate the percentage of people in your area who are actively infectious.

Quick guide. 🧵

Here are a few examples to start.
1/
County, Biobot Wastewater Level (copies/mL), % Infectious Middlesex, MA (near Boston)	1296	3.9% Orange, FL (Orlando)	1100	3.3% Honolulu, HI	1030	3.1% Washington, DC	821	2.5% Shelby, TN (Memphis)	794	2.4% Dallas, TX	611	1.9% Nassau, NY (near NYC)	547	1.7% Palm Beach, FL (near Miami)	478	1.5% Los Angeles, CA	474	1.4% Clark, NV (Las Vegas)	422	1.3% San Diego, CA	350	1.1% Montgomery, PA (near Philadelphia)	350	1.1%
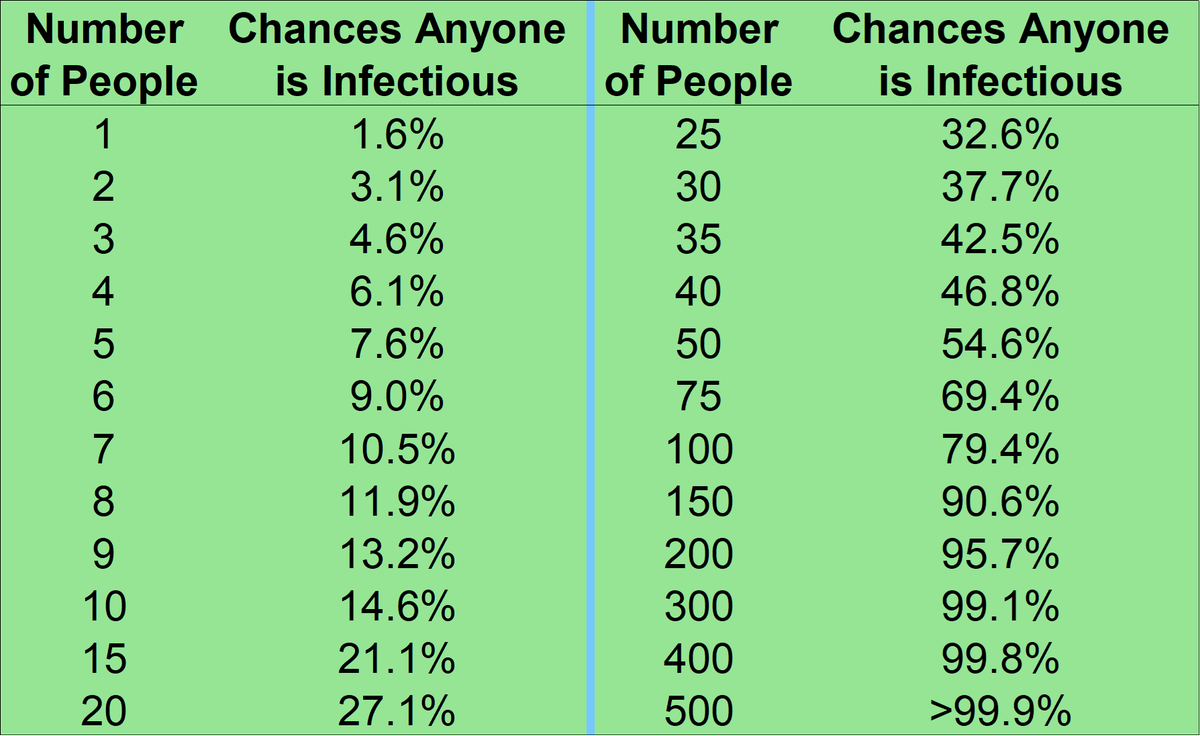
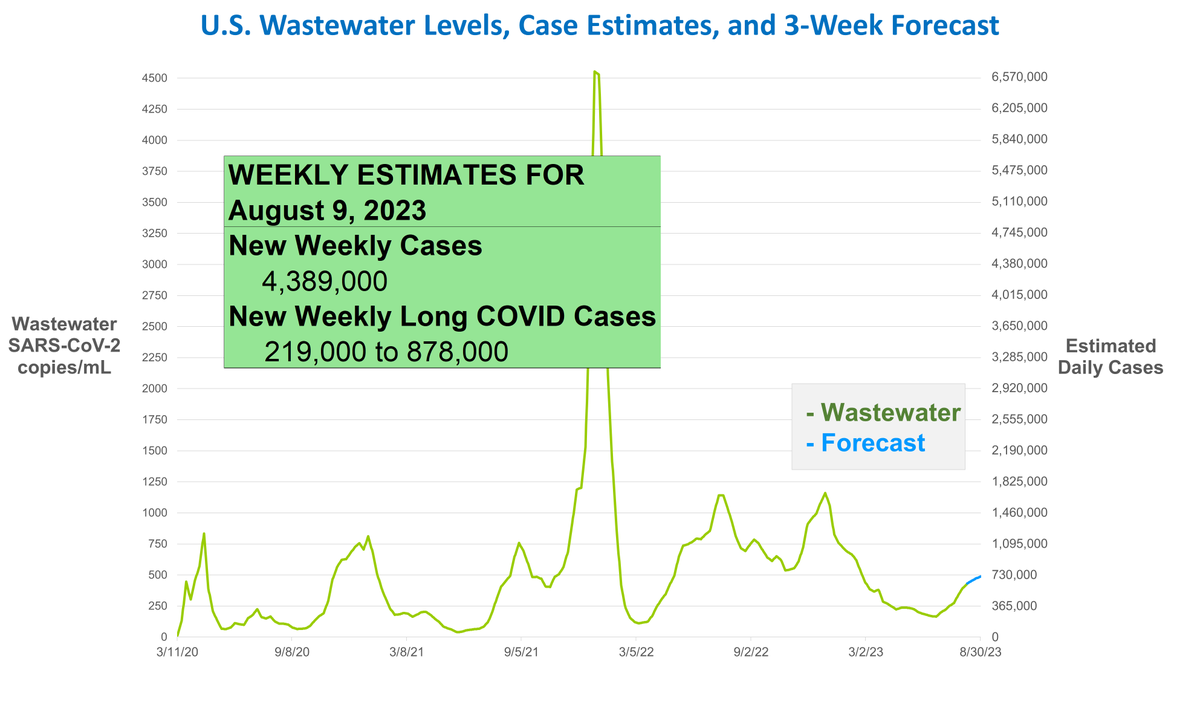
If you're not mathematically inclined, use this table. Look up your county's #wastewater levels (on Biobot only, not other sites), and simply convert it to the % infectious estimate.

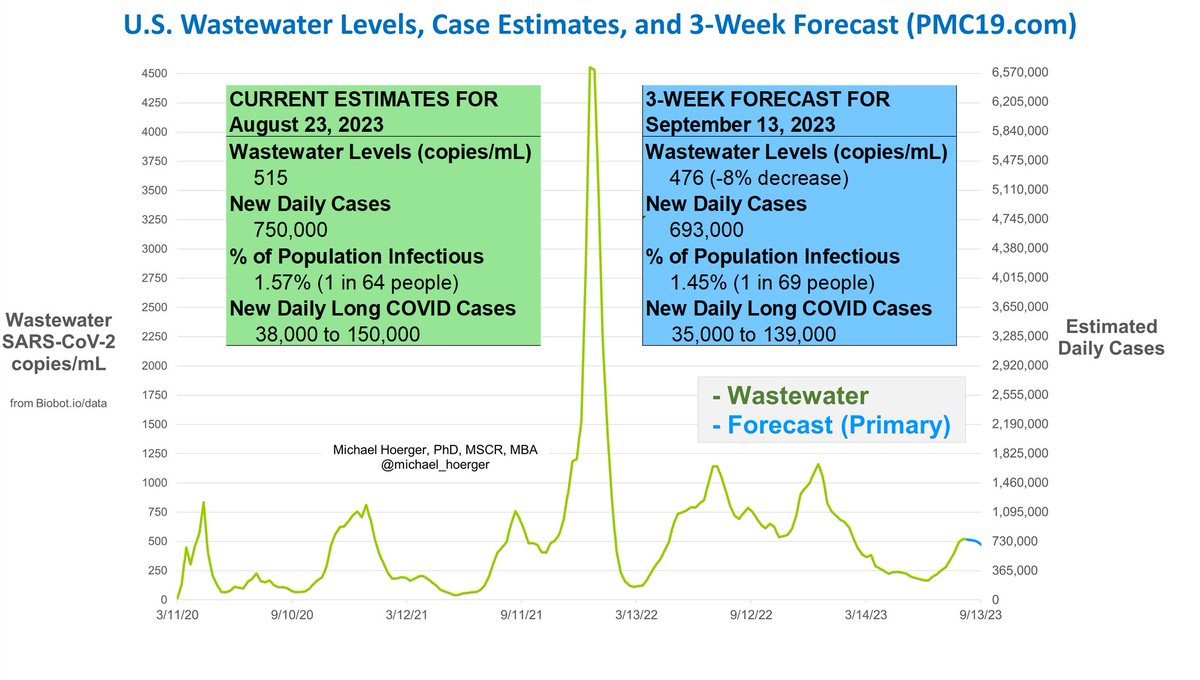
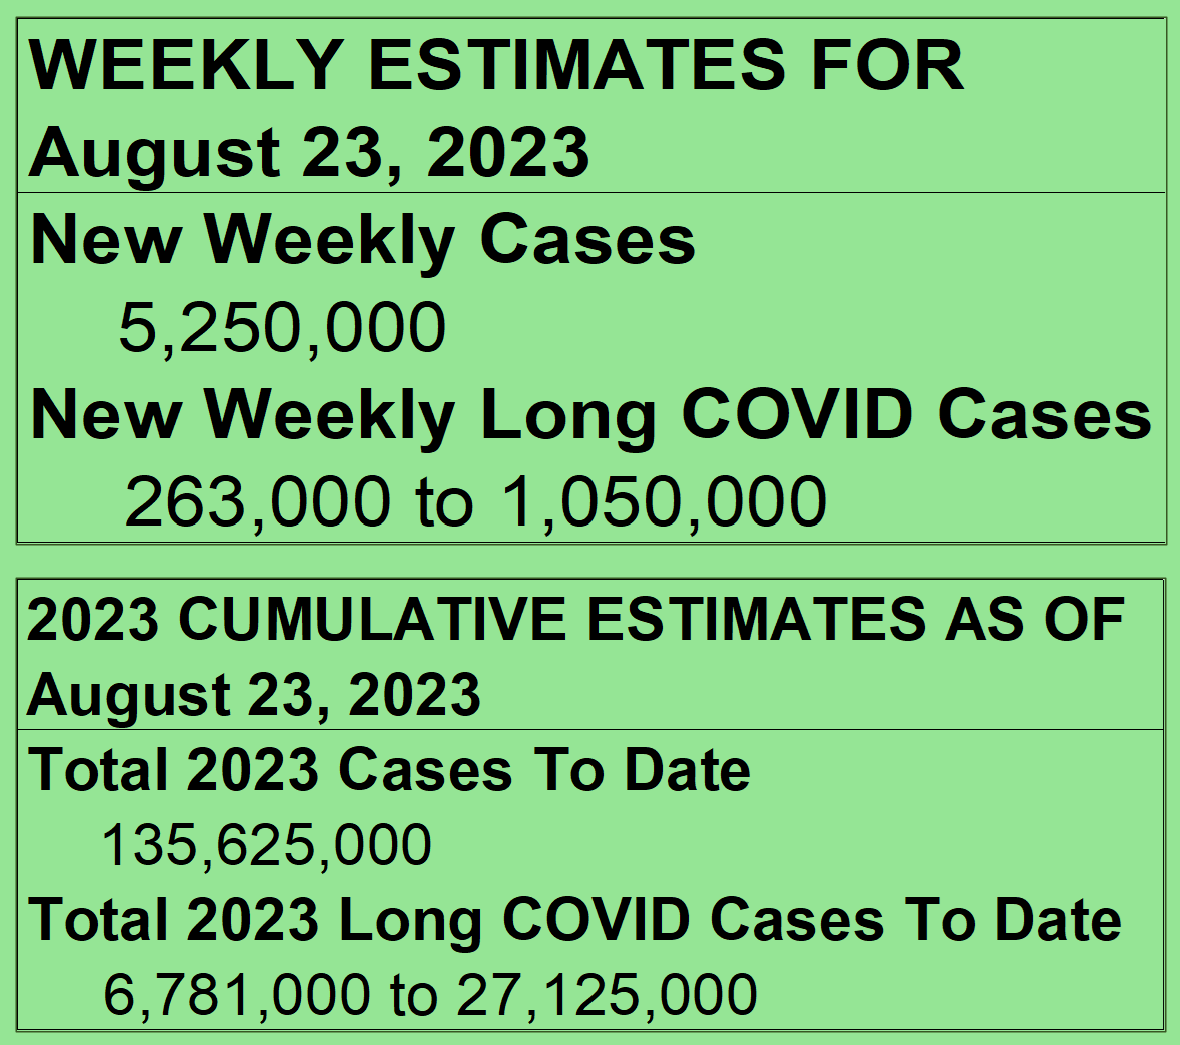
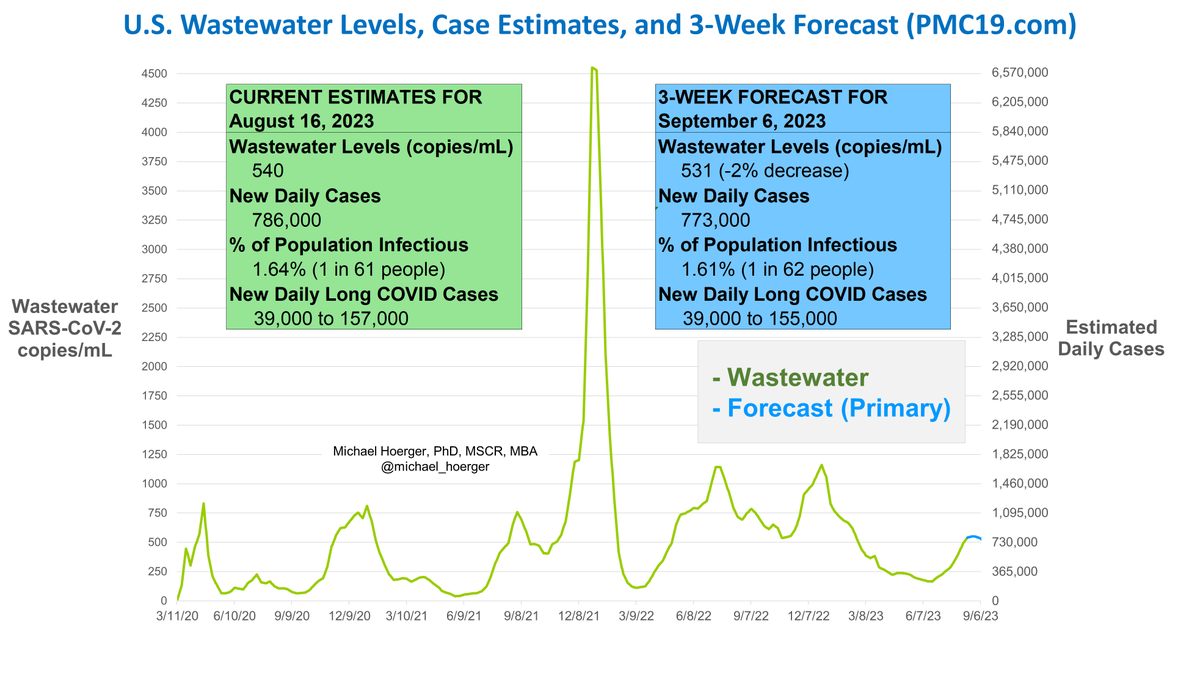
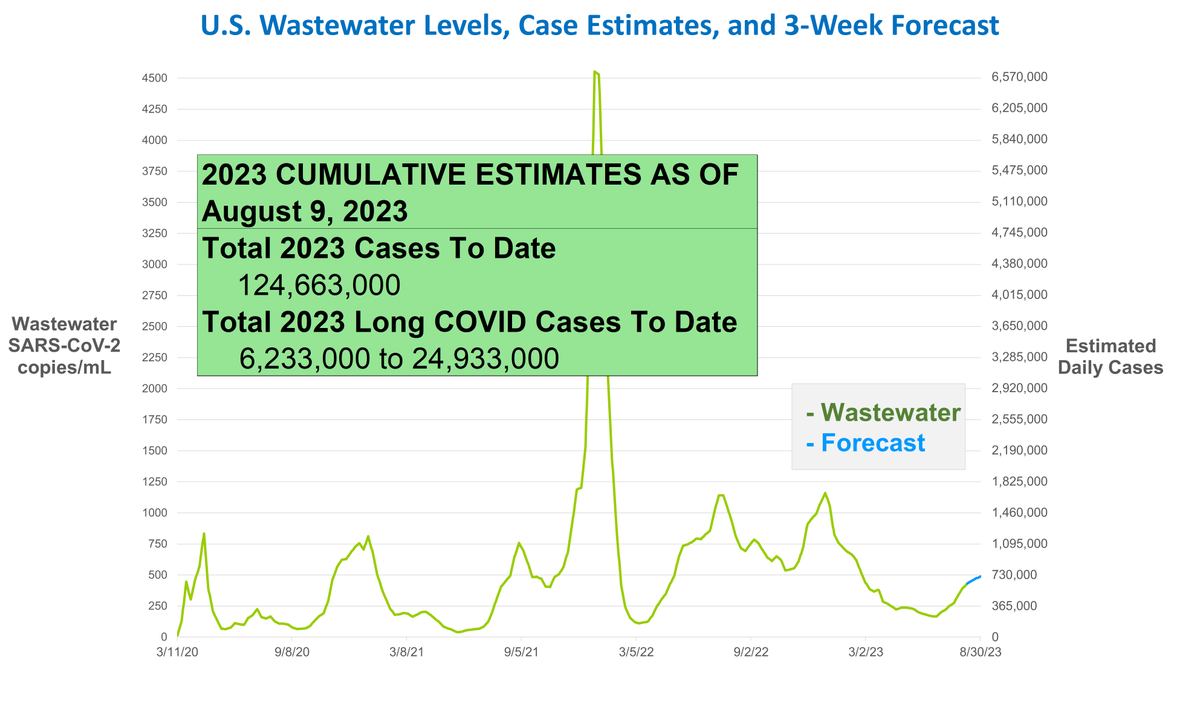
If wastewater levels are 1000 copies/mL, 3% of the county is infectious with C0VID.
2/ Biobot Wastewater Level (copies/mL), % Infectious 100	0.3% 200	0.6% 300	0.9% 400	1.2% 500	1.5% 600	1.8% 700	2.1% 800	2.4% 900	2.7% 1000	3.0% 1100	3.3% 1200	3.7% 1300	4.0% 1400	4.3% 1500	4.6% 2000	6.1% 2500	7.6% 3000	9.1% 4000	12.2% 5000	15.2%
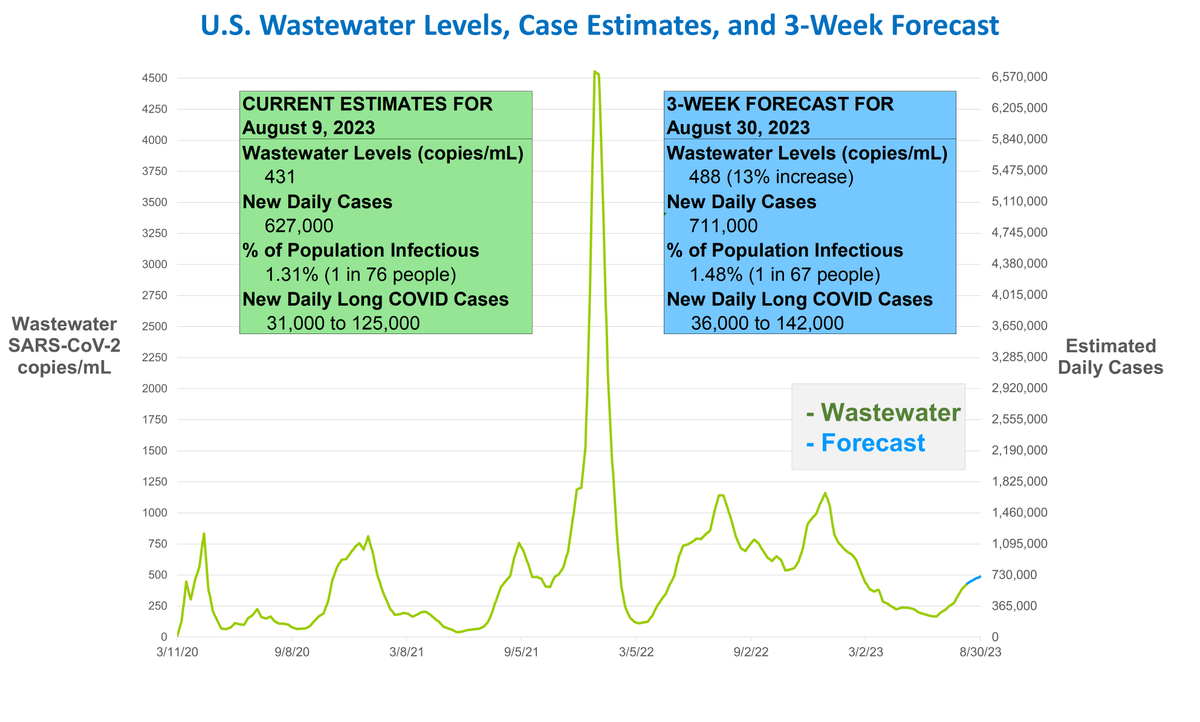
To precisely convert Biobot #wastewater levels to the % infectious, just take the Biobot levels and divide by 328. You'll get a percentage.

For example, national levels are at 641 copies/mL. 641/328 = 1.95. So, 1.95% of the U.S. is infectious.
3/ Formula (Long Version)			 Biobot Wastewater Level (copies/mL)	641		 Biobot Wastewater to Cases Multiplier	1455		Multiplier for Biobot to IHME case estimate conversions (uses a trimmed mean, most estimate in the 1000-1600 range) Average Infectious Window	7		https://doi.org/10.1016/S2213-2600(22)00226-0 Decimal to Percentage Multiplier	100		Turns decimals to percents U.S. Population, April 1, 2023	334,565,848		Final day of IHME data, source from https://www.census.gov/popclock/ Local Percent Infectious	1.95	%	=B2*B3*B4*B5/B6 			 			 Formula (Easy Version)			 Biobot Wastewater Level (copies/mL...
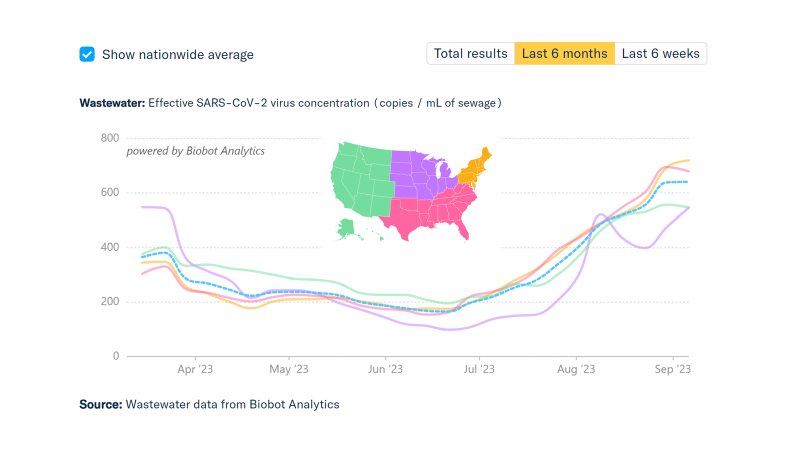
Caveats: Biobot attempts to normalize these estimates across geographic entities. You've probably seen regional comparisons before. Nothing is perfect, but these will give you some local estimates. The PMC model also makes assumptions about the infectious window, etc.

4/ Biobot regional variation map

• • •

Missing some Tweet in this thread? You can try to force a refresh
 

Keep Current with Mike Hoerger, PhD MSCR MBA

Mike Hoerger, PhD MSCR MBA Profile picture

Stay in touch and get notified when new unrolls are available from this author!

Read all threads

This Thread may be Removed Anytime!

PDF

Twitter may remove this content at anytime! Save it as PDF for later use!

Try unrolling a thread yourself!

how to unroll video
  1. Follow @ThreadReaderApp to mention us!

  2. From a Twitter thread mention us with a keyword "unroll"
@threadreaderapp unroll

Practice here first or read more on our help page!

More from @michael_hoerger

Sep 9
PMC C0VID-19 Tracker, Sep 6, 2023

U.S. #wastewater levels are higher than during 70% of the pandemic:
🔹1.95% (1 in 51) are infectious
🔹Nearly 1 million C0VID cases per day
🔹Causing >40,000 #LongCovid cases per day

Let's look at these wildly divergent forecasts for the next 4 weeks.

Real-time Model: If you assume Biobot is reporting accurate real-time wastewater data each week, follow the red line. This says we have peaked on our late summer wave. That would be great news in terms of less morbidity and mortality. The problem is that real-time reports have been prone to error lately, more often than not underestimating wastewater levels, and then corrected later.

Alt Model 1 (Turtle): The turtle model moves slow, like a turtle. It assumes the most recent week's data from Biobot are useless and ignores them. By ignoring the most recent data, it will be slow to detect a quick change in transmission, like a peak. It basically expects "more of the same" for a little longer. See green line.

Alt Model 2 (Cheetah): The cheetah model moves fast, like a cheetah. It assumes that if last week's Biobot wastewater data underreported levels by X% that this week's current real-time data are also underreporting by that same percent. Last week's real-time data were corrected upward by 15%, which makes a huge difference in forecasting whether we're leveling off or on a steep incline. The cheetah model has us getting up to 1.4 million cases/day, so this is a good model for a worst-case scenario. See yellow line.

Composite Model: This is the average of the three models. It's what we use in the red box for estimating cases 4 weeks from now. It's a good estimate if trying to cite a point estimate to coworkers (e.g., "The U.S. will see about 1 million new cases/day the next several weeks). However, from a forecasting perspective, it's less useful because the underlying models are so divergent. See black line.

Big-Picture Framing
The current state of the pandemic is extremely bad. Expect approximately 1 million new U.S. cases per day the next several weeks. Less if we're lucky, and more if we're not. As a psychologist, I would characterize denial about the current C0VID wave to peak in the next couple weeks. Most people believe "the pandemic is over" and we're "after C0VID." Expect further gaslighting for now.

#MaskUp #VaxUp #Ventilate #HEPA #CorsiRosenthalBox #remotework

1/
PMC 6-month view of wastewater levels, case estimates, and near-term forecast.   CURRENT ESTIMATES FOR September 6, 2023 Wastewater Levels (copies/mL) 641 New Daily Cases 933,000 % of Population Infectious 1.95% (1 in 51 people) New Daily Long C0VID Cases  47,000 to 187,000   4-WEEK FORECAST FOR October 4, 2023 Wastewater Levels (copies/mL) 716 (12% higher) New Daily Cases 1,042,000 % of Population Infectious 2.18% (1 in 46 people) New Daily Long C0VID Cases  52,000 to 208,000
Let's zoom out from the 6-month view to the full pandemic.

Given current levels and forecasts, we're in a wave of transmission similar to the winter of 2020-21 or Delta. 🔥🔥

178 million infections & >8 million #LongCovid cases in 2023 thus far.

2/ There is more COVID-19 transmission today        than during 70% of the pandemic.  CURRENT ESTIMATES FOR September 6, 2023 Wastewater Levels (copies/mL) 641 New Daily Cases 933,000 % of Population Infectious 1.95% (1 in 51 people) New Daily Long COVID Cases  47,000 to 187,000   WEEKLY ESTIMATES FOR September 6, 2023 New Weekly Cases 6,500,000 New Weekly Long COVID Cases  327,000 to 1,306,000   2023 CUMULATIVE ESTIMATES AS OF September 6, 2023 Total 2023 Cases To Date 178,600,000 Total 2023 Long COVID Cases To Date  8,930,000 to 35,720,000
With about 2% of the U.S. population actively infectious with C0VID, school and in-person work remain extremely risky.

Offer remote activities. #MaskUp. #VaxUp again when allowed. Read up on and improve indoor air quality. Avoid indoor dining. #RapidTest frequently.

3/ Number of People,	Chances Anyone is Infectious 1	2.0% 2	3.9% 3	5.7% 4	7.6% 5	9.4% 6	11.2% 7	12.9% 8	14.6% 9	16.3% 10	17.9% 15	25.6% 20	32.6% 25	38.9% 30	44.6% 35	49.8% 40	54.5% 50	62.7% 75	77.2% 100	86.1% 150	94.8% 200	98.1% 300	99.7% 400	>99.9% 500	>99.9% 25	38.9% 30	44.6% 35	49.8% 40	54.5% 50	62.7% 75	77.2% 100	86.1% 150	94.8% 200	98.1% 300	99.7% 400	>99.9% 500	>99.9%
Read 4 tweets
Sep 8
Did you know that @PeteUK7 runs these really spectacular discussions with world-leading C0VID experts?

You can tell that he and @AcrossTheMersey are *extremely* well prepared. The conversations often go way over. I just learned of this series. Here are my recent favs.

🧵
1/ Pete's Twitter bio
Conor Browne, bio-risk consultant, talks about how politics are dominating public health.
@brownecfm

2/
Liesl McConchie, on her efforts to improve C19 mitigation in schools. I will be doing my best to channel Liesl tomorrow.
@LieslMcconchie

3/
Read 8 tweets
Sep 1
PMC C0VID-19 Tracker, Aug 30, 2023

U.S. #wastewater levels are higher than during the majority (63.1%) of the pandemic:

🔹1.69% (1 in 59 people) are infectious
🔹800,000 new daily COVID-19 cases
🔹Causing 40-160K #LongCOVID cases per day

Technical details follow...
1/
What’s the Current State of the Pandemic?

We are near the peak (hopefully) of a 7th U.S. C0VID wave.

Transmission remains very high. The U.S. has seen >165 million infections this year, leading to at least 8 million #LongCOVID cases.

2/
How Well are the PMC Models Performing?

Deep dive:

3/

When our models are supplied with accurate real-time data, they are extremely accurate forecasting (e.g., R^2 = 96% for 1-week predictions).

Unfortunately, the Biobot real-time wastewater reports are often corrected substantially. If we had been supplied with the “correct” wastewater levels last week, we would have accurately predicted this week’s wastewater levels for the first time with 0% error (predicted: 554 copies/mL, actual: 554 copies/mL).

The PMC models place a huge emphasis on recent reports, so if recent reports are bad, this throws off the models. Indeed, prior Biobot data suggested the summer wave had peaked recently, and now it seems about 2 weeks away (if no surge).

These are actually quite marginal errors -- hopefully. Predicting the exact day of a “peak” amid a wide plateau is hard and of marginal relevance to decision making. It's like predicting the hottest day of the summer when it's about 100 degrees F for two months straight.

But even with these rough data, the overall pattern and levels remain close to predictions and historical averages.

The pandemic is not “over.”

When describing the current wave to people, it’s useful to characterize as “we’re somewhere between 2/3 Delta and Delta at present.” Avoid understating or overstating, as it will undermine credibility.

The point is to get the models as accurate as possible, even while the broader story remains unchanged (bad situation like Delta, worse than much of the past 6 months, hopefully peaking soon, better October, then 3 very bad months).

Given the issues with the real-time Biobot data, we’re updating the models in a few ways:

1) offering a few models and a composite
2) incorporating models that work around potential issues with the real-time reports (described next), and
3) adding additional external data (future models, which may incorporate air travel data, weather data, and more).
Read 5 tweets
Aug 25
PMC C0VID-19 Tracker, Aug 23, 2023

U.S. #wastewater levels are higher than during the majority (59.4%) of the pandemic:
🔹1.57% (1 in 64 people) are infectious
🔹750,000 new daily COVID-19 cases
🔹Causing 38,000 to 150,000 new #LongCOVID cases per day

More details…

1/

Where Are We Going?

If the model holds, viral transmission is currently plateauing at a high rate. The infection and estimated Long COVID numbers remain staggering. It’s a good time to move meetings remote, maintain or increase high-level precautions (mask more and better, get a booster if it’s been put off, increase testing when exposed, assume ill and test when symptomatic). In a month, transmission may be a little lower than now, but still high. This is not “declaring victory” or “minimizing.” The picture remains serious. However, the fewer people infected, disabled, or dead is always a good thing, and I think cause for some somber relief that hopefully we are not heading into a much steeper late-summer “surge.” If 2023 follows prior years, transmission will be a little lower than now in September and October and pick up again November through January.

What’s the Weekly Picture? How’s 2023 Been So Far?

The PMC model estimates over 5 million U.S. C0VID cases per week, leading to >250,000 weekly Long C0VID cases. The PMC model estimates over 135 million U.S. C0VID cases so far in 2023, leading to at least 6.7 million Long C0VID cases so far this year. These estimates are, arguably, quite conservative (lower limit assumes 5% of cases result in Long C0VID) and highly concerning. Another article published this week in Nature Medicine documents that too-often core elements of Long COVID persist, even at 2 years follow-up, and especially among people hospitalized during the acute illness phase. This is particularly troubling given that reinfections increase the likelihood of hospitalization.

Bowe, B., Xie, Y., & Al-Aly, Z. (2023). Postacute sequelae of COVID-19 at 2 years. Nature Medicine, 1-11.

What’s the Risk in an Office or in a Classroom?

The office and classroom risks remain quite bad. In a group of 10 people (daycare, team meeting, etc.), there’s nearly a 15% chance someone will have infectious COVID. In a group of 20-25 people (e.g., K-12 classroom, department meeting, busy hospital waiting room, etc.), there’s about a 30% chance someone would have infectious COVID. In a university classroom of 40-50 people, it should be assumed someone has infectious COVID. This is quite troubling for instructors or students who mix time with multiple groups of classmates each week.

Not all classrooms and meetings are the same. Virtual meetings reduce risk close to zero. Outdoor meetings are often safer than indoors. Testing reduces risk, as do policies that encourage people to stay home when symptomatic. High-quality, well-fitting masks greatly reduce risk. Air quality monitoring and improved air cleaning reduce risk. Recent boosters reduce risk. It remains troubling that elected leaders and public health officials choose to model poor mitigation when ongoing risk is so high.

What’s Going on in the “Midwest”?

The past two weeks, I cautioned that people were over-dramatizing a potential “surge” in the Midwest. This week’s regional data further bear out that conclusion.

How is the Forecast Performing?

The forecast continues to perform extremely well. This section will comment on accuracy and three main caveats. Last’s weeks model forecasted that we would have wastewater levels of 551 copies/mL today. Biobot corrected their August 16 real-time estimate downward from 540 to just 523 copies/mL, and today further corrected downward to 521 copies/mL. Today, we are at 515 copies/mL. Thus, the real-time forecast overestimated by 7.0%. Using the corrected data from earlier this week, the model estimated today’s levels would be 522 copies/mL, an overestimate of 1.4%. Using the corrected data reported today, the model would have forecasted 518 copies/mL, an overestimate of just 0.6%. That’s pretty good performance, especially given that we’re in a dynamic phase. It’s arguably much easier to be accurate when in a steady state than when transmission is accelerating or decelerating. Overall, the model continues to perform well.

Some caveats:

1) Real-time reporting from Biobot. If Biobot’s real-time reports are biased in a particular direction, this will mislead the forecast in biased fashion. If prone to error in either direction, the forecast will just have more noise. After a couple weeks of correcting real-time wastewater levels upward, this week Biobot corrected their real-time report estimates downward. That’s good news. We will continue to monitor real-time reports for bias, but at present, these issues seem pretty expectable. See last week’s report for more commentary on this type of issue.

2) Schools. Many schools have already opened, but some are just opening soon. The current model does not do a good job of accounting for specific events (e.g., holidays, schools opening, popular indoor concert tours). It’s based on the month of the year and the past 4 weeks of data. If there were something about schools opening this August/September that differed markedly from the past couple years, that would be cause for concern. That does not seem to be the case, but see caveat #3.

3) Variants. For the 1st time, we've got 6 different Omicron variants/subvariants circulating at >10% each in the U.S. See graphs of variant data. From a modeling perspective, I suspect this reduces random error in the model in the near-term (nothing new can explode with that much competition). However, over the long-term, we are in uncharted territory. This is why I continue to say that nobody knows what the state of the pandemic will be two months into the future.
What’s the Weekly Picture for C0VID-19? How’s 2023 Been So Far?

The PMC model estimates >5 million U.S. C0VID cases/week, leading to >250,000 weekly Long C0VID cases. That's 135 million C0VID cases so far in 2023, leading to >6.7 million #LongCOVID cases this year.

2/

More details...

These estimates are, arguably, quite conservative (lower limit assumes 5% of cases result in Long C0VID) and highly concerning. Another article published this week in Nature Medicine documents that too-often core elements of Long COVID persist, even at 2 years follow-up, and especially among people hospitalized during the acute illness phase. This is particularly troubling given that reinfections increase the likelihood of hospitalization.

Bowe, B., Xie, Y., & Al-Aly, Z. (2023). Postacute sequelae of COVID-19 at 2 years. Nature Medicine, 1-11.
What’s the C0VID-19 Risk in an Office or in a Classroom?

The office and classroom risks remain quite bad. In a group of 10 people (daycare, team meeting, etc.), there’s nearly a 15% chance someone will have infectious COVID.

3/

More details...

In a group of 20-25 people (e.g., K-12 classroom, department meeting, busy hospital waiting room, etc.), there’s about a 30% chance someone would have infectious COVID. In a university classroom of 40-50 people, it should be assumed someone has infectious COVID. This is quite troubling for instructors or students who mix time with multiple groups of classmates each week.

Not all classrooms and meetings are the same. Virtual meetings reduce risk close to zero. Outdoor meetings are often safer than indoors. Testing reduces risk, as do policies that encourage people to stay home when symptomatic. High-quality, well-fitting masks greatly reduce risk. Air quality monitoring and improved air cleaning reduce risk. Recent boosters reduce risk. It remains troubling that elected leaders and public health officials choose to model poor mitigation when ongoing risk is so high.
Read 7 tweets
Aug 18
PMC C0VID-19 Tracker, Aug 16, 2023

U.S. #wastewater levels are higher than during the majority (61.5%) of the pandemic:
🔹1.64% (1 in 61 people) are infectious
🔹786,000 new daily COVID-19 cases
🔹Causing 39,000 to 157,000 new #LongCOVID cases per day

More details…

1/

......................................

What’s the Weekly Picture? How’s 2023 Been So Far?

As shown in subsequent posts, the model estimates over 5.5 million U.S. C0VID cases per week, leading to >275,000 weekly Long C0VID cases. The model estimates over 130 million U.S. C0VID cases so far in 2023, leading to at least 6.5 million Long C0VID cases so far this year. These estimates are, arguably, quite conservative (lower limit assumes 5% of cases result in Long C0VID) and highly concerning. As noted previously, to put in context, about 2 million Americans get cancer per year. We’re basically ignoring a disease with high incidence, prevalence, and impairment in terms of very bad known consequences and unknown 5-10 year consequences.

What’s the Risk in an Office or in a Classroom?

As shown in subsequent posts, the office and classroom risks are presently quite bad. In a group of 10 people (daycare, team meeting, etc.), there’s a 15% chance someone will have infectious COVID. In a group of 20-25 people (e.g., K-12 classroom, department meeting, busy hospital waiting room, etc.), there’s about a 34% chance someone would have infectious COVID. In a university classroom of 40-50 people, it should be assumed someone has infectious COVID. This is quite troubling for instructors or students who mix time with multiple groups of classmates each week.

Not all classrooms and meetings are the same. Virtual meetings reduce risk close to zero. Outdoor meetings are often safer than indoors. Testing reduces risk, as do policies that encourage people to stay home when symptomatic. High-quality, well-fitting masks greatly reduce risk. Air quality monitoring and improved air cleaning reduce risk. Recent boosters reduce risk. It remains troubling that elected leaders and public health officials choose to model poor mitigation when ongoing risk is so high.

What’s Going on in the “Midwest”?

Last week, I cautioned against what many were interpreting as a “surge” in the “Midwest.” There was a spike in 2-3 counties in Kansas, Missouri, and a lesser extent in Iowa. That’s not a “Midwest surge” in my view. There are usually spikes in 5-ish BioBot counties at any given time, so it’s best to avoid overinterpreting if a few happen to fall within a very broad geographic region. The Midwest jumped from the lowest of the 4 regions to the highest. Now it’s (marginally) the lowest again. Good to avoid overinterpreting.

How is the Forecast Performing?

The forecast continues to perform extremely well given the data we have, but I will note some caveats and an alternative model.

Each week, BioBot corrects their wastewater level estimates for the last several weeks to account for slow reporting. Often these corrections are random (as likely to be overcorrections as undercorrections) and small, mostly affecting the prior week’s numbers. However, the past few weeks, they’ve had to make substantial corrections to the prior week’s numbers, increasing them by >10% (e.g., if they say 400 units/mL one week, the next week they end up correcting that value to 440 units/mL). This could be random error, but it could be a bias in the real-time data toward underestimating, such as if they regions with higher transmission experience delays reporting. Thus, this week, we report our standard model, which is quite conservative in many respects, and an alternative model that assumes an underestimation bias in the BioBot real-time data and predicts a slightly taller hill for the next few weeks.

I’ll walk you through our numbers. Last week’s (August 9) BioBot estimate was updated from 431 copies/mL to 490 copies/mL, an increase of 13.7%. Other updated values from prior weeks were marginal. Before those BioBot corrections (using the real-time data), we would have forecasted levels of 454 copies/mL for this week. After the BioBot corrections, we would have forecasted 554 copies/mL for this week. That’s a big difference. This week’s actual value is 540 copies/mL. Thus, the real-time forecast underestimated by 15.9%, so most of the error was driven by the BioBot data underreporting real-time wastewater levels. The model using BioBot’s corrected values underestimated by just 2.6%. In the last report, we underestimated by 1.9% with the corrected values.

The PMC reports are usually much more pessimistic than public perception of the pandemic, so it’s better to underestimate than overestimate at the margins. For now, we will continue to report our main model as primary. However, I’m also including an alternative model that assumes an underestimation bias in the real-time BioBot data. In future weeks, I may revise the model to avoid or correct current-week real-time data to improve the forecasting model further.

Please Disseminate on Other Platforms and Develop Useful Graphics

Please feel free to disseminate this information on other platforms. If you have graphic design skills, you’re welcome to develop images to highlight key statistics. What else would be helpful? What did we miss?
The PMC model estimates over 5.5 million U.S. C0VID cases per week, leading to >275,000 weekly #LongCOVID cases.

2/ WEEKLY ESTIMATES FOR August 16, 2023 New Weekly Cases 5,502,000 New Weekly Long COVID Cases  275,000 to 1,100,000
The PMC model estimates over 130 million U.S. C0VID cases so far in 2023, leading to at least 6.5 million #LongCOVID cases so far this year.

3/ 2023 CUMULATIVE ESTIMATES AS OF August 16, 2023 Total 2023 Cases To Date 130,381,000 Total 2023 Long COVID Cases To Date  6,519,000 to 26,076,000
Read 4 tweets
Aug 13
PMC C0VID-19 Tracker, Aug 9, 2023

U.S. #wastewater levels are higher than during the majority (53.4%) of the pandemic:
🔹1.31% (1 in 76 people) are infectious
🔹627,000 new daily COVID-19 cases
🔹Causing 31,000 to 125,000 new #LongCOVID cases per day

More details...

How is the… https://t.co/n2QbtOSuHxtwitter.com/i/web/status/1…
Line graph of BioBot wastewater data with 3-week forecast, summarized in Tweet.  U.S. #wastewater levels are higher than during the majority (53.4%) of the pandemic: 🔹1.31% (1 in 76 people) are infectious 🔹627,000 new daily COVID-19 cases 🔹Causing 31,000 to 125,000 new #LongCOVID cases per day
Based on the above numbers, the U.S. is seeing approximately 4.4 million new C0VID-19 cases per week.

Down the line, these weekly infections are anticipated to result in 219,000 - 878,000 #LongCOVID cases per week.

2/ The model estimates over 4 million U.S. C0VID cases per week, leading to >200,000 weekly Long C0VID cases.
There have been approximately 124 million C0VID-19 infections in the U.S. thus far in 2023.

That's roughly 1 in 3 Americans, even factoring in repeat infections during this year.

Those infections are anticipated to translate to >6 million #LongCovid cases.

3/ The model estimates over 124 million U.S. C0VID cases so far in 2023, leading to at least 6 million Long C0VID cases so far this year. These estimates are, arguably, quite conservative (lower limit assumes 5% of cases result in Long C0VID) and highly concerning. To put in context, about 2 million Americans get cancer per year. We’re basically ignoring a disease with high incidence, prevalence, and impairment in terms of very bad known consequences and unknown 5-10 year consequences.
Read 4 tweets

Did Thread Reader help you today?

Support us! We are indie developers!


This site is made by just two indie developers on a laptop doing marketing, support and development! Read more about the story.

Become a Premium Member ($3/month or $30/year) and get exclusive features!

Become Premium

Don't want to be a Premium member but still want to support us?

Make a small donation by buying us coffee ($5) or help with server cost ($10)

Donate via Paypal

Or Donate anonymously using crypto!

Ethereum

0xfe58350B80634f60Fa6Dc149a72b4DFbc17D341E copy

Bitcoin

3ATGMxNzCUFzxpMCHL5sWSt4DVtS8UqXpi copy

Thank you for your support!

Follow Us on Twitter!

:(