Jeff Gilchrist Profile picture
Sep 12, 2023 41 tweets 9 min read Read on X
Novavax & Moderna XBB.1.5 Fall Booster Performance

This thread provides some data from preprint studies about how well the updated #Novavax and #Moderna #booster #vaccine performs on recent #variants including some details on #immune #imprinting. 🧵1/ Graphic of COVID variants. Image from: https://www.fnha.ca/about/news-and-events/news/hot-topics-questions-about-covid-19-virus-variants-here-are-some-answers
An unrolled one-page web view for this long thread that may be easier to read or share can be found here ( ). 2/
If you want to learn more about how Novavax differs and some benefits it has compared to the mRNA vaccines including info about mixing mRNA and Novavax for even better results, see this thread ( ). 3/
While Pfizer has only put out a press releases about the lab performance of their fall boosters, Novavax has recently made their preprint study available for people to see the full details ( ). H/T: @Daniel_E_Park 4/biorxiv.org/content/10.110…
Looking at the methodology is important as it tells you what kind of previous variant exposure the test subjects had which helps you understand if it remotely resembles what your previous exposure experience may be. 5/
The Novavax fall booster is based on the XBB.1.5 "Kraken" variant and testing was done on mice and non-human primates in the lab so their results are estimates of how the updated vaccine could perform. 6/
** Pseudoviruses **
The other thing to point out is that the tests are using pseudovirus which is an approximation of the real thing so they can be conducted in lower biosafety level labs. 7/
Pseudoviruses don't continue to replicate making them safer to study and their surface is replaced with those of the SARS-CoV-2 virus to help get insight into how it might infect cells ( ). 8/the-scientist.com/news-opinion/w…
Unfortunately pseudoviruses can't be used to fully simulate how the virus propagates or study mechanisms which the virus uses to circumvent the body's immune system (which COVID-19 uses multiple tricks to do - ). 9/
Interesting side note that researchers are required to use pseudovirus because handling the real virus is dangerous to study even in a lab. 10/
Meanwhile the real virus is routinely found spreading throughout poorly ventilated indoor public spaces like schools and offices without any safety standards in place. 11/
You can learn more about additional layers of protection to help prevent you from being exposed to pathogens in the first place in this thread ( ). 12/
Many of the scenarios that Novavax used for the updated vaccine was the test subject first getting two bivalent (original + BA.5) doses (which were never commercially available to the public) and then one updated XBB.1.5 booster. 13/
People who got one mRNA bivalent BA.5 vaccine dose which was commercially available and also infected with a BA.5 variant may have an immune exposure in the same ballpark as this scenario. 14/
** Novavax Results **
Novavax included results with non-human primates were they tested a scenario with 2 original doses of vaccine and then a single XBB.1.5 booster which may be more likely for people who never got any kind of bivalent vaccine or Omicron COVID-19 infection. 15/
One dose of the updated Novavax booster elicits antibodies that can neutralize XBB.1.5 as expected but also XBB.1.16 "Arcturus", XBB.2.3 "Acrux" and the EG.5.1 "Eris" variant which is currently dominant in many places. 16/ Humoral Responses Following XBB.1.5 Booster in Rhesus Macaques. (A) Pseudovirus neutralization titers in rhesus macaques boosted with XBB.1.5 approximately 8 months after Prototype or bivalent (Prototype + BA.5) priming regimens. Sera were collected two weeks after the booster dose. Open circles represent individual data points, solid bars represent group geometric mean titers, error bars represent 95% confidence intervals, and the horizontal dashed line represents the assay limit of detection (LOD). Image from: https://www.biorxiv.org/content/10.1101/2023.08.30.554497v1.full
"Importantly, the XBB.1.5 booster was immunogenic irrespective of priming regimen, as the general population includes individuals primed with diverse vaccination and infection backgrounds." 17/
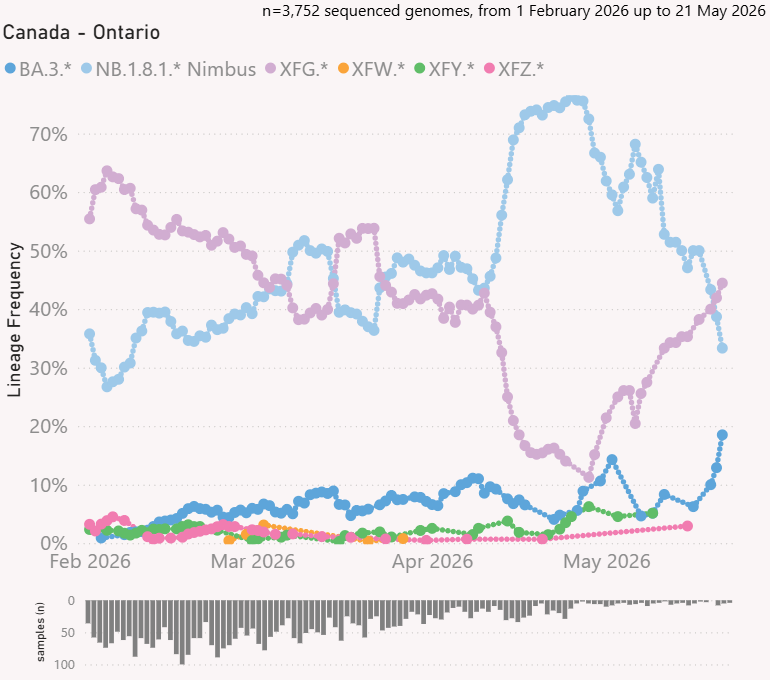
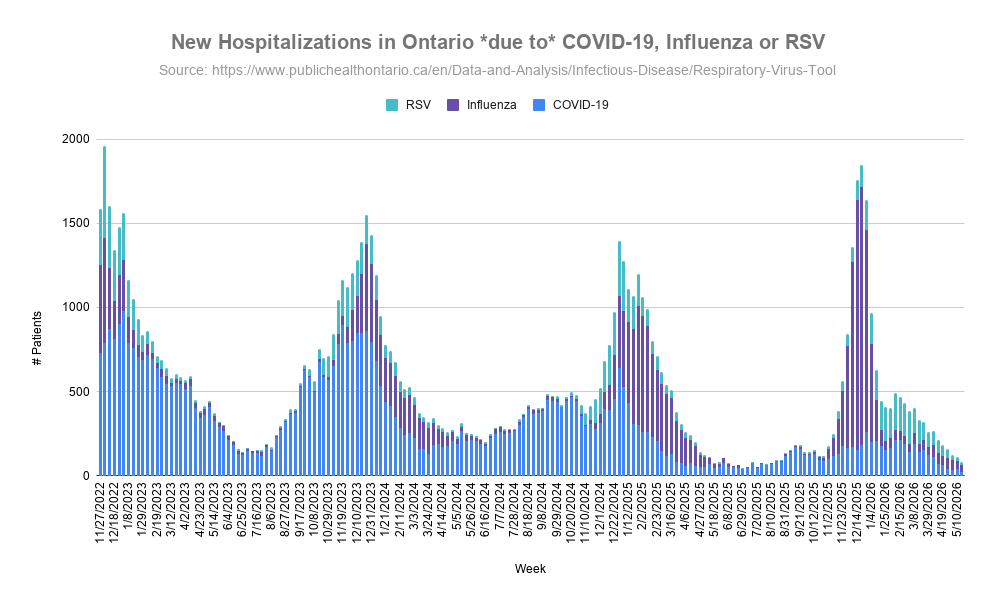
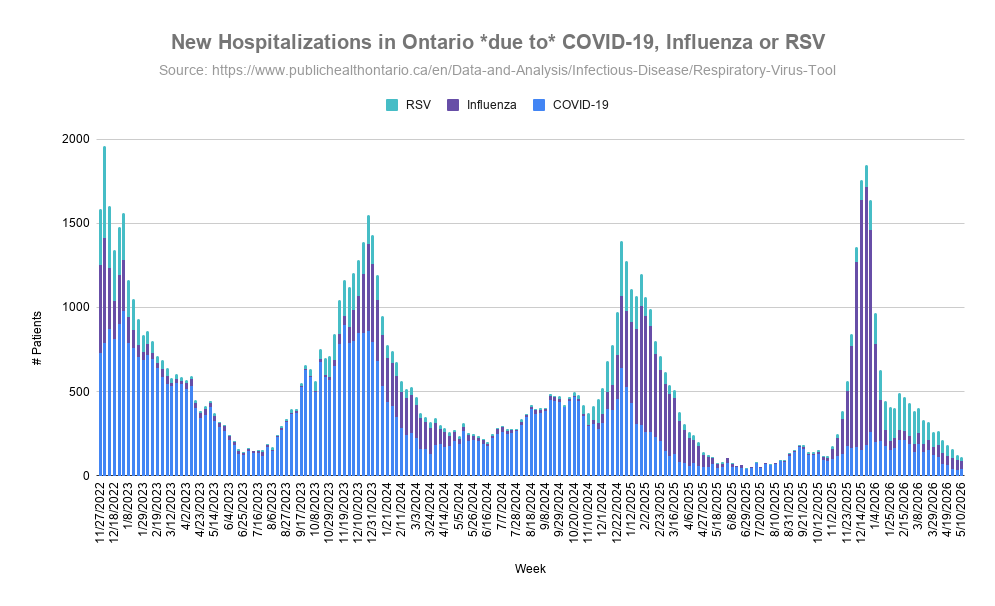
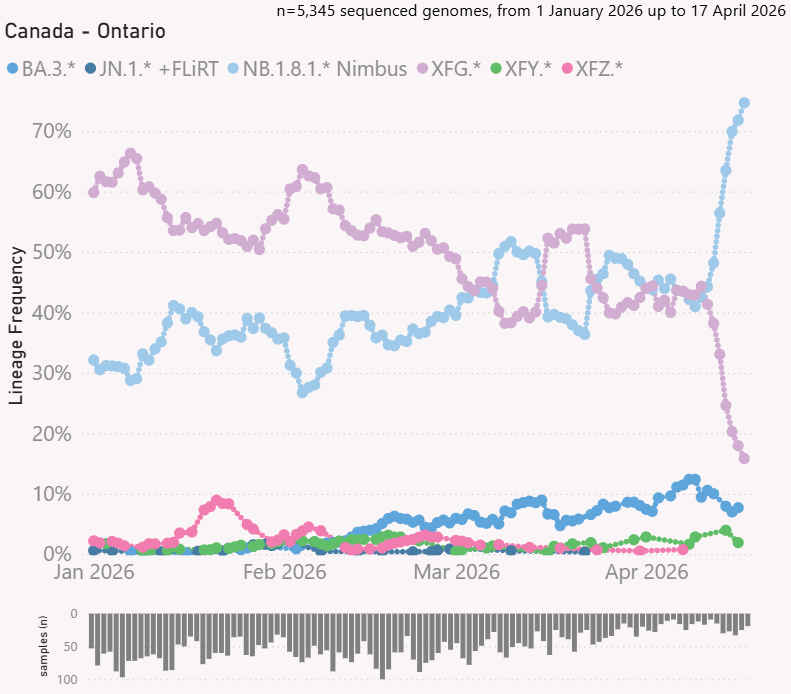
In Ontario, the variant families currently circulating the most are EG.5.1 "Eris", followed by XBB.1.9* "Hyperion", XABB.1.16* "Arcturus", still some XBB.1.5* "Kraken", XBB.2.3* "Acrux" and FL.1.5.1* "Fornax". Visualization by @Mike_Honey_ 18/ Graph of top 7 COVID variant family frequencies from PCR test genomic sequencing. Visualization tool was created by @Mike_Honey_ ( https://app.powerbi.com/view?r=eyJrIjoiNzE5YzczODItMDQzMS00M2EzLWFjNWYtMjg3OTY3NTNhZDM3IiwidCI6ImRjMWYwNGY1LWMxZTUtNDQyOS1hODEyLTU3OTNiZTQ1YmY5ZCIsImMiOjEwfQ%3D%3D )
** Moderna Results **
Moderna also released a preprint of their updated XBB.1.5 booster performance with pseudovirus lab test results involving humans test subjects ( ). 19/medrxiv.org/content/10.110…
Their participants all received 3 doses of the original Moderna mRNA vaccine and then 1 dose of the Moderna bivalent original/BA.5 booster dose. 20/
Participants then either received a monovalent XBB.1.5 booster or a bivalent XBB.1.5/BA.5 booster with a median time of 8 months from their 4th dose. They compared blood sera immune responses just before they got their updated booster with 15 days after the updated booster. 21/
Their first set of results looked at XBB.1.5, XBB.1.16 and older variants. The green bar graphs on the left are people who received a monovalent XBB.1.5 vaccine dose which is the one being made available to the public and the results to look at. 22/
While there was little neutralization activity of XBB.1.5 and XBB.1.16 before the updated booster, that increased significantly after the XBB.1.5 booster dose. 23/ Graphs of GM=geometric mean; GMFR=geometric mean fold rise at day 15 relative to pre-booster. GM-levels of neutralizing antibody titers were assessed at pre-booster and at day 15 post-vaccination for the monovalent (mRNA-1273.815) and bivalent (mRNA-1273.231) vaccines using a lentivirus-based pseudovirus assay as described previously3 and in the Supplementary Methods. Analyses were performed in all participants in the Per-protocol Set for Immunogenicity (those with and without prior SARS-CoV-2 infection), and in those with prior infection and without prior infection. Image from: https://www...
Moderna also released results with newer variants using a different pseudovirus and only a subset of their participants. Similarly, the vaccine showed significantly increased neutralization levels for XBB.2.3.2, EG.5.1, FL.1.5.1 and BA.2.86 after the booster dose. 24/ Analysis of neutralizing antibody titers against variants in randomly-selected all participants (n=20) and in those with (n=10) and without (n=10) SARS-CoV-2 infection from mRNA-1273.815 arm using a research grade VSV-based pseudovirus assay (supplementary methods). **p≤0.01 and ****p<0.0001 by the Wilcoxon t-test. Dotted line denotes the limit of detection (20) of the assay. Image from: https://www.medrxiv.org/content/10.1101/2023.08.22.23293434v2.full-text
Moderna found that vaccine adverse events were similar to those reported with their original and bivalent vaccines. 25/
** Immune Imprinting **
A number of people have been asking if the latest variants have changed so much, do we just need one booster dose of the updated vaccine or do we need two doses to be effective? 26/
@yunlong_cao discovered people needed more than one exposure of Omicron to generate *new* Omicron specific memory immune cells instead of just recalling the antibodies for the original COVID-19 virus elicited by the original vaccines ( ). 27/
For people who haven't been exposed to Omicron variants (either by infection or getting a bivalent BA.5 vaccine) may need two booster doses to produce new memory B cells targeting the updated variant ( ). 28/
Novavax found that having 2 doses of bivalent vaccine instead of just the original resulted in even higher levels of neutralization for all of the latest variants since having two BA.5 exposures helped. 29/
Novavax never released a BA.5 bivalent vaccine so people would have had to be infected with one or two Omicron variants to get a similar kind of exposure. While it seems the updated Novavax and Moderna XBB.1.5 vaccines elicit antibodies... 30/
...that can neutralize these latest variants, it still remains to be seen what percentage of those XBB.1.5 specific antibodies become memory immune cells to be recalled for the next exposure. 31/ Click "Show replies" 👇 to continue.
As @michaelzlin explains, for people who were never infected with an XBB or EG.5 variant, the XBB.1.5 booster will act like a priming event so may not be enough to protect against infection depending on the exposure level. 32/
If you then had an actual EG.5 or BA.2.86 infection after the XBB.1.5 booster, your immune system should produce antibodies rapidly enough to prevent more severe disease ( ). 33/
The Novavax study provides a good example of how memory B cells will recall antibodies for specific variants it has been exposed to before. The original vaccine (Prototype) on its own (left side) produces antibodies with high levels of neutralization... 34/
for the original variant (first column) , but low levels for XBB.1.5 (third column). Similarly on the right side, the XBB.1.5 vaccine on its own produces antibodies with low levels of neutralization for the original variant but high for XBB.1.5. 35/ Pseudovirus neutralization in mice sera collected one week following primary series vaccination with two doses of monovalent Prototype, XBB.1.5, or XBB.1.16. Open circles represent individual data points, solid bars represent group geometric mean titers, error bars represent 95% confidence intervals, and the horizontal dashed line represents the assay limit of detection (LOD). Image from: https://www.biorxiv.org/content/10.1101/2023.08.30.554497v1.full
But when you had two doses of the original vaccine and then get an XBB.1.5 booster dose the antibodies that get produced have the highest neutralization for the original (Prototype) variant because earlier memory B cells for the original variant still exist... 36/ Humoral Responses Following XBB.1.5 Booster in Rhesus Macaques. (A) Pseudovirus neutralization titers in rhesus macaques boosted with XBB.1.5 approximately 8 months after Prototype or bivalent (Prototype + BA.5) priming regimens. Sera were collected two weeks after the booster dose. Open circles represent individual data points, solid bars represent group geometric mean titers, error bars represent 95% confidence intervals, and the horizontal dashed line represents the assay limit of detection (LOD). Image from: https://www.biorxiv.org/content/10.1101/2023.08.30.554497v1.full
and were restimulated by the XBB.1.5 vaccine, explaining the high neutralization levels. The antibodies are now a mixture of old and new instead of mostly being targeted to newer variants. 37/
In order for your immune system to start focusing on the newer variants and storing more memory cells specifically targeting them, @yunlong_cao's study found you need multiple exposures. 38/
You can see the same thing in the Moderna results where the neutralization levels of the original variant (Ancestral D614G) is already high before the booster (similar to the post-booster levels of XBB.1.5) and... 39/ Graphs of GM=geometric mean; GMFR=geometric mean fold rise at day 15 relative to pre-booster. GM-levels of neutralizing antibody titers were assessed at pre-booster and at day 15 post-vaccination for the monovalent (mRNA-1273.815) and bivalent (mRNA-1273.231) vaccines using a lentivirus-based pseudovirus assay as described previously3 and in the Supplementary Methods. Analyses were performed in all participants in the Per-protocol Set for Immunogenicity (those with and without prior SARS-CoV-2 infection), and in those with prior infection and without prior infection. Image from: https://www...
...then multiple times higher than the XBB.1.5 levels after the booster showing massive production of antibodies targeting the original variant still. 40/
@threadreaderapp please unroll

• • •

Missing some Tweet in this thread? You can try to force a refresh
 

Keep Current with Jeff Gilchrist

Jeff Gilchrist Profile picture

Stay in touch and get notified when new unrolls are available from this author!

Read all threads

This Thread may be Removed Anytime!

PDF

Twitter may remove this content at anytime! Save it as PDF for later use!

Try unrolling a thread yourself!

how to unroll video
  1. Follow @ThreadReaderApp to mention us!

  2. From a Twitter thread mention us with a keyword "unroll"
@threadreaderapp unroll

Practice here first or read more on our help page!

More from @jeffgilchrist

Oct 25
How does various mask fit compare to filter the air and protect you or others?

Most masks, even baggy blue procedure masks use filtering material that can filter 95%+ of particles that pass through it, but the key is "pass through it". 🧵1/ Bar chart titled “Equivalent Exposure Time to Unmasked Person.” The chart compares how long different masks/respirators extend the equivalent exposure time relative to being unmasked. The x-axis shows unmasked infection times of 1, 5, and 10 minutes. The y-axis shows equivalent masked exposure time, ranging up to 5000 minutes. Seven mask types are represented by colored bars: - Procedure mask (loose fit, FF=2) - Ear loop mask (tight fit, FF=6) - Vertical bifold headband mask (FF=30) - N95 headband masks with fit factors of 100, 200, and 500 Key pattern: higher fit factor masks dramatically ...
Protection mostly depends on how well that mask fits your specific face and one that does not fit well, much of the air you breathe will go around the filter material and filter 0% of those particles. 2/
There has been a chart going around recently that talks about "Time it takes to transmit an infectious dose of COVID-19" which is misleading if you don't understand all of the details of how that table was made and what each component means. 3/
Read 25 tweets
Oct 19
** Ontario Variant Update (to Oct. 3, 2025) **

The XFG.* "Stratus" family is accounting for 83% while the next closest variant family NB.1.8.1.* "Nimbus" is 12.8% of sequenced genomes from COVID tests. 🧵1/ Line graph showing COVID-19 variant family frequencies in Ontario, Canada, from June to October 2025, based on 3,722 sequenced genomes.
Looking at specific variants, XFG.3 has dropped considerably and its descendent XFG.3.15 now takes first place at 6.2%, followed by XFG.3 at 5.2% and XFG.2 at 4.5%. 2/ Line graph showing specific COVID-19 variant frequencies in Ontario, Canada, from June to October 2025, based on 3,722 sequenced genomes.
It looks like PY.1.1.1 was trying to make a run for the top in mid-September but has decreased significantly. PY.1.1.1 is a descendant of LF.7 while the XFG variant is a recombination of LF.7 and LP.8.1.2 so they would share some mutations in common. 3/
Read 10 tweets
Sep 9
*** Ontario Variant Update (to: Aug. 16, 2025) ***

Ontario COVID sequence updates have been more frequent over the past month with the XFG.* "Stratus" family of variants now at 74% of sequences, NB.1.8.1.* "Nimbus" at 22% and LP.8.1.* down to 3%. #Variants #XFG #Stratus 🧵1/ Line graph showing COVID-19 variant frequencies in Ontario, Canada, from May to mid August 2025, based on 1,772 sequenced genomes. The XFG.* Stratus variant rises sharply to dominate over 70% by August. Other variants, including FLiRT and LP.8.1.*, decline over the same period, while NB.1.8.1.* Nimbus remains steady around 20% and several minor variants remain at low levels.
Looking at specific variants as of mid August, XFG.5.1 is most prevalent at 13%, NB.1.8.1 in second at 10%, XFG.2 in third at 8.6% and XFG.3 in fourth at 7.4%. 2/ Line graph showing COVID-19 variant frequencies in Ontario from 5 July to 16 August 2025, based on 750 sequenced genomes. Seven variants are tracked: NB.1.8.1, XFG.2, XFG.3, XFG.3.4.1, XFG.3.1, XFG.4.1, and XFG.5.1. Frequencies range from 0% to about 14%, with some variants rising, others falling, and some fluctuating over time. A bar chart below shows the number of samples collected on each date.
LP.8.1 is what this fall's Japan Novavax vaccine and the mRNA vaccines are designed for which is now almost gone and typical of how these things work with vaccine manufacturing timing while Novavax is providing the previous year's JN.1 vaccine formula for the USA again. 3/
Read 18 tweets
Jun 9
Understanding Canadian Air Quality Health Index (AQHI) & Wildfire Smoke

Wildfire smoke consists of toxic gases and particulate matter (PM) when breathed in gets into our lungs, bloodstream, and even our brain. 🧵1/
#iaq #wildfire #smoke #AQI #AQHI #Canada Bar chart of Canadian Air Quality Health Index (AQHI) - Equivalent # Cigarettes after Exposure ranging from 0.5 cigarettes after 8 hours exposure at AQHI level 3 to 0.9 cigarettes at level 6 and 1.5 at level 10.
Graph of Particulate Matter (PM) Levels in Ottawa from June 6, 2025 to June 8, 2025 from a VisiblAir Model X air quality sensor ( https://visiblair.com/ ).
The web version of this article with nice table of contents and easy to share with others can be found here ( tinyurl.com/AQHIwildfire ) and ( docs.google.com/document/d/1s9… ). 2/ Table of Contents: * Introduction * Air Quality Health Index (AQHI) * Health impact of Wildfire Smoke * Protect Yourself
When smoke stays in the air for prolonged periods of time, the UV radiation from the sun interacts with all the volatile organic compounds (VOCs) to form even more toxic gases ( ). 3/theweathernetwork.com/en/news/weathe…
Read 41 tweets
Jun 6
Pollution levels in Ottawa are very high from wildfire smoke. The particulate matter (PM)2.5 levels surpassed 140 ug/m^3 Thursday evening and are still above 130 on my VisiblAir Model X outdoor sensor ( ). 🧵1/ #iaq #wildfire #smoke visiblair.comLine graph showing PM2.5 levels in Ottawa increasing above 140 ug/m^3 and still above 130 now
Readings from a VisiblAir Model X outdoor air quality monitor showing levels in Ottawa above 130 ug/m^3 for PM2.5 wildfire smoke pollution
The EPA maps fine particulate pollution to their Air Quality Index where anything above 125.5 PM is Very Unhealthy which is a "Health alert: The risk of health effects is increased for everyone" ( ). 2/airnow.gov/aqi/aqi-basics/
EPA Categories:
* Unhealthy for Sensitive Groups (Orange) = 35.5-55.4 PM ug/m^3
* Unhealthy for everyone (Red) = 55.5 to 125.4 PM ug/m^3
* Very Unhealthy (Purple) = 125.5 to 225.4 PM ug/m^3
* Hazardous (Brown) = 225.5+ PM ug/m^3

3/
Read 13 tweets
Feb 10
#Ottawa, #Ontario, #Canada Virus Update:

You can see in the graph, COVID makes up the majority of new hospitalizations due to #Flu, #RSV or #COVID throughout the year, and even stays ahead during winter respiratory virus season. 🧵1/ A line graph displaying the percentage of patients hospitalized due to COVID-19, Influenza, or RSV over time, from September 1, 2023, to January 26, 2025. The x-axis represents weeks within this period, and the y-axis shows percentages from 0% to 100%. The graph has three colored lines: blue for COVID-19, purple for Influenza, and teal for RSV. The graph shows fluctuations in the percentage of hospitalizations due to each cause over time, with COVID-19 consistently having the highest percentage, followed by Influenza and RSV.
New hospitalizations are increasing again. This last update was the first time Flu hospitalizations (42) were significantly higher than COVID (34) in the same week with RSV at 14 people. 2/ The bar chart shows the number of new hospitalizations per week in Ottawa from August 27, 2023, to January 26, 2025. The y-axis represents the number of patients, ranging from 0 to 100. The x-axis represents the weeks. The bars are color-coded: blue for COVID-19, purple for Influenza, and teal for RSV. The chart shows fluctuations in hospitalizations over time, with notable peaks around December 2023 and January 2025.
In Ottawa, test positivity for Flu A (bright green) has really increased, COVID is still in second place, but seasonal human coronavirus is almost the same level, followed by Entero/Rhinovirus, and then RSV for the top 5. 3/ A stacked area chart displaying the percentage of positive tests for various viruses over time, from October 1, 2022, to January 26, 2025. The x-axis represents weeks within this period, while the y-axis represents the percentage, cumulatively stacked to 100%. The chart features the following viruses, each depicted in a distinct color: COVID-19 (red), Entero/Rhinovirus (yellow), Seasonal human coronavirus (purple), RSV (green), Parainfluenza (all types) (blue), Influenza B (dark purple), Influenza A (light green), Human metapneumovirus (pink), and Adenovirus (dark blue). The data shows fluc...
Read 6 tweets

Did Thread Reader help you today?

Support us! We are indie developers!


This site is made by just two indie developers on a laptop doing marketing, support and development! Read more about the story.

Become a Premium Member ($3/month or $30/year) and get exclusive features!

Become Premium

Don't want to be a Premium member but still want to support us?

Make a small donation by buying us coffee ($5) or help with server cost ($10)

Donate via Paypal

Or Donate anonymously using crypto!

Ethereum

0xfe58350B80634f60Fa6Dc149a72b4DFbc17D341E copy

Bitcoin

3ATGMxNzCUFzxpMCHL5sWSt4DVtS8UqXpi copy

Thank you for your support!

Follow Us!

:(