Jamie Coutts CMT Profile picture
Sep 14 16 tweets 5 min read Twitter logo Read on Twitter
The #Bitcoin energy narrative is flipping! A new note out this morning on the Bloomberg Terminal looks at the rapid rise of sustainable energy sources in $BTC mining
🧵 Image
Since 2016, I have noticed the attacks on Bitcoin's energy usage intensify. I will put aside the piousness of the argument that one form of energy use is better than another (that's a thread for another time)

Image
Image
Image
Firstly, there has been a big improvement in data visibility & modelling.@DSBatten @coinmetrics @JMellerud have contributed greatly to the space, building on the initial work from the pioneer @CambridgeAltFinrefin. Hopefully we start to see less variability btw models Image
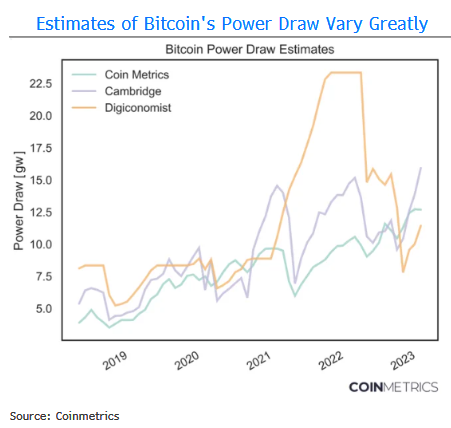
@CambridgeAltFinrefin recently revised its 2022 estimate of electricity consumption from 95.5 terawatt-hours (TWh) from 105.3 TWh, after Coin Metrics produced a more accurate assessment of the application-specific integrated circuit (ASIC) machines used in the mining process.
Further enhancements by @DSBatten, a climate-tech VC, address deficiencies in the Cambridge model which exclude new sustainable energy sources such as off-grid power and flared gas, and the massive geographical shift to less fossil fuel-intensive grids of the past 3yrs.
Emissions Decline as Energy Use⬆️
👉Despite 4x Hashrate, carbon emissions (blue) are only⬆️6.9% since 2019
🤔Remember, Miners don't "emit" but are consumers of purchased electricity (similar to EVs) Image
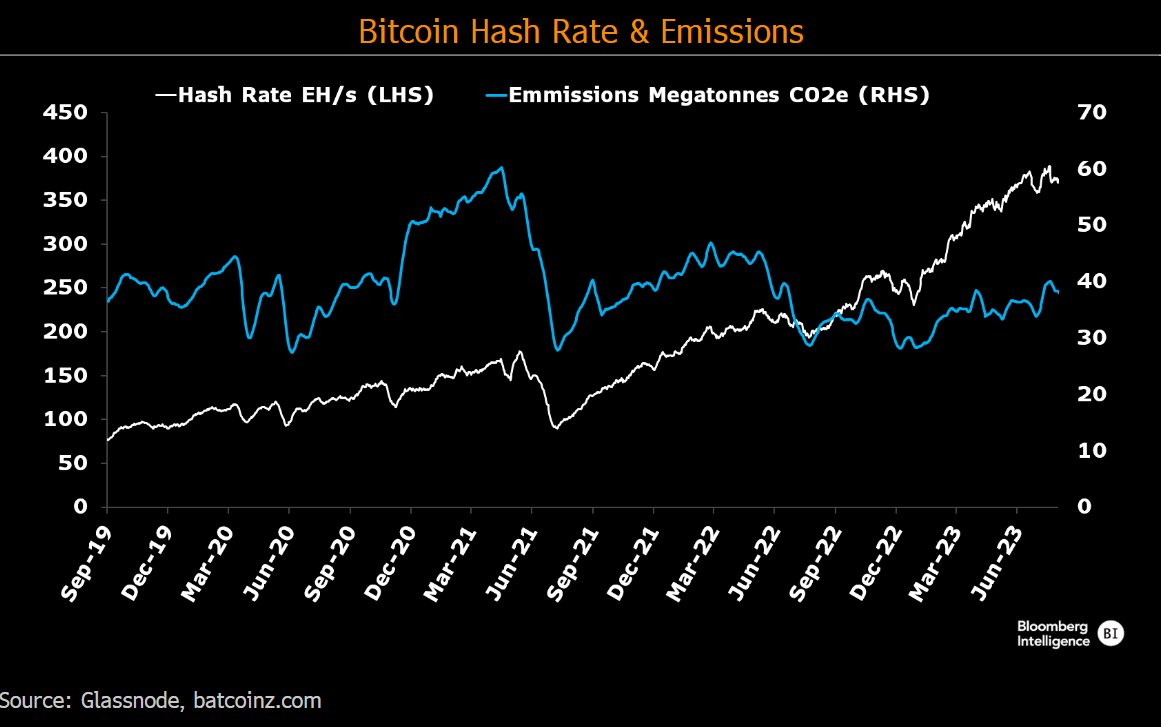
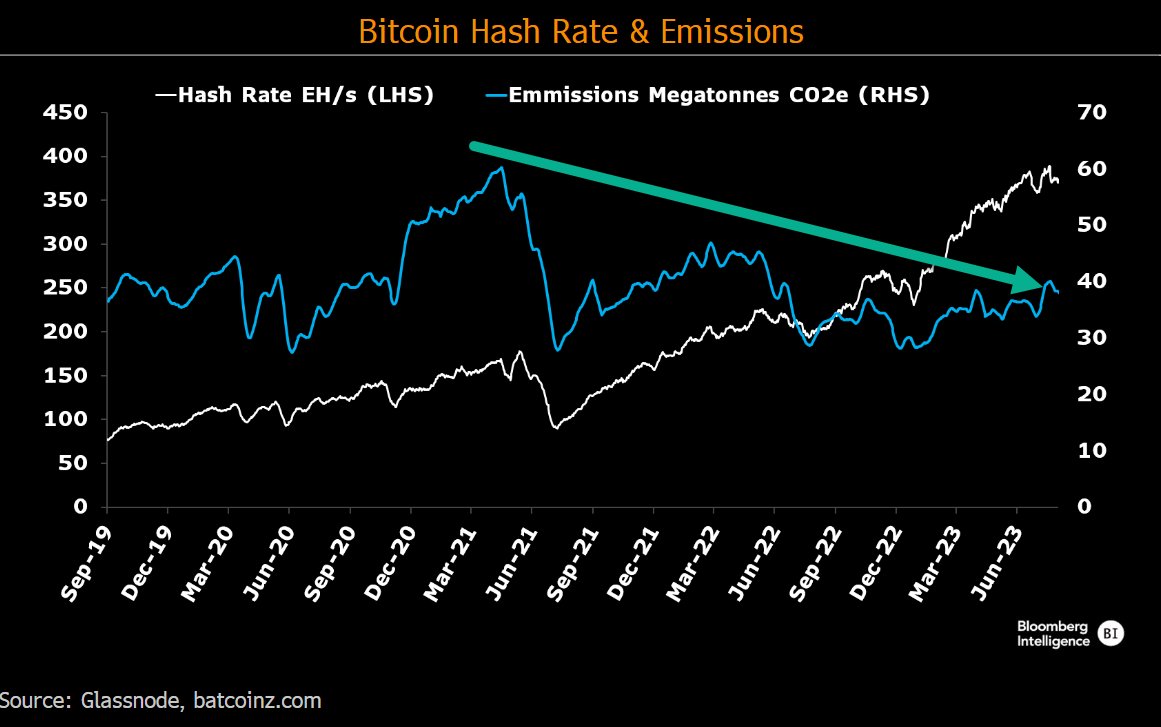
👉Since China's mining ban in mid-2021 when emissions peaked at 60.9 megatonnes of carbon dioxide equivalent (CO2e), emissions have declined 37.5%
👉suggesting the concern about Bitcoin's carbon footprint are being overstated Image
Sustainable Energy Sources Rise >50%
👉Falling emissions plus a dramatically rising hash rate can only mean one thing; Bitcoin mining is consuming more sustainable energy in its mix. Image
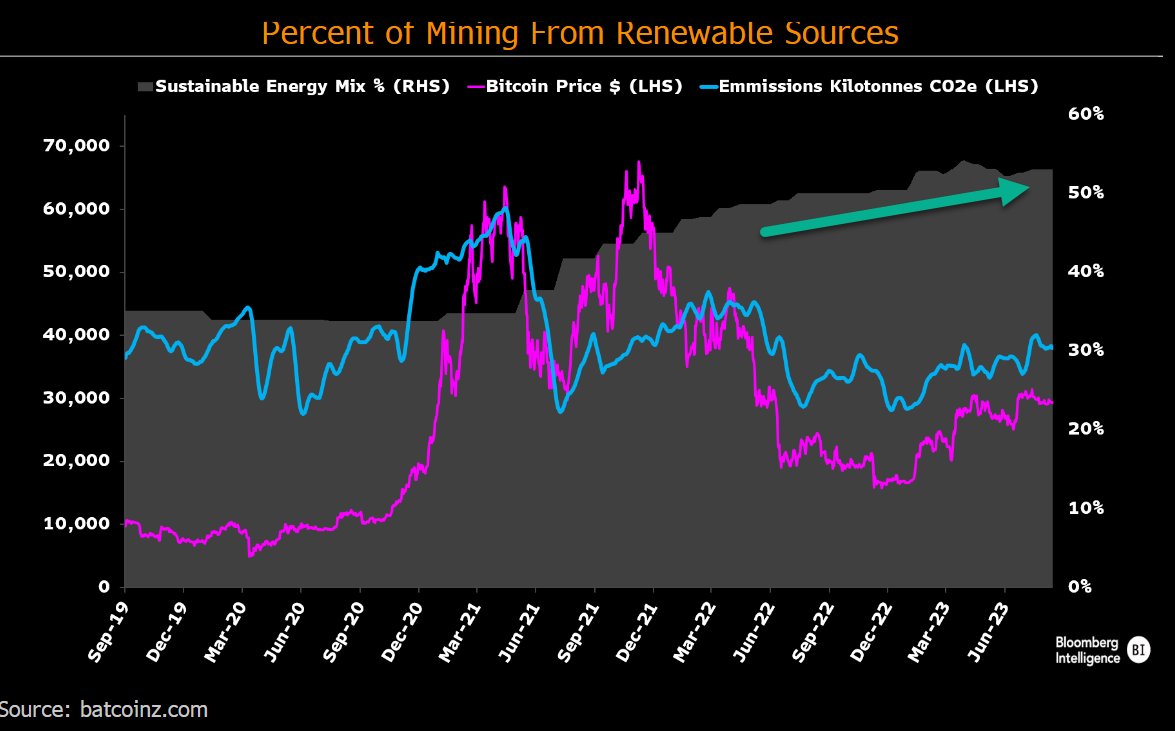
While a significant % of mining occurs privately and off-grid, estimating energy use remains an imperfect science. Its also an incredibly fast moving industry. That said, @DSBatten modelling appears more accurate vs Cambridge. He has Sustainable energy source > 53% and⬆️ Image
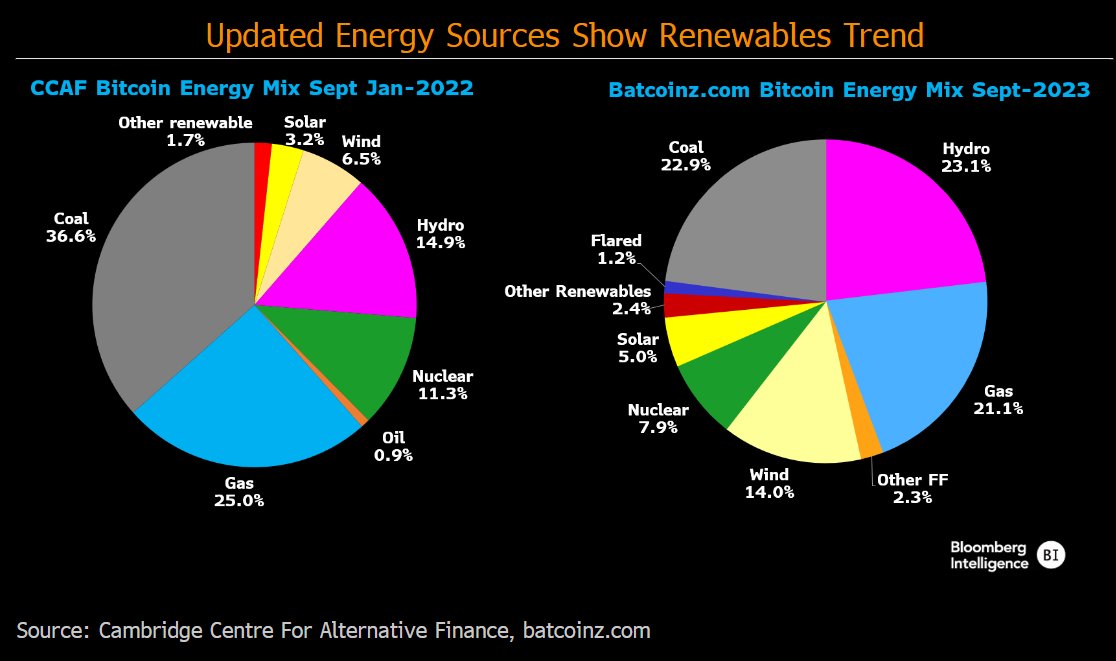
The chart shows how geographical dispersion caused by China's mining ban catalyzed a push toward renewables. Since mid-2021, renewable-energy use (gray) has trended higher as total emissions (blue) have trended lower or moved sideways. Image
With energy accounting for about 50% of miners' costs, the industry's shift to sustainables could impact global energy dynamics.
As we noted previously, growing interest in Bitcoin mining by nation states reflects miners' ability to monetize stranded and excess energy (mainly from renewable and nuclear sources), while helping to balance and modernize power grids. Image
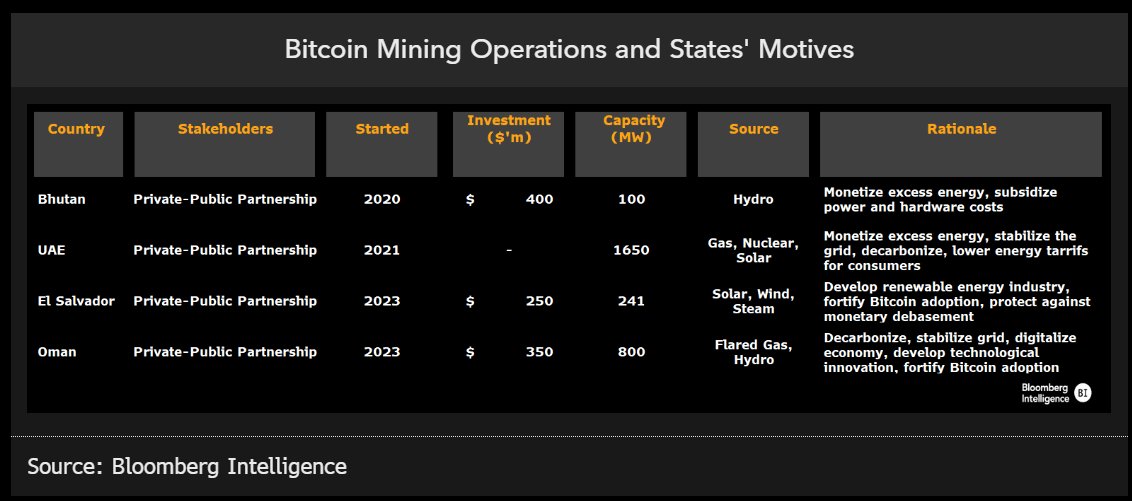
What's becoming even more apparent is that the phasing out coal for wind and solar usually requires subsidies and involves suboptimal payoffs early in the life cycles of power plants. As a source of income based on excess power, Bitcoin mining can support this transition.
All of this paints a very different picture to what we typically hear from international organizations such as the WEF, UN, BIS and the EU. Image
additional thanks to @woonomic for providing access to the carbon data

• • •

Missing some Tweet in this thread? You can try to force a refresh
 

Keep Current with Jamie Coutts CMT

Jamie Coutts CMT Profile picture

Stay in touch and get notified when new unrolls are available from this author!

Read all threads

This Thread may be Removed Anytime!

PDF

Twitter may remove this content at anytime! Save it as PDF for later use!

Try unrolling a thread yourself!

how to unroll video
  1. Follow @ThreadReaderApp to mention us!

  2. From a Twitter thread mention us with a keyword "unroll"
@threadreaderapp unroll

Practice here first or read more on our help page!

More from @Jamie1Coutts

Aug 31
Liquidity & #Bitcoin are inexorably linked. For in-depth analysis on this topic you cant go past @42MacroWeather @RaoulGMI @crossbordercap @MacroAlf

This 🧵 explores one specific liquidity measure in order to understand whether it it has "signal value" for $BTC Image
@42MacroWeather @RaoulGMI @crossbordercap @MacroAlf Firstly, there is no settled definition of liquidity and opinions on the topic vary wildly. The US Financial Liquidity Index is the most widely vaunted on Twitter, so I have chosen this as the focus. You can find it on the @TheTerminal by running the ticker {.US_LIQI G Index} Image
@42MacroWeather @RaoulGMI @crossbordercap @MacroAlf @TheTerminal Currently aggregate US Financial Liquidity is $6.02T. How is it constructed?
Fed Balance Sheet ($8.13T) -- ⬆️ adds liquidity
(RRP) Reverse Repo Facility at the Fed ($1.69T) -- ⬆️ reduces liquidity
(TGA) Treasury Account at the Fed ($0.41T) -- ⬆️ reduces liquidity Image
Read 17 tweets
Aug 1
1/4
Just when the #DeFi was potentially forming a bottom, the $CRV exploit exposes chronic flaws with the system. Ultimately, its 100% human error - the code itself & the founder's greed. This could impact valns as DeFi generates substantial fees (rev's) for L1s Image
2/4
DeFi % of Fees has increased from 30 to 50% this yr. Whilst everyone is chasing stops to force liquidate boosting DeFi activity (revenue), the fiasco is causing contagion, undermining confidence in one of PoS blockchain's major primitives
@Artemis__xyz Image
3/4
Ultimately, major price bottoms are only known after the fact. The trend is still down on an absolute and relative basis (vs. $ETH), which warrants extreme caution. Image
Read 4 tweets
Jul 14
Introducing Bloomberg Intelligence's new Crypto Ecosystem (PoS Assets) Fundamentals Dashboard. We're expanding coverage beyond the two assets that we considered to be institutional-grade quality (BTC, ETH) to the wider proof-of-stake (PoS) ecosystem. A 🧵 on why Image
2/8 Blockchain S-curve Still in Infancy:
Beyond speculation, only a fraction of the 200-300m estimated users are using it for other use cases. This is about to change! Zkproofs for privacy, ETH Layer-2s for scaling... Image
..mainstream integration accelerating as corps lean into NFTs, payment firms are adopting crypto rails for settlement as well as issuance, and some central banks' digital-currency projects are leveraging public chains (although def not our preferred use case 🗽 🚫 )
Read 13 tweets
Jan 19
Is Ethereum's cycle low in the rearview mirror ?

For a couple of reasons YTD positive price momentum indicates that the capitulation low last June was likely the cycle trough for the asset

🧵 Image
In the last cycle, ETH hit its cycle low 11mths after peak(-90%). It took 18mths of volatile sideways price action before it broke out following Bitcoin's halving in 2020. Our chameleon momentum indicator on the daily timeframe has turned positive (green) Image
Our trend model triggered as well. However, there can be several false signals before a solid cycle low actually forms (in 2019 there were several losing signals). But cycle troughs in crypto are a process.. Image
Read 20 tweets
Oct 25, 2022
Ethereum's Layer-2 Bull Cycle has begun. And with the supply side boost from the Merge in the rearview, the market should hone in on the demand dynamics, which are beginning to drive significant network effects. Ethereum on-chain fundamentals update 🧵
Given the severity of the global monetary tightening, Ethereum, over the last 12-months, has performed commendably across some of the network adoption metrics we analyze in our fundamentals dashboard.
Remember, these core fundamental metrics; active addresses, transactions, transferred values and non-zero balance addresses, are tracked because of their strong correlation with the price since inception.
Read 16 tweets
Oct 13, 2022
The Bitcoin monetary network, ambivalent to the machinations of central bank policy, continues to grow stronger by the day. But with macro driving the marginal buyer of all risk assets lets explore the subtle global liquidity cues which will could forewarn of a cycle low 🧵
Despite the worst macro environment in decades, #BTCs hash-rate has hit a new all-time high, demonstrating a resilience that the fiat system has been short in throughout 2022. Image
Institutions have effectively withdrawn $700b + from the financial system, preferring to park it with the Fed than risk it in the short term lending markets. This is 3x the liquidity withdrawal from the Fed via quantitative tightening. 
hat tip @CryptoHayes for this framework Image
Read 14 tweets

Did Thread Reader help you today?

Support us! We are indie developers!


This site is made by just two indie developers on a laptop doing marketing, support and development! Read more about the story.

Become a Premium Member ($3/month or $30/year) and get exclusive features!

Become Premium

Don't want to be a Premium member but still want to support us?

Make a small donation by buying us coffee ($5) or help with server cost ($10)

Donate via Paypal

Or Donate anonymously using crypto!

Ethereum

0xfe58350B80634f60Fa6Dc149a72b4DFbc17D341E copy

Bitcoin

3ATGMxNzCUFzxpMCHL5sWSt4DVtS8UqXpi copy

Thank you for your support!

Follow Us on Twitter!

:(