Alex Profile picture
Sep 16, 2023 9 tweets 3 min read Read on X
💡New Traders Struggle with THREE things. And I'm here to give you a simple solution to #3.

1) Not understanding who is in control of price.

When trading, it is super important to know the larger 'trend' or direction of the market. Even if you're trading a 5 minute chart. Image
2) Most people do not have a solid strategy of identifying WHERE price is headed.

Without knowing where the move may likely end you will have no idea when you should be taking profits or be trading in the COMPLETE wrong direction.

Ever had this happen? Image
3) Trading things they should NOT be trading. Also known as trading 'chop'.

This is the SIMPLEST one to fix and I have the solution for you on the next tweet.
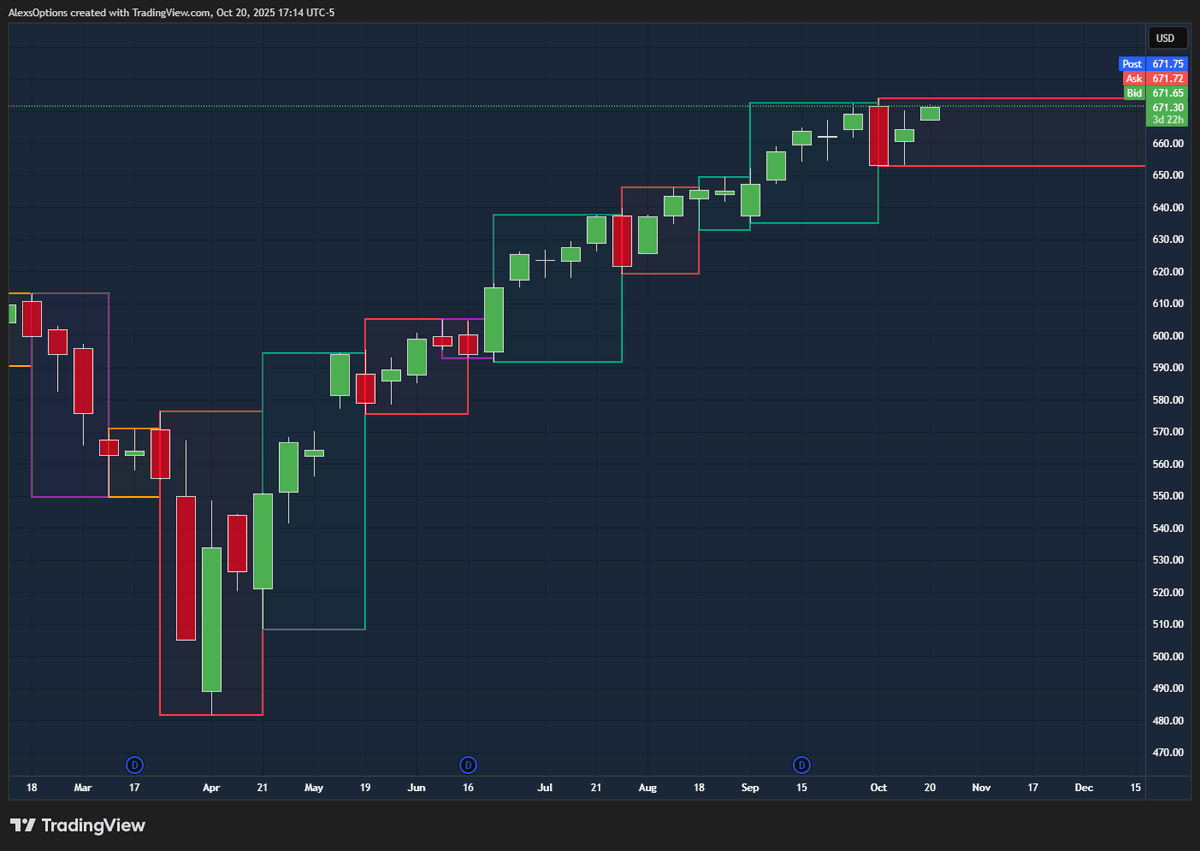
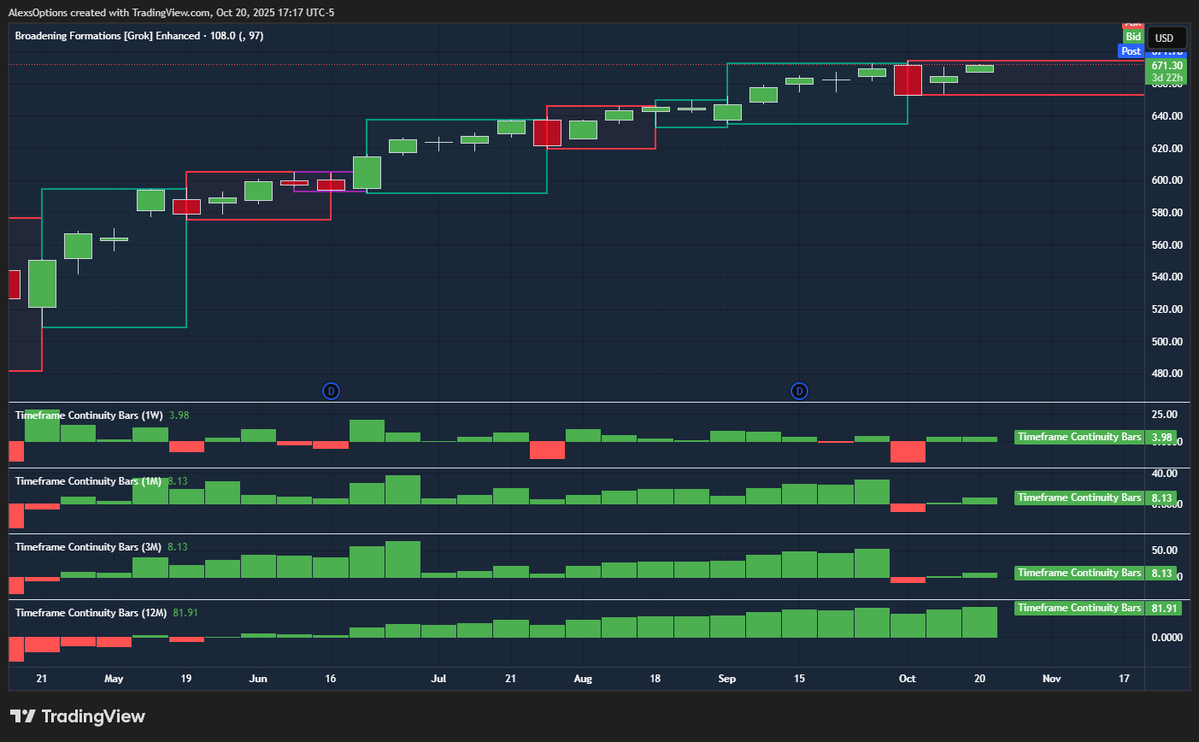
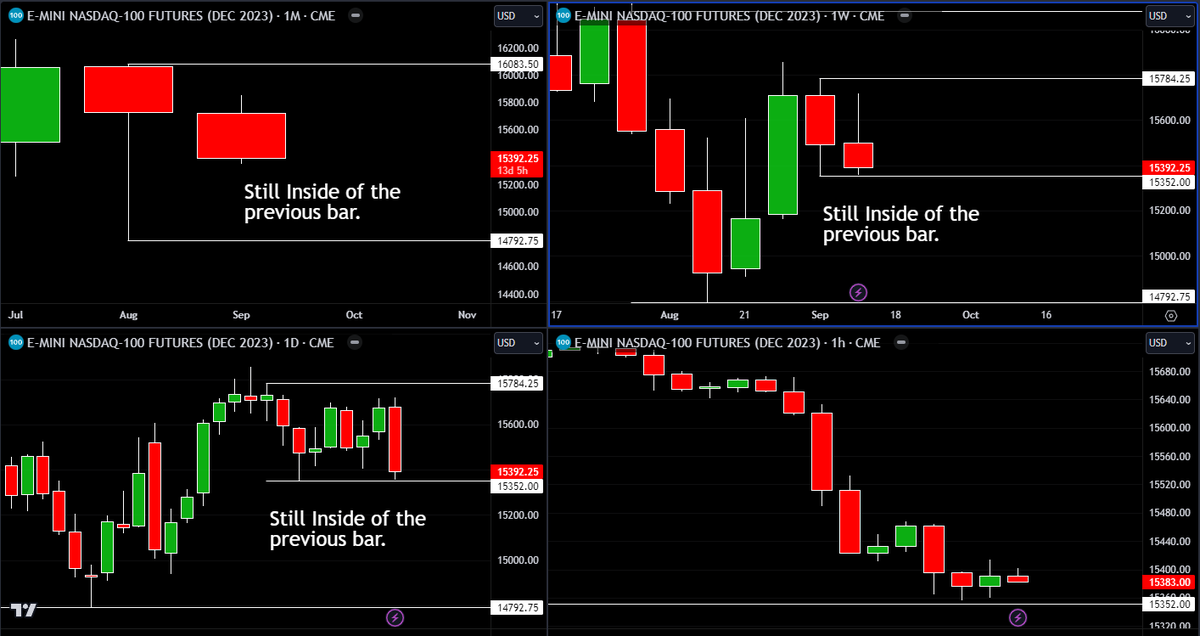
Stop trading things that are STILL INSIDE of the previous bar.

If you are a day trader and the week / day is STILL inside [lower high and higher low]

That is BY DEFINITION. Going sideways.

Swing traders, look to the week & month.

AND.. If you're still itching to trade. Image
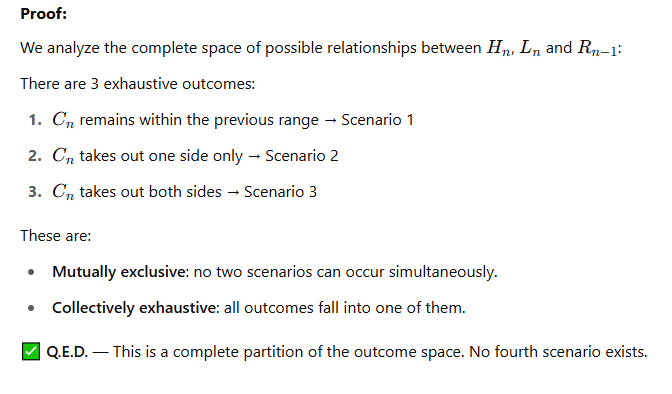
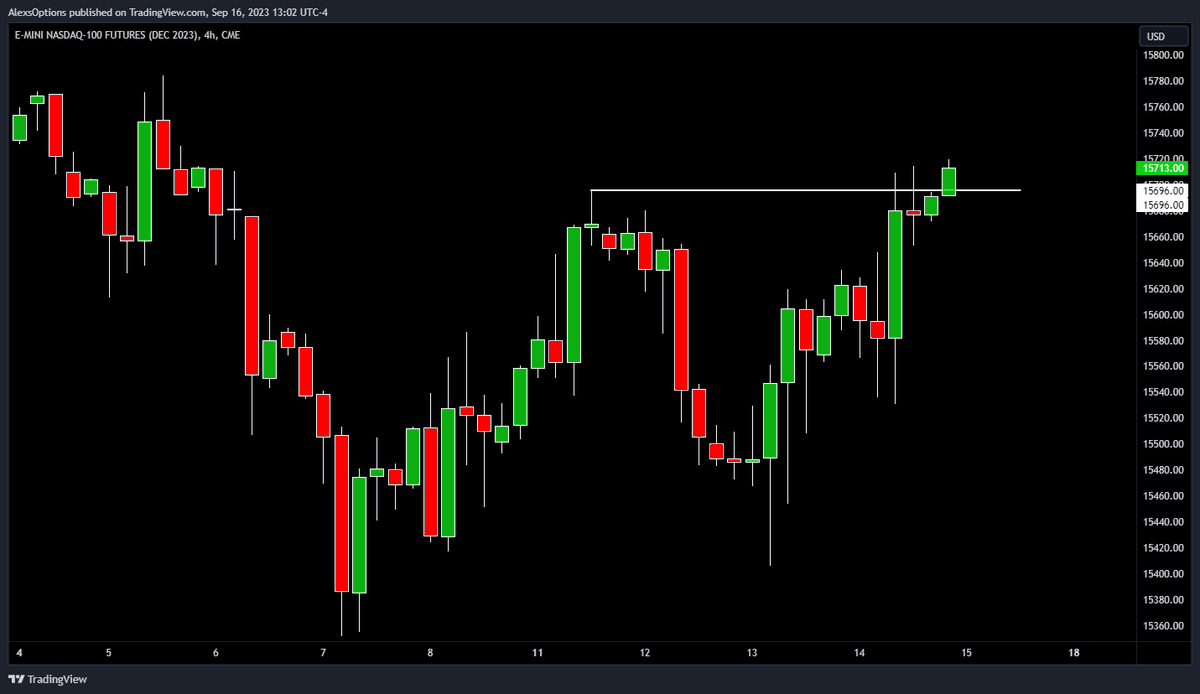
We know exactly how to trade this SPECIFIC market condition.

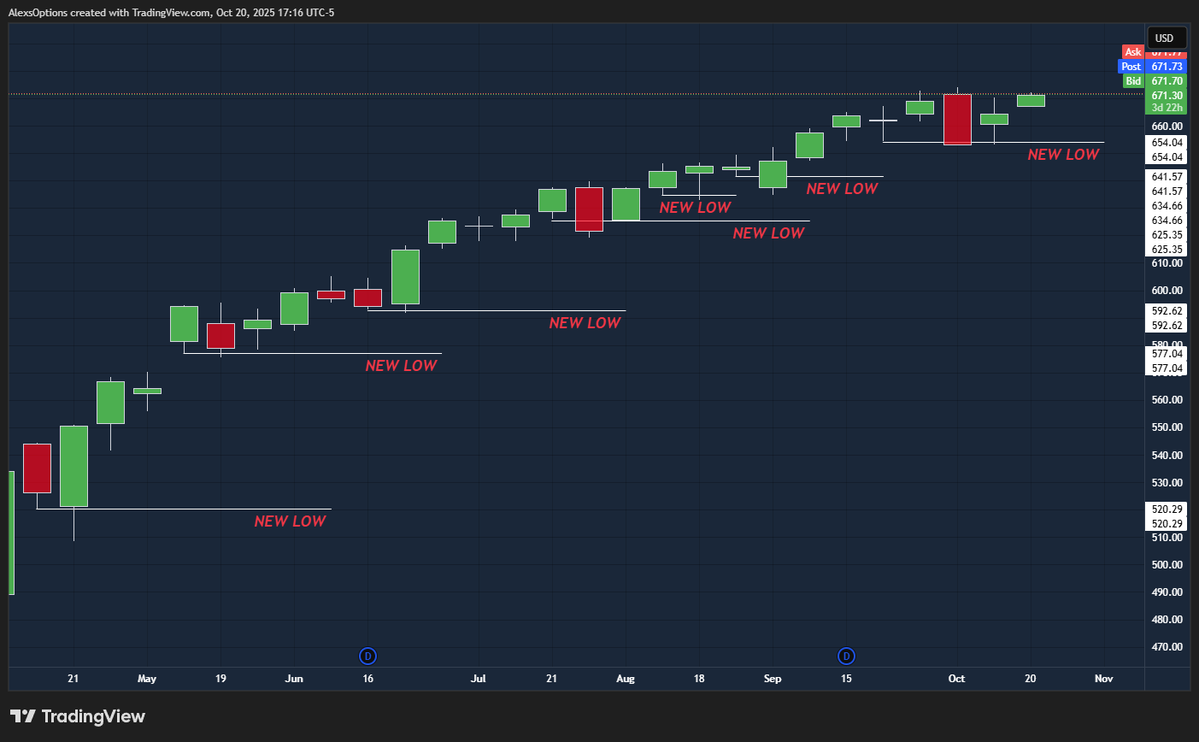
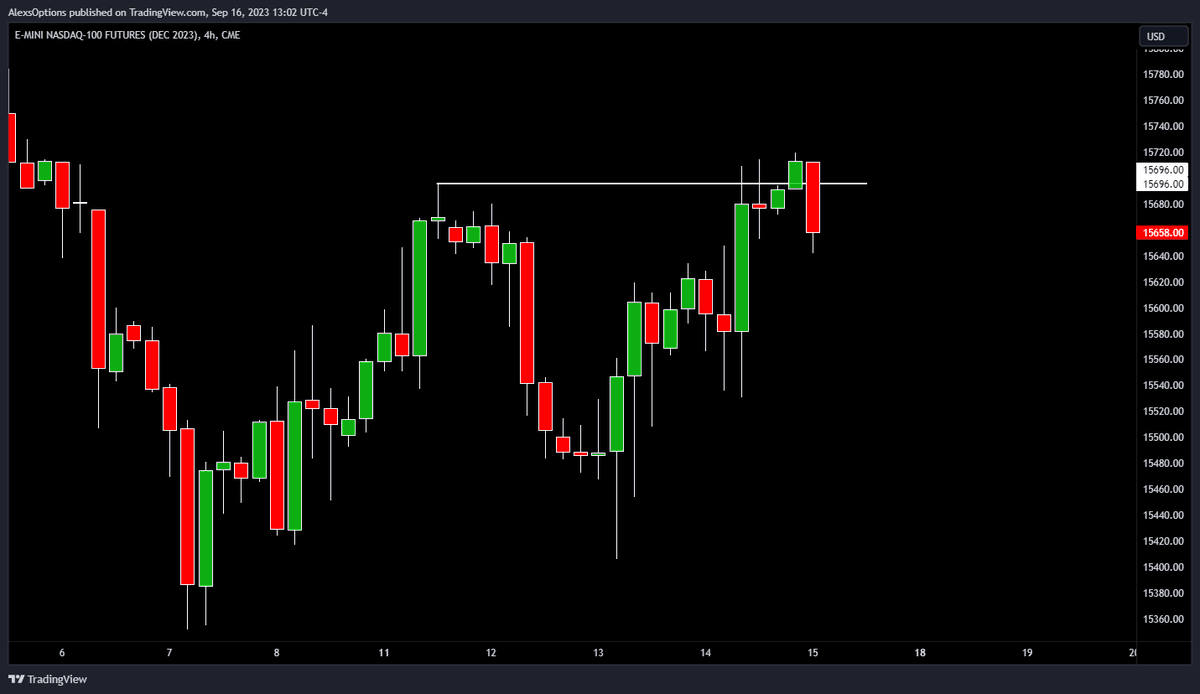
We want to see closes ABOVE old highs or BELOW old lows.

This is because, no one in their right mind looks at this chart & say's it looks bad.

Most new traders would say that's a successful breakout. Image
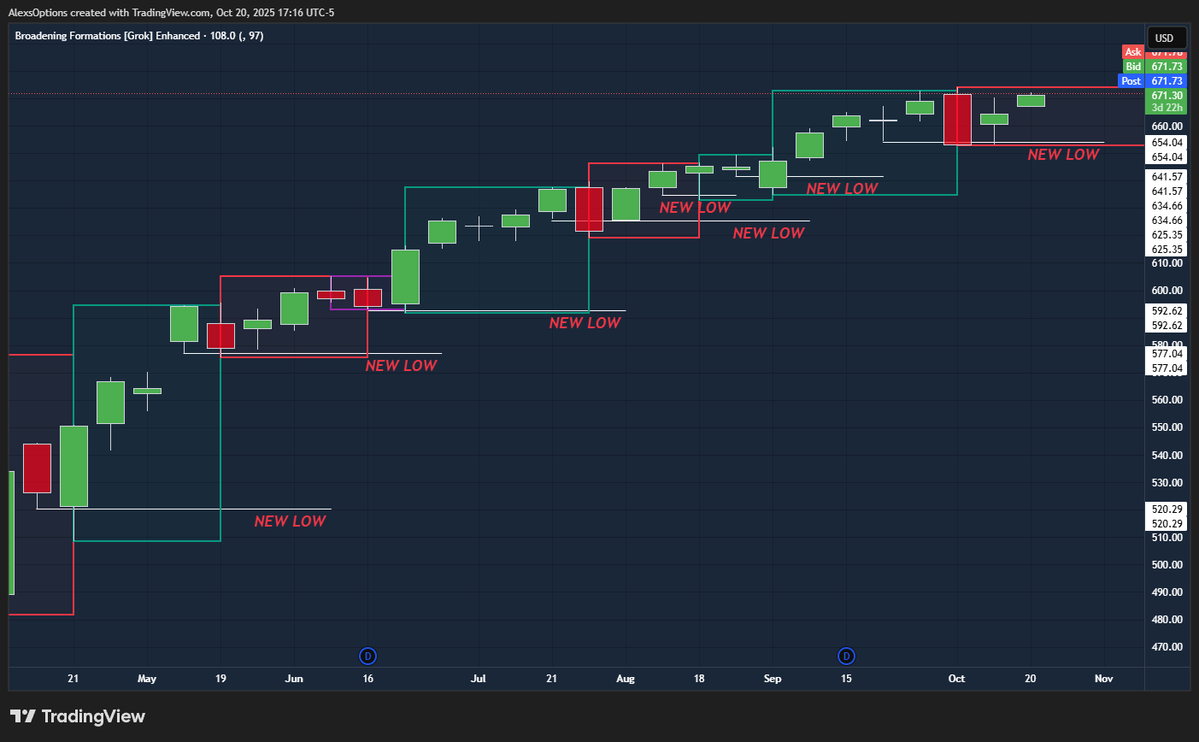
But since we know the secret of the higher timeframe. We know that the BEST looking chart can turn into the WORST looking chart in a single candle. Image
And since we KNOW it is a consolidation. We KNOW that the other side of the range has a HIGH likelihood of being tested Image
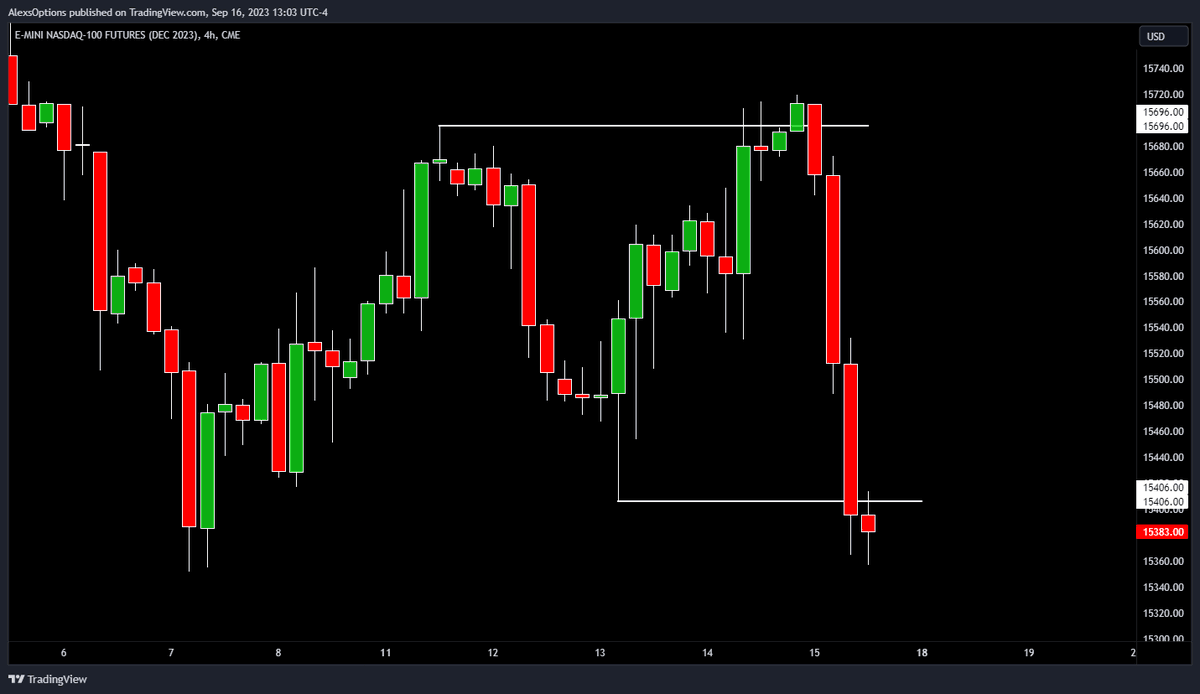
This specific example is what we talked about Thursday afternoon and Friday morning on my twitter.

You can see that here where we go more in depth.

x.com/AlexsOptions/s…
I want to help losing traders make smarter decisions, if you feel this has helped you. Please RETWEET the original tweet. Help out another trader. Until the next one, stay safe & don't hold losers.

• • •

Missing some Tweet in this thread? You can try to force a refresh
 

Keep Current with Alex

Alex Profile picture

Stay in touch and get notified when new unrolls are available from this author!

Read all threads

This Thread may be Removed Anytime!

PDF

Twitter may remove this content at anytime! Save it as PDF for later use!

Try unrolling a thread yourself!

how to unroll video
  1. Follow @ThreadReaderApp to mention us!

  2. From a Twitter thread mention us with a keyword "unroll"
@threadreaderapp unroll

Practice here first or read more on our help page!

More from @AlexsOptions

May 13
A PNL doesn't matter for #TheStrat...

PNL reflects a person(s) ability to be profitable, but it has nothing to do with TheStrat being right or wrong.

#TheStrat is one of the few systems of technical analysis that is proven via 3 universal truths. These truths are indisputable [they're the truth!]

Lets dive in & show you why #TheStrat can't be disproven.

📚 THREADImage
Universal Truth #1

There's only 3 scenarios that can occur ever on any chart any market.

The definitions are laid out as followsImage
There is no scenario 4 so we know that we have successfully defined every move that can happen in any market. Image
Read 13 tweets
Apr 17
Most people have no idea why Christians are so head over heels for Jesus and think it's foolish.

In light of Easter this weekend lets break it down in a way that's easy to comprehend. Regardless of your belief or faith.
First, what is this "Good Friday?"

It is the day that Jesus died on the cross.

This is a historical fact & even most athiest scholars attest that this was a real historical event.

In Christianity this is believed as God showing up as a man--like a hand fills a glove, living a perfect life & accepting the suffering on the cross to show his love to the world and to offer forgiveness to every single person.

Including yourself.

We'll get to why God would even decide to do that in a second..
Now, why would God go through so much pain? Well the problem comes from the beginning of humanity.

Adam & Eve were tempted in the garden to eat from the tree of the knowledge of Good & Evil. They fell to this temptation & they ate from the tree.

The second they did this, they suddenly understood concepts like right and wrong, shame, and vulnerability.

They realized they were naked & hid themselves from God.Image
Read 16 tweets
Oct 5, 2024
If you don’t understand reclaim, you won’t be able to make winning positions.

Let’s fix that. 📚

1/6 The Winning ‘Pattern’ Image
The broadening formation tells us if price fails one side of a range it is attempting to take the other.

This is the winning pattern because it allows you to gauge magnitude, or where price is going.

Thus all trades are framed via this universal truth of price. Image
2/6 Predicting moves via levels of reclaim.

Ranges = Consolidations

These function as levels of reclaim, allowing us to gauge magnitude when a reclaim occurs. Image
Read 8 tweets
Sep 20, 2024
📚 How to create winning positions

Winning positions look like a reversal after price has made a new low or new high.

This is because when you make new highs it tells you of a buyer that took the offer and was willing to pay up!

If you make new lows it tells you of a seller that hit the bid and was willing to sell down!

Therefore when you reverse back through that range that aggressive buyer/seller is forced to do something! Either exit their position or attempt to defend their position.Image
2) What does a reversal look like?

A reversal looks like any of these patterns here. Given there is only 3 scenarios there is only so many ways price can reverse.

We never have to guess if price is reversing once we understand this. Image
3) What does a winning long position look like?

In this example you will see price made new lows, then it reversed back through the previous range & caused sellers to take a loss.

Thus we made new highs & stopped all the 'tight stop guys' who have placed their stops where they got in or against obvious pivots

This is called a 2d-2u reversal paired with the actionable signal of the hammer.

The scenario 2 down that is closer to breaking 2u on the next candle is a signal [with the hammer] because we can anticipate price will reverse. Because one of the most common reversals is the 2d-2u reversal!Image
Read 6 tweets
Jul 18, 2024
The importance of time in the trading of a full time stock trader.

Understanding #TheStrat’s universal truth of the decoupling sequence.

THREAD 📚 (2/3)
Image
The decoupling is a phenomenon that occurs with the opening prices of the aggregation series (candles).

The universal truth of the opening price is simple.

Price trades higher or lower. It does this because of aggressive buying (taking the offer) or aggressive selling (hitting the bid)

This must be the case as a buyer with 100,000,000 shares on the bid would NOT move the market. They have to be willing to step up and cross the spread.

Vice versa for the sellers.Image
Therefore we will either be green or red during any candle.

The greener the candle the more evidence of aggressive buying you have.

Long green bars tend to get greener.
Long red bars tend to get redder.

If a candle is going up +20% it will go +5% first.

This is the universal truth of continuity. Not only red/green, but HOW red or green?Image
Read 13 tweets
Jun 20, 2024
Highs and lows trade in a series of new highs and new lows. (Broadening formations)

Thus, price trades in a series of broadening formations.

Series: A set of quantities constituting a progression or having the several values determined by a common relation.

This is a true statement that then can produce true levels of support / resistance.Image
Example: NVDA

This is what we say when we want to go back through previous range. As each tri is reclaimed it’s more likely to continue.

We can then build upon the tri universal truth. Image
If the tri is true we can also say we’re identifying new participation groups. The tri’s are depiction of groups of trades taken.

As one group steps up and takes the offer or slams the bid the range increases in size.

So we use open levels to gauge how strong or weak the buyers and sellers are at any time.

When a measurable shift in continuity occurs where more timeframes are green or red we then can expect to go back through the previous ranges.

If it starts to go it’s likely to go further as it is reclaiming more levels and causing more losses to occur.Image
Read 5 tweets

Did Thread Reader help you today?

Support us! We are indie developers!


This site is made by just two indie developers on a laptop doing marketing, support and development! Read more about the story.

Become a Premium Member ($3/month or $30/year) and get exclusive features!

Become Premium

Don't want to be a Premium member but still want to support us?

Make a small donation by buying us coffee ($5) or help with server cost ($10)

Donate via Paypal

Or Donate anonymously using crypto!

Ethereum

0xfe58350B80634f60Fa6Dc149a72b4DFbc17D341E copy

Bitcoin

3ATGMxNzCUFzxpMCHL5sWSt4DVtS8UqXpi copy

Thank you for your support!

Follow Us!

:(