𝗨𝗻𝗱𝗲𝗿𝘀𝘁𝗮𝗻𝗱𝗶𝗻𝗴 𝘁𝗵𝗲 𝗜𝗺𝗽𝗼𝗿𝘁𝗮𝗻𝗰𝗲 𝗼𝗳 𝗟𝗼𝗴 𝗥𝗲𝘁𝘂𝗿𝗻𝘀 𝗶𝗻 𝗙𝗶𝗻𝗮𝗻𝗰𝗲 💰
Why Log Returns and not a simple price difference?
Let's develop this a bit more.
🧵 👇
Why Log Returns and not a simple price difference?
Let's develop this a bit more.
🧵 👇
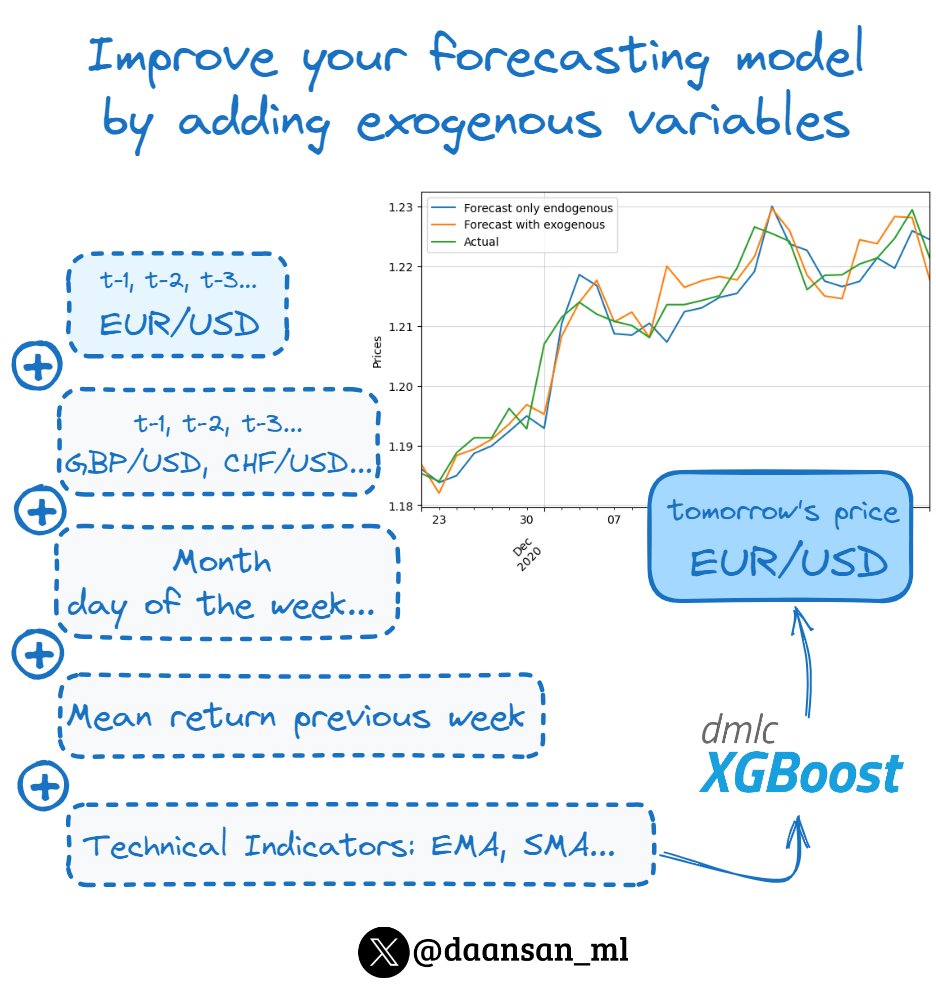
In finance, one of the most crucial types of data is price information.
However, when it comes to Time Series analysis, using raw prices can be problematic.
Let's see why log returns are preferred over simple price differences and their significance in financial modeling.
However, when it comes to Time Series analysis, using raw prices can be problematic.
Let's see why log returns are preferred over simple price differences and their significance in financial modeling.
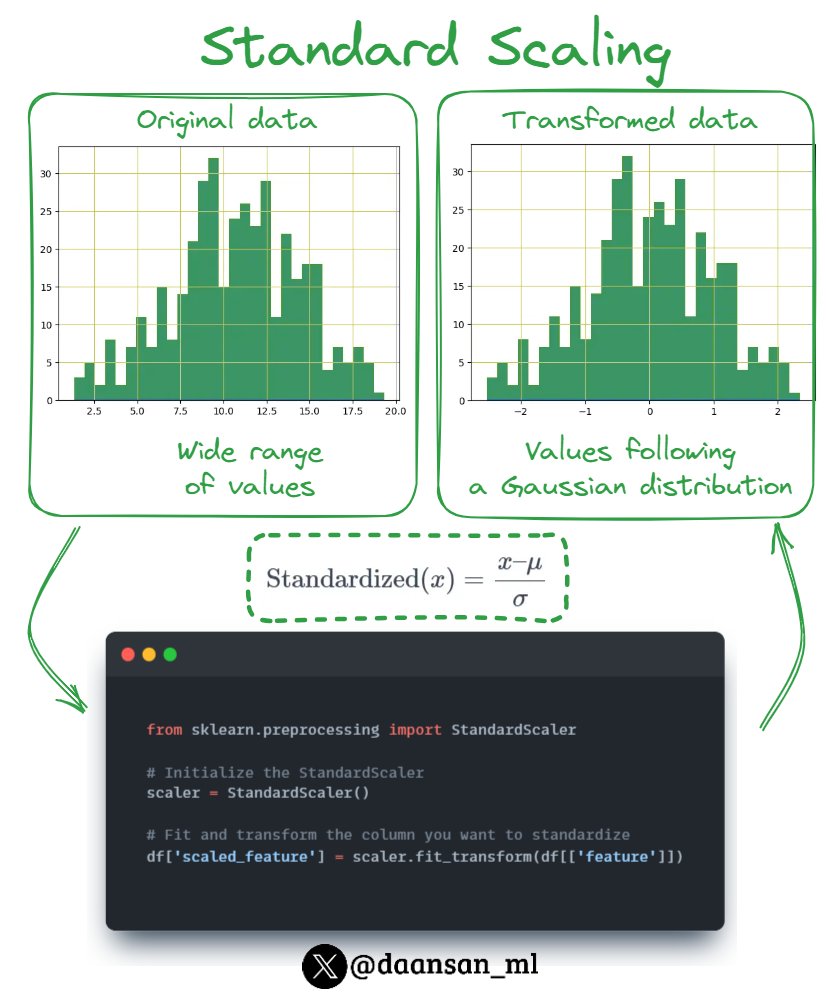
𝗧𝗵𝗲 𝗣𝗿𝗼𝗯𝗹𝗲𝗺 𝘄𝗶𝘁𝗵 𝗡𝗼𝗻-𝗦𝘁𝗮𝘁𝗶𝗼𝗻𝗮𝗿𝘆 𝗗𝗮𝘁𝗮
In Time Series analysis, non-stationary data can introduce a lot of noise and make it difficult to identify underlying patterns.
👉 This is why raw prices are generally not used in financial analyses.
In Time Series analysis, non-stationary data can introduce a lot of noise and make it difficult to identify underlying patterns.
👉 This is why raw prices are generally not used in financial analyses.
𝗔𝗯𝘀𝗼𝗹𝘂𝘁𝗲 𝘃𝘀. 𝗥𝗲𝗹𝗮𝘁𝗶𝘃𝗲 𝗖𝗵𝗮𝗻𝗴𝗲
You might think that using the difference between prices could solve this issue.
This approach only provides the absolute change and lacks information on the relative or percentage change, which is often more insightful.
You might think that using the difference between prices could solve this issue.
This approach only provides the absolute change and lacks information on the relative or percentage change, which is often more insightful.
𝗟𝗼𝗴 𝗥𝗲𝘁𝘂𝗿𝗻𝘀
This is where log returns come into the picture.
Log returns not only capture the relative change but also offer two additional advantages:
1️⃣ Time Additivity
2️⃣ Statistical Properties
This is where log returns come into the picture.
Log returns not only capture the relative change but also offer two additional advantages:
1️⃣ Time Additivity
2️⃣ Statistical Properties
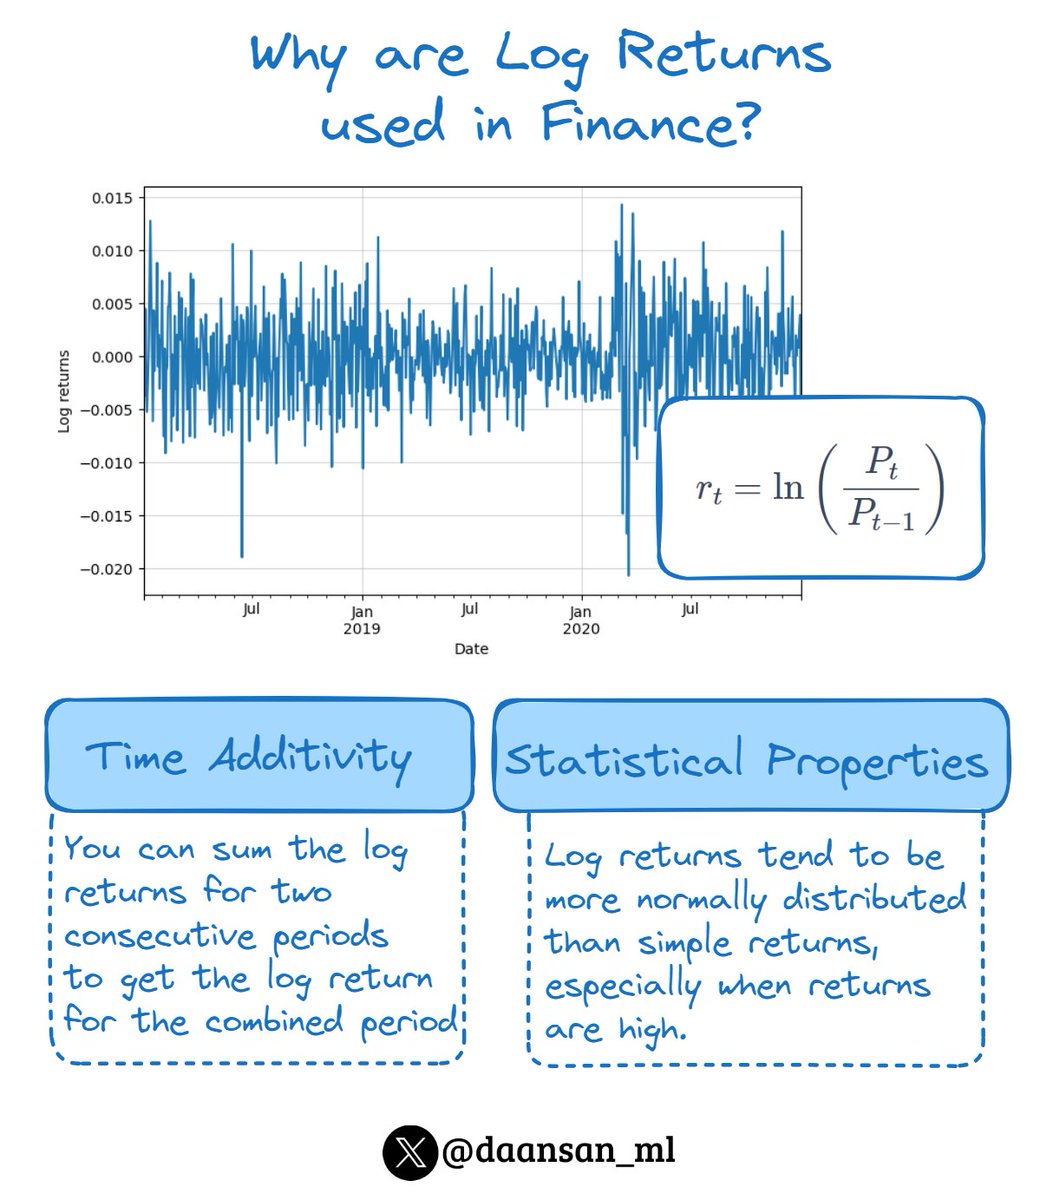
1️⃣ 𝗧𝗶𝗺𝗲 𝗔𝗱𝗱𝗶𝘁𝗶𝘃𝗶𝘁𝘆
Log returns are time-additive. You could simply sum the log returns for two consecutive periods to get the log return for the combined period.
This property is incredibly useful for simplifying analyses and computations in time series modeling.
Log returns are time-additive. You could simply sum the log returns for two consecutive periods to get the log return for the combined period.
This property is incredibly useful for simplifying analyses and computations in time series modeling.
2️⃣ 𝗦𝘁𝗮𝘁𝗶𝘀𝘁𝗶𝗰𝗮𝗹 𝗣𝗿𝗼𝗽𝗲𝗿𝘁𝗶𝗲𝘀
Log returns tend to be more normally distributed than simple returns, especially when returns are high.
The assumption of normality is foundational to many financial theories and models.
Log returns tend to be more normally distributed than simple returns, especially when returns are high.
The assumption of normality is foundational to many financial theories and models.
The formula for calculating log returns, using the natural logarithm ( 𝑙𝑛 ), is:
𝑅ₜ = 𝑙𝑛( 𝑃ₜ / 𝑃ₜ₋₁ )
Where:
- 𝑅ₜ is the log return at time ( 𝑡 )
- 𝑃ₜ is the price at time ( 𝑡 )
- 𝑃ₜ₋₁ is the price at the previous time period
𝑅ₜ = 𝑙𝑛( 𝑃ₜ / 𝑃ₜ₋₁ )
Where:
- 𝑅ₜ is the log return at time ( 𝑡 )
- 𝑃ₜ is the price at time ( 𝑡 )
- 𝑃ₜ₋₁ is the price at the previous time period
✦ The log return is the natural logarithm of the ratio of the price at time ( 𝑡 ) to the price at the previous time period ( 𝑡-1 ).
Using log returns:
• simplifies mathematical modeling
• makes time series analysis more straightforward
• aligns well with the statistical assumptions made in financial theories
• simplifies mathematical modeling
• makes time series analysis more straightforward
• aligns well with the statistical assumptions made in financial theories
You should also join our newsletter, DSBoost🚀
Every week we share:
🔹Interviews
🔹Podcast notes
🔹Learning resources
🔹Interesting collections of content
Subscribe for free👇👇
dsboost.dev
Every week we share:
🔹Interviews
🔹Podcast notes
🔹Learning resources
🔹Interesting collections of content
Subscribe for free👇👇
dsboost.dev
• • •
Missing some Tweet in this thread? You can try to
force a refresh