Sasi πŸ“ŠπŸ“ˆ Profile picture
Sep 19, 2023 β€’ 7 tweets β€’ 3 min read β€’ Read on X
🐼 Complete Pandas Cheatsheet 🐼

πŸ§΅πŸ‘‡
Image
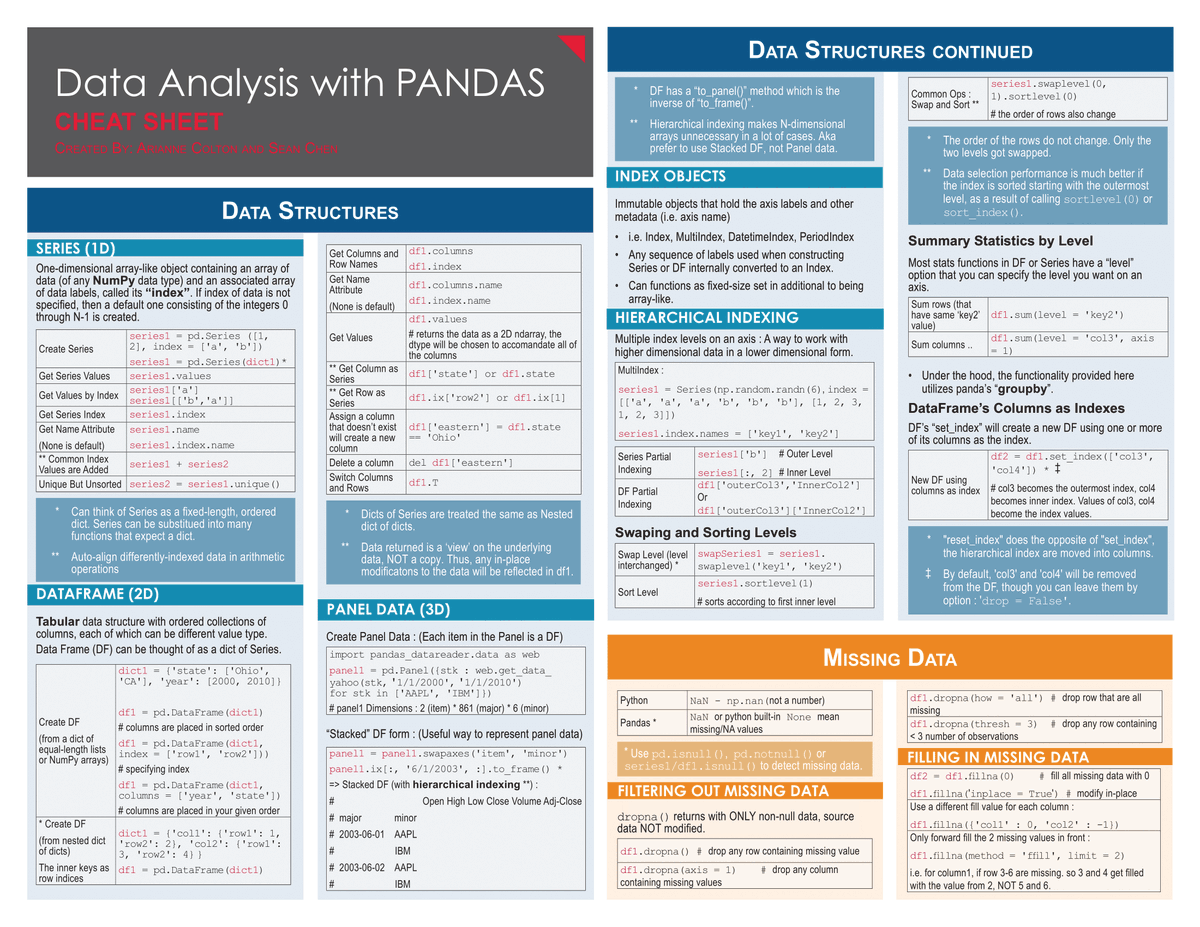
Data Structure and Handling Missing Data Image
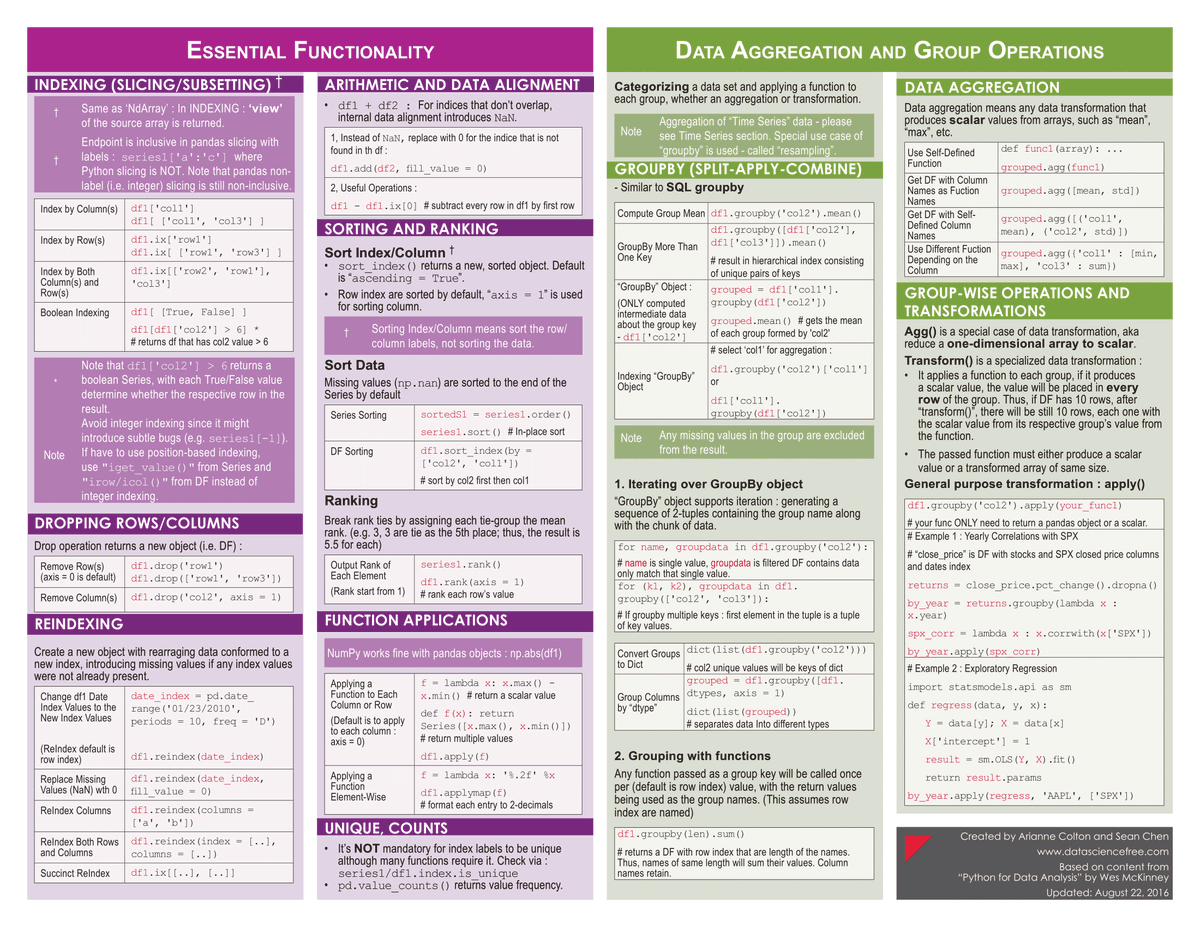
Essential Functionality, Aggregation and Grouping Image
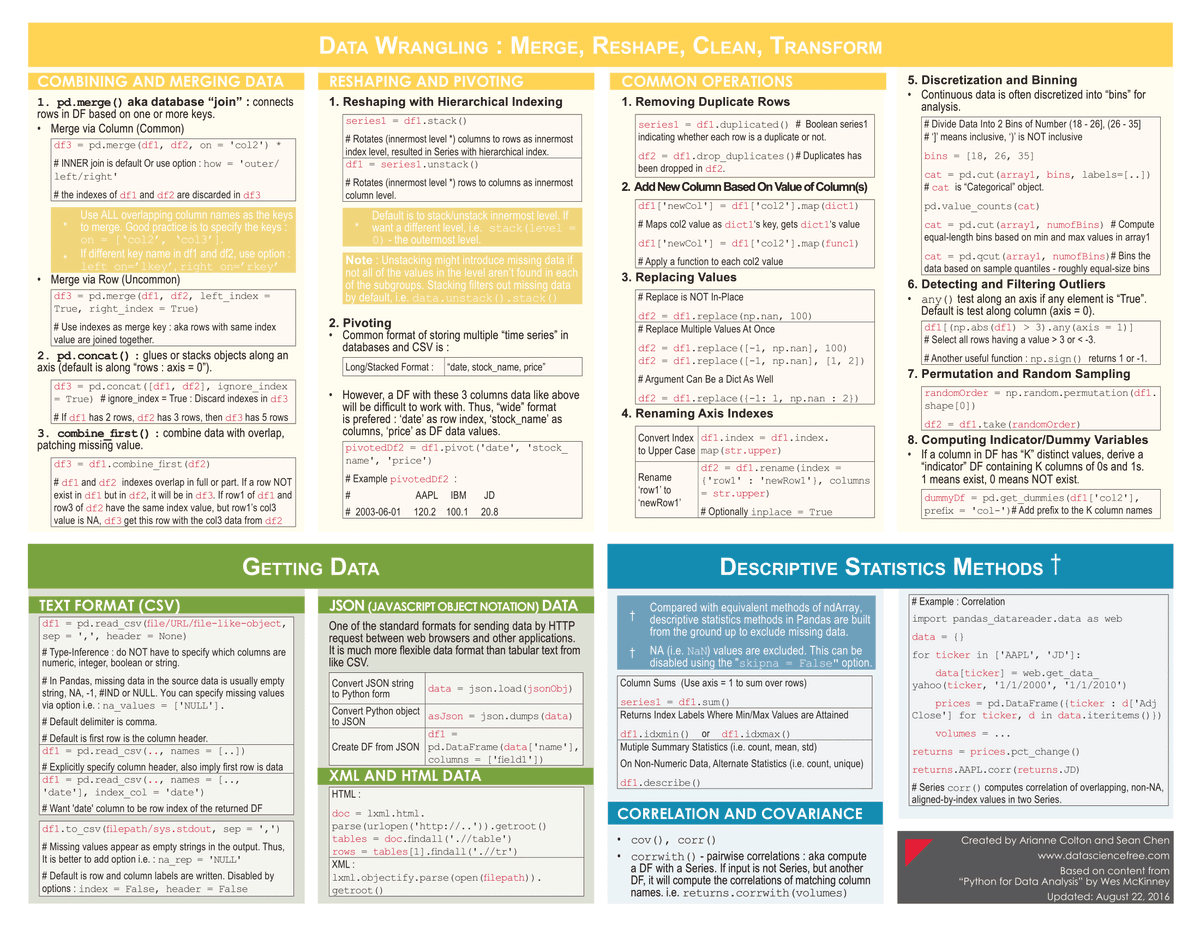
Data Wrangling, Get Data and Descriptive stats
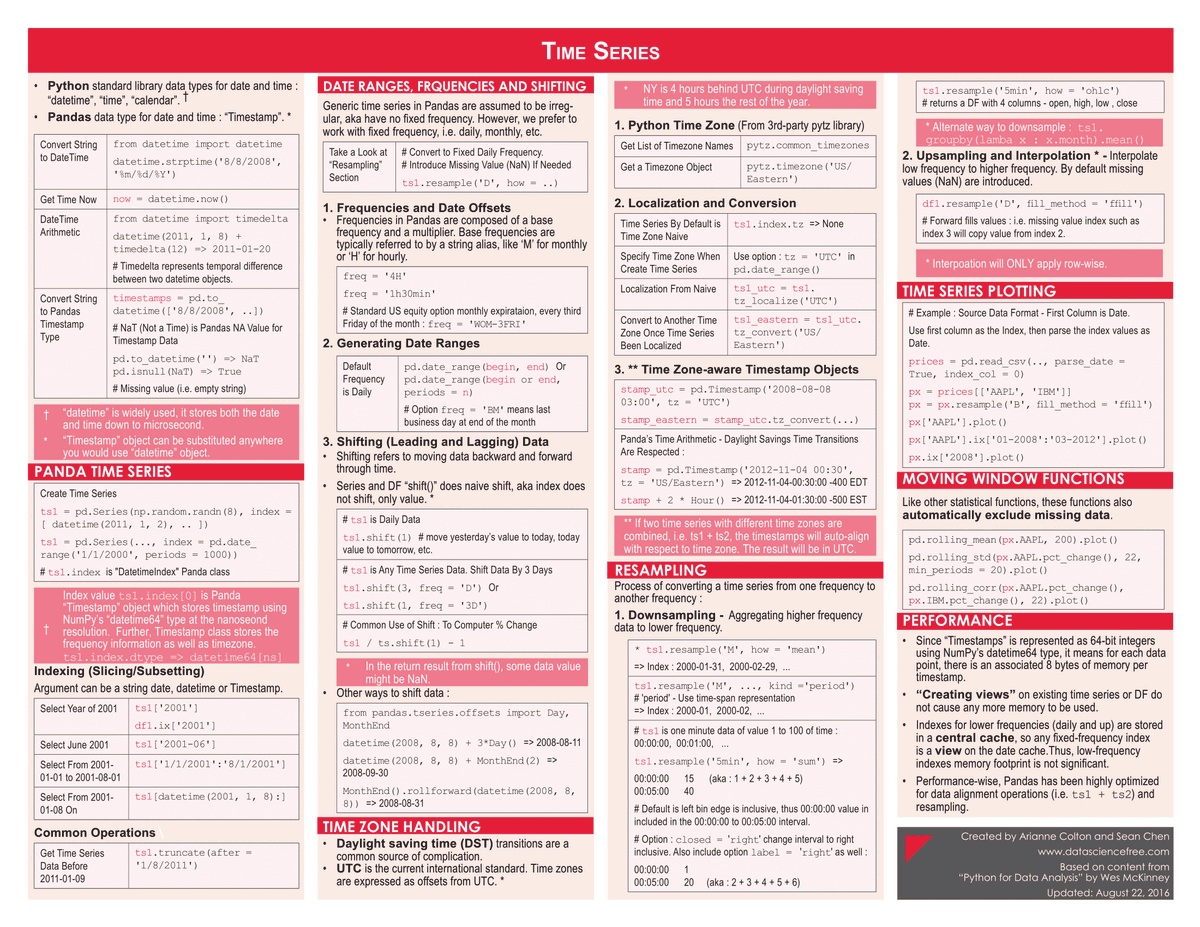
 Image
Time Series Image
My newsletter will:

Guide you as I wished I was guided when starting in data

Share invaluable tips from my experience

Teach the latest on prompt engineering and insights with ChatGPT

πŸ”— Subscribe now and stay ahead: sasi.beehiiv.com


Image
Image
Image
Image

β€’ β€’ β€’

Missing some Tweet in this thread? You can try to force a refresh
γ€€

Keep Current with Sasi πŸ“ŠπŸ“ˆ

Sasi πŸ“ŠπŸ“ˆ Profile picture

Stay in touch and get notified when new unrolls are available from this author!

Read all threads

This Thread may be Removed Anytime!

PDF

Twitter may remove this content at anytime! Save it as PDF for later use!

Try unrolling a thread yourself!

how to unroll video
  1. Follow @ThreadReaderApp to mention us!

  2. From a Twitter thread mention us with a keyword "unroll"
@threadreaderapp unroll

Practice here first or read more on our help page!

More from @freest_man

Oct 1, 2024
Data is only as good as the story it tells.

But last week, I found a ridiculously easy way to pull out data insights

/🧡/Image
Data lives everywhere!

Every day data analysts try their hardest to find a connection across multiple data sources, clicking between different dashboards with different datasets just to thread together a single story.

They haven’t tried @NumbersStnAI.
@NumbersStnAI empowers data analysts to query all their data sources via a conversational chat interfaceβ€”unifying databases, dashboards, schemas, email, etc. to generate your insight.

Their analytics agents can be embedded into your customer-facing platform via API.
Read 8 tweets
Aug 5, 2024
Dashboards need to be tailored for the right Audience.

Managers Vs Executives Vs Analysts

Whats the difference? Image
There are three types of dashboards based on your audience

1. Operational dashboards - Intended for Managers

2. Strategic dashboards - For Executives

3. Analytical Dashboard - For Analysts Image
1/ Operational Dashboard

This kind of dashboard monitors the day-to-day metrics

It answers the question β€œWhat is happening now?”

Managers oversee the operations so can use the data for decision-making

This dashboard oversees the daily transactions of the business Image
Read 7 tweets
Jul 20, 2024
6 reasons why your Power BI Dashboard needs UI & UX enhancement:

1. Improved data interpretation:

A well-designed UI/UX makes it easier for users to understand complex data quickly and accurately.
2. Increased user engagement:

Intuitive and visually appealing dashboards encourage users to interact more with the data, leading to better insights.
Read 8 tweets
Jul 5, 2024
6 Ways To Be More EFFECTIVE Than 99% of Data Analysts:

(Even If You're Not a Math Whiz)

~ Practical Insights Thread ~Image
1. Master the art of asking questions:

Don't just dive into data.

Learn to ask probing, insightful questions about the business problem.

Understanding the 'why' behind the analysis is often more important than technical skills.
2. Practice explaining complex concepts in simple terms:

Hone your ability to explain technical concepts to non-technical stakeholders.

Use analogies and real-world examples to make your insights accessible.
Read 8 tweets
Jul 2, 2024
Stream Processing or Batch Processing?

Which process suits your data?

/🧡/Image
Depending on how data is ingested into your system, you could process each data item as it arrives, or buffer the raw data and process it in groups.

Processing data as it arrives is called streaming.

Buffering and processing the data in groups is called batch processing. Image
InΒ batch processing, newly arriving data elements are collected into a group.

The whole group is then processed at a future time as a batch.

Exactly when each group is processed can be determined in many ways. Image
Read 8 tweets
Jun 25, 2024
Optimizing your SQL queries is essential for efficiency and performance

It can easily save 2-3 times the time and computing powerImage
1/ Indexing

A well-designed index structure can significantly boost query performance.

Identify columns that are frequently used in WHERE clauses and index them appropriately.

They significantly enhance query performance, but their usage requires careful planning to strike the right balance between read and write operations.

Too many indexes or improper use can lead to unintended consequences.

Here's the Syntax:Image
2/ Query Structure

Simplify your SQL queries.

Avoid using SELECT * and fetch only the columns you need.

Minimize the use of subqueries when possible.Image
Read 9 tweets

Did Thread Reader help you today?

Support us! We are indie developers!


This site is made by just two indie developers on a laptop doing marketing, support and development! Read more about the story.

Become a Premium Member ($3/month or $30/year) and get exclusive features!

Become Premium

Don't want to be a Premium member but still want to support us?

Make a small donation by buying us coffee ($5) or help with server cost ($10)

Donate via Paypal

Or Donate anonymously using crypto!

Ethereum

0xfe58350B80634f60Fa6Dc149a72b4DFbc17D341E copy

Bitcoin

3ATGMxNzCUFzxpMCHL5sWSt4DVtS8UqXpi copy

Thank you for your support!

Follow Us!

:(