Sasi šŸ“ŠšŸ“ˆ Profile picture
Data Analytics Consultant šŸ§‘ā€šŸ’» Simplifying Data Science and helping you become a certified Power BI Developer! DM for Enquiries šŸ“Ø
Ella Sanders Profile picture Kolusu_Trinadh Profile picture Learning in Public - Coding - DataSci Profile picture Hakam Profile picture 4 subscribed
Jul 20 ā€¢ 8 tweets ā€¢ 1 min read
6 reasons why your Power BI Dashboard needs UI & UX enhancement:

1. Improved data interpretation: 1. Improved data interpretation:

A well-designed UI/UX makes it easier for users to understand complex data quickly and accurately.
Jul 5 ā€¢ 8 tweets ā€¢ 2 min read
6 Ways To Be More EFFECTIVE Than 99% of Data Analysts:

(Even If You're Not a Math Whiz)

~ Practical Insights Thread ~Image 1. Master the art of asking questions:

Don't just dive into data.

Learn to ask probing, insightful questions about the business problem.

Understanding the 'why' behind the analysis is often more important than technical skills.
Jul 2 ā€¢ 8 tweets ā€¢ 2 min read
Stream Processing or Batch Processing?

Which process suits your data?

/šŸ§µ/Image Depending on how data is ingested into your system, you could process each data item as it arrives, or buffer the raw data and process it in groups.

Processing data as it arrives is called streaming.

Buffering and processing the data in groups is called batch processing. Image
Jun 25 ā€¢ 9 tweets ā€¢ 3 min read
Optimizing your SQL queries is essential for efficiency and performance

It can easily save 2-3 times the time and computing powerImage 1/ Indexing

A well-designed index structure can significantly boost query performance.

Identify columns that are frequently used in WHERE clauses and index them appropriately.

They significantly enhance query performance, but their usage requires careful planning to strike the right balance between read and write operations.

Too many indexes or improper use can lead to unintended consequences.

Here's the Syntax:Image
Jun 24 ā€¢ 8 tweets ā€¢ 3 min read
The "window" in "window function" refers to a set of rows.Image What are Window functions?

Window functions are a powerful tool in SQL that allows you to perform calculations over a set of rows, called a window, that is related to the current row.

In SQL, window functions are used to perform calculations on a set of rows and return multiple rows for each group
Jun 7 ā€¢ 11 tweets ā€¢ 2 min read
Data-driven decisions are based on the Story and not a Number

Here's how you tell a convincing story when presenting your data:

/šŸ§µ/ Image Storytelling with Data can be done in 4 parts

1. Main Idea - Preparation step

2. Beginning - Introduction + Problem Definition

3. Middle - Solve the problem

4. Conclusion - Present the solution

Now let me explain each step
Jun 3 ā€¢ 11 tweets ā€¢ 3 min read
Pandas Basics in 8 Tweets

Pandas is a popular Python library used for data manipulation and analysis.

Follow this thread:Image 1. Data Structures:

DataFrame: This is the primary data structure in pandas.

It represents a two-dimensional, labeled data structure with columns of potentially different types, similar to a spreadsheet or SQL table.

Series: A Series is a one-dimensional labeled array capable of holding any data type. It's like a column in a data frame.
May 26 ā€¢ 4 tweets ā€¢ 2 min read
This is why you need a Study Plan to Learn anything efficiently:Image 1. Stay Organized

Know what to study & when. No more last-minute cramming!

2. Boost Productivity

Focused, scheduled sessions lead to better retention.

3. Track Progress

See your improvements, stay motivated!

4. Balance Life

Manage study time & personal time without stress.

5. Achieve Goals

Clear steps make big goals manageable.

Want to make one for Data Science?

Donā€™t worry I will exactly tell you how to make one.
May 23 ā€¢ 7 tweets ā€¢ 3 min read
Power BI has many functions that help you to conduct statistical analysis.

Data Analysis Expressions (DAX) functions, visuals such as histograms and bell curves, advanced analytics visuals, and statistical programming languages such as Python and R.

Lets see some analyses: Statistical functions

Power BI Desktop has a number of DAX functions that you can use to get quick statistics based on your data.

You can access these quick functions by right-clicking theĀ ValuesĀ field in theĀ VisualizationsĀ pane, as illustrated in the following image.Image
May 20 ā€¢ 9 tweets ā€¢ 4 min read
Selecting the right Visuals in Power BI

The primary goal of data visualization is to communicate information clearly and effectively.

That's why selecting the most effective visual type to meet requirements is critical,

I'm going to help you select an appropriate visual in this Thread:Image Categorical visuals

Often, bar or column charts are good choices when you need to show data across multiple categories.

Selecting which type depends on the number of categories and the kind of information that you want to visualize.Image
May 20 ā€¢ 7 tweets ā€¢ 2 min read
Solving Interview SQL questions

Recently I came across these assessment questions for a Senior Data Analyst role

Can you solve these? There are 2 datasets present in the file.

Data 1 and Data 2

The primary key for both data1 and data2 is the Order Id + Product ID combination duplicates(i.e. the individual datasets do not have any duplicate on this combination) Image
May 9 ā€¢ 11 tweets ā€¢ 8 min read
Transform Data in Power BI in 7 steps (Complete Guide)

Day 3 of #PL300in14Days

Power Query Editor in Power BI Desktop allows you to shape (transform) your imported data.

You can accomplish actions such as renaming columns or tables, changing text to numbers, removing rows, setting the first row as headers, and much more.Image 
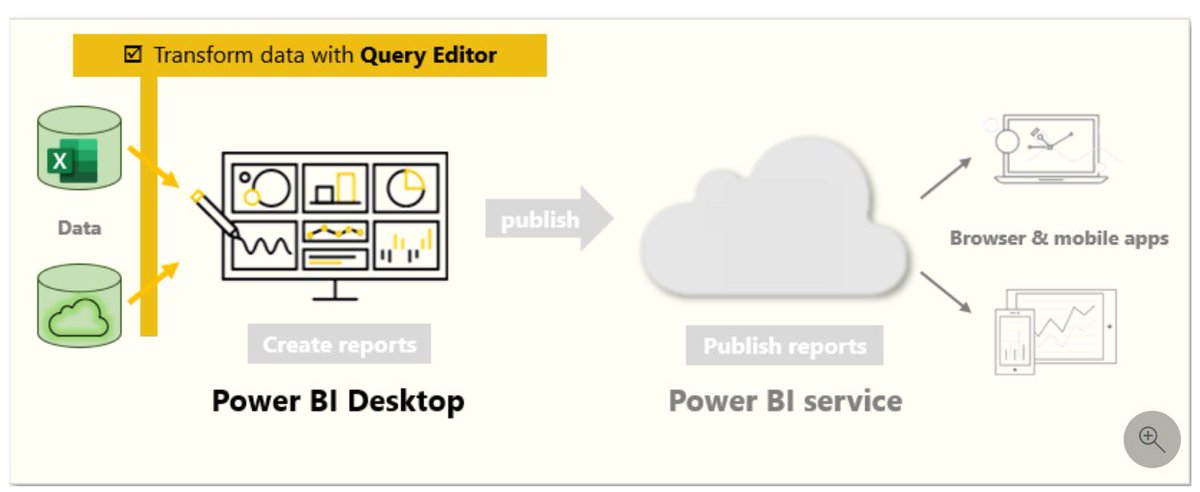
Get started with Power Query Editor

To start shaping your data, open Power Query Editor by selecting theĀ Transform dataĀ option on theĀ HomeĀ tab of Power BI Desktop.

In Power Query Editor, the data in your selected query displays in the middle of the screen and, on the left side, theĀ QueriesĀ pane lists the available queries (tables).

When you work in Power Query Editor, all steps that you take to shape your data are recorded.

You can see a list of your steps on the right side of the screen, in theĀ Query SettingsĀ pane, along with the query's properties.

In Power Query Editor, the right-click context menus andĀ TransformĀ tab in the ribbon provide many of the same options.Image
May 7 ā€¢ 7 tweets ā€¢ 3 min read
Introduction to Power BI Service

Day 2 of #PL300in14days

The Power BI service provides a simple and interactive user experience for Power BI users to take data analytics to the next level.

Let's look at some aspects of Power BI ServiceImage Organize items with workspaces

WorkspacesĀ are the foundation of the Power BI service.

When publishing any report, you must choose a workspace.

By default, every user has access toĀ My Workspace, which is ideal only for testing. When you want to share content with others,Ā alwaysĀ create and use a shared workspace.Image
May 6 ā€¢ 8 tweets ā€¢ 5 min read
Day 1 of #PL300in14days

Getting Data from Relational Database in Power BI

If your organization uses a relational database, you can use Power BI Desktop to connect directly to the database instead of using exported flat files.

Connect to data in a relational database

You can use theĀ Get DataĀ feature in Power BI Desktop and select the applicable option for your relational database.

For this example, you would select theĀ SQL ServerĀ option, as shown in the following screenshot.Image 
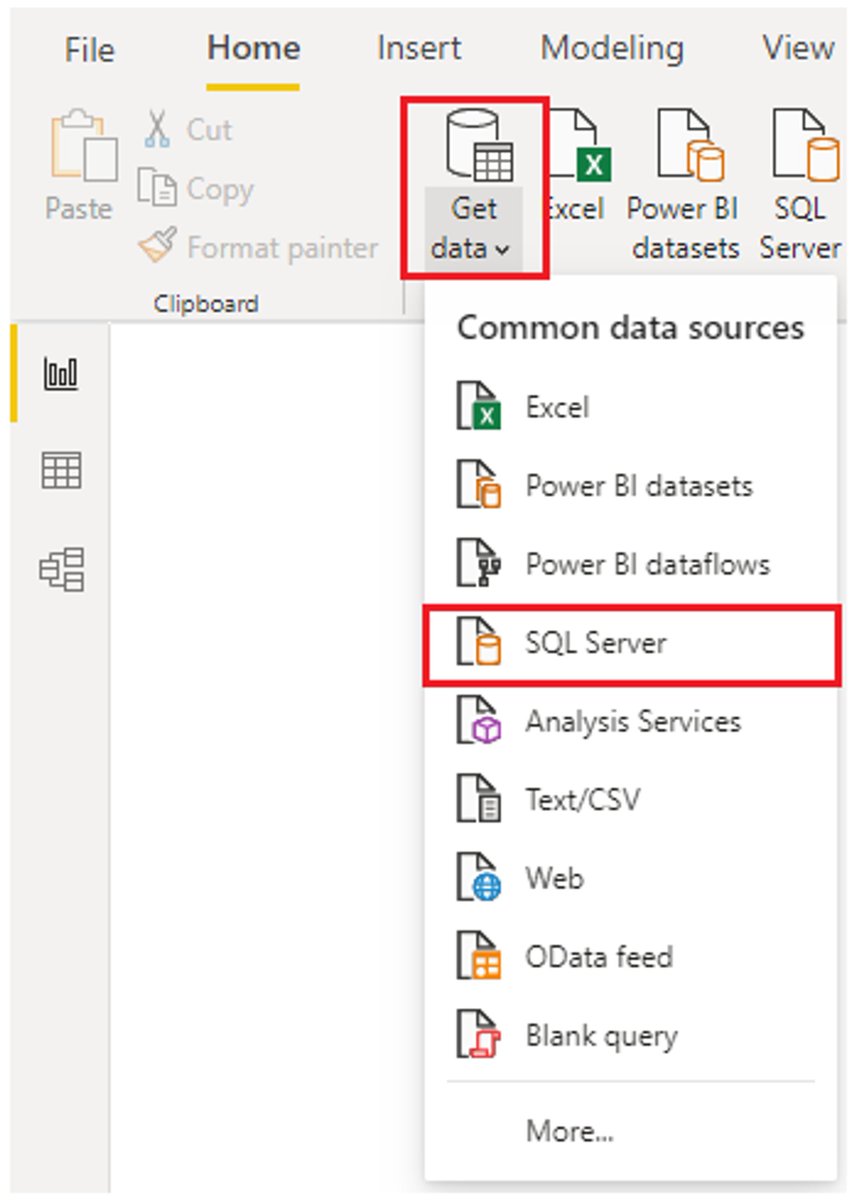
Your next step is to enter your database server name and a database name in theĀ SQL Server databaseĀ window.

The two options in data connectivity mode are:Ā 

ImportĀ (selected by default, recommended) andĀ DirectQuery.Image
Apr 30 ā€¢ 10 tweets ā€¢ 3 min read
A/B testing is used to make Data-Driven Decisions and eliminate guesswork.

/šŸ§µ/ Image A/B testing is a randomized control experiment that compares the performance of two versions.

Aim to find which version of content appeals more to visitors/viewers.
Apr 4 ā€¢ 7 tweets ā€¢ 3 min read
Handling Missing Values in Pandas

Pandas, a popular Python library for data manipulation and analysis, provides several methods for dealing with missing data effectively.

Here's an explanation of how to handle missing values using Pandas:Image 1. Identifying Missing Values:

Before handling missing values, it's essential to identify where they exist in your dataset.

In Pandas, missing values are often represented as NaN (Not a Number) or None.

You can use the isnull() or isna() method to identify missing values in a DataFrame.

These methods return a DataFrame of Boolean values, where True indicates a missing value.Image
Apr 3 ā€¢ 6 tweets ā€¢ 2 min read
Indexing and selection in pandas refer to the process of accessing specific data within a DataFrame or Series object.

Here are the main ways to index and select data in pandas:Image 1. Using Square Brackets []:

You can use square brackets to select columns by their names.

For example, df['column_name'] selects a single column, and df[['col1', 'col2']] selects multiple columns.

You can also use square brackets to filter rows based on conditions, like df[df['column'] > 5], which selects rows where the values in the 'column' are greater than 5.
Apr 2 ā€¢ 10 tweets ā€¢ 2 min read
Pandas is a popular Python library used for data manipulation and analysis.

It provides easy-to-use data structures and functions to work with structured data.

Here are some basics:Image 1. Data Structures:

DataFrame: This is the primary data structure in pandas. It represents a two-dimensional, labeled data structure with columns of potentially different types, similar to a spreadsheet or SQL table.

Series: A Series is a one-dimensional labeled array capable of holding any data type. It's like a column in a data frame.
Mar 15 ā€¢ 8 tweets ā€¢ 3 min read
Optimizing your SQL queries is essential for efficiency and performance

It can easily save 2-3 times the time and computing powerImage 1/ Indexing

A well-designed index structure can significantly boost query performance.

Identify columns that are frequently used in WHERE clauses and index them appropriately.

They significantly enhance query performance, but their usage requires careful planning to strike the right balance between read and write operations.

Too many indexes or improper use can lead to unintended consequences.

Here's the Syntax:Image
Feb 29 ā€¢ 4 tweets ā€¢ 2 min read
Bank Customer Churn Prediction Deployed using @streamlit

Let me explain how it works:Image The Customer Churn Prediction (CCP) Tool is a machine learning application designed to predict the likelihood of a customer churning from the bank.

It utilizes data from the bank's customer database to train models that can accurately predict customer churn.

It's deployed here:

churnpredicting.streamlit.app
Feb 26 ā€¢ 7 tweets ā€¢ 2 min read
Stream Processing VS Batch Processing

in Cloud Ecosystems:Image Before processing let's look how data is ingested

Data ingestionĀ is the obtaining and importing of data from various sources.

Then itā€™s processed for immediate use or storage in an analytical data stored

Data processingĀ is simply converting raw data to meaningful information through a process.Image