Jim Bianco Profile picture
Sep 19 3 tweets 2 min read Twitter logo Read on Twitter
1/3

BIDEN SAYS DEPLETING SPR IS ON TABLE: WSJ

The Strategic Petroleum Reserve (SPR) was created in the 1970s to prevent this from happening again (gas lines that created havoc in the US economy). Image
2/3

But today, the definition national emergency has been expanded to mean Biden's re-election.

So, if necessary, drive the SPR to zero.

If this means a total economic crisis between 2025 to 2028, there is no problem as long as Biden wins in 2024. Image
3/3

Should the SPR go to zero, the engineering says refilling is prohibitively expensive.

But a cheap solution is to designate drilling in the Alaskan National Wildlife Reserve (ANWR) as the new SPR.

But 2 weeks ago:

eenews.net/articles/biden…

• • •

Missing some Tweet in this thread? You can try to force a refresh
 

Keep Current with Jim Bianco

Jim Bianco Profile picture

Stay in touch and get notified when new unrolls are available from this author!

Read all threads

This Thread may be Removed Anytime!

PDF

Twitter may remove this content at anytime! Save it as PDF for later use!

Try unrolling a thread yourself!

how to unroll video
  1. Follow @ThreadReaderApp to mention us!

  2. From a Twitter thread mention us with a keyword "unroll"
@threadreaderapp unroll

Practice here first or read more on our help page!

More from @biancoresearch

Sep 19
1/2

*TREASURY 10-YEAR YIELD RISES TO 4.365%, HIGHEST SINCE 2007

80% of Wall Street thinks yields have peaked.

They have not.
@dailydirtnap @allstarcharts @donnelly_brent @JeremyDSchwartz Image
2/2

The 2-year yield is also at a new 17-year high. Image
added 1/4

The overwhelming opinion among bond strategists is the curve will steepen (or get less inverted).

Driving this belief is the Fed is either done hiking or has one more hike left. Cuts in 2024.

@BobEUnlimited @dampedspring @TheBondFreak
Read 6 tweets
Sep 7
1/7

The recent "spike" in bankruptcies in August has been much talked about in the last few days.

Some worry it means a "credit event" is coming. This is backward. The credit event is the spike in bankruptcies.

🧵to explain
2/7

The gray line is the monthly plot of bankruptcies.
The blue line is a rolling 3-month average.

In July, there were just 10 bankruptcies. Then the number jumped to 23 in August (gray line). 

Yellow was the highest-profile bankruptcy in August. Image
3/7

While the 3-month average in bankruptcies (blue) is elevated, it lags behind the senior loan officer survey (SLOOS) percentage, saying they are tightening lending standards for commercial and Industrial (C&I) loans (orange). Image
Read 7 tweets
Sep 2
1/11

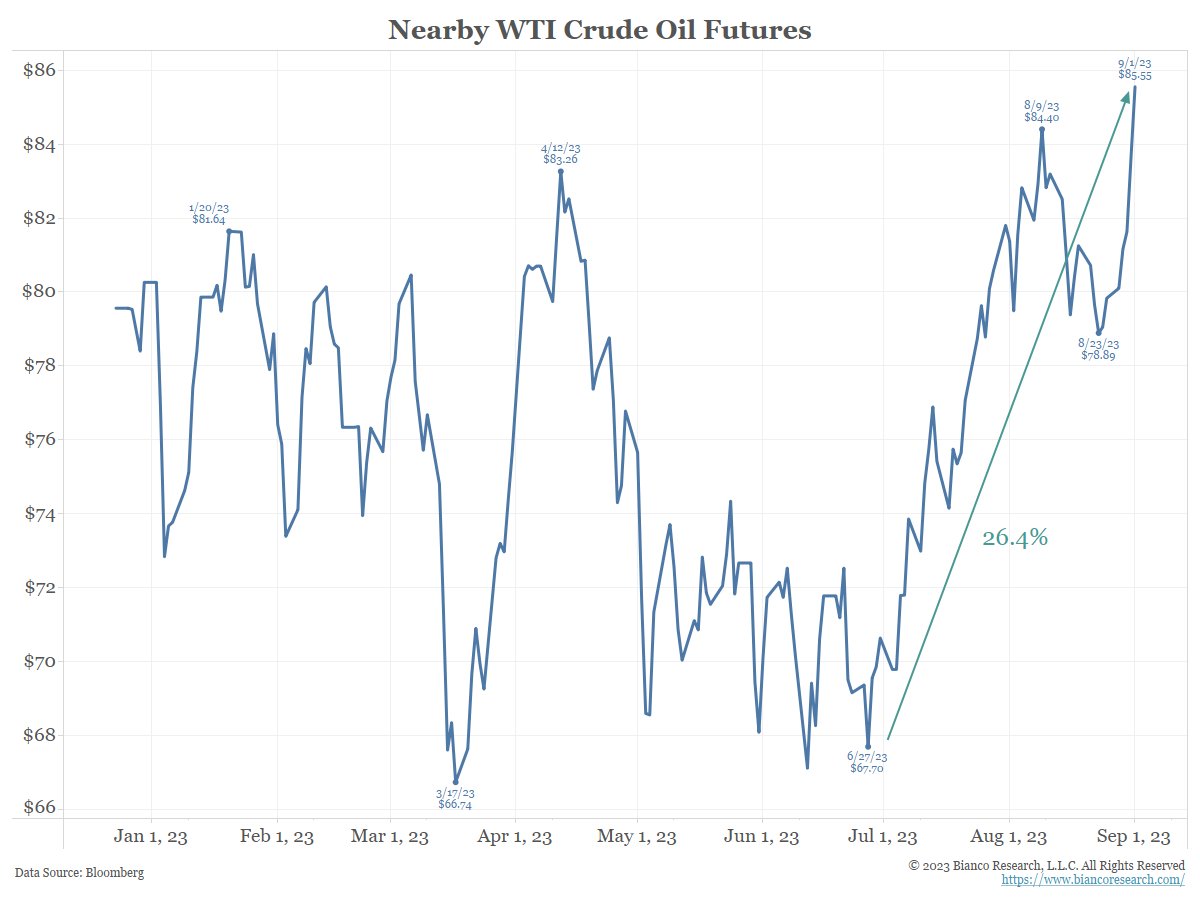
If it is not already the case, crude oil and gasoline prices are about to take center stage.

Prices are staged to keep going up even though they have rallied a lot already.
🧵 Image
2/11

First, US gasoline demand is at a new record, as measured by the Energy Department's Energy Information Agency.

(What drives demand? The economy. This suggests strong economic growth continues, consistent with a booming Atlanta Fed GDPnow.
) atlantafed.org/cqer/research/…
Image
3/11

But it is not just US gasoline demand that is rising. As @JavierBlas detailed yesterday, European gasoline demand is at a decade high.

bloomberg.com/opinion/articl…
Image
Read 14 tweets
Aug 19
1/6

Whatever happened to the bank walk? Or money slowly leaving low-yielding bank deposit accounts for higher-yielding T-Bills and money market accounts?

As the blue line below shows, it never stopped (new low). Money continues to pour into money market funds (orange). Image
2/6

And this continuing bank walking is like nothing we have ever seen before.

(Why? New technology. 120 million use mobile banking apps every month. Two minutes on your phone and you can move into a money market fund and pick up thousands in interest income.) Image
3/6

And the bank walk should continue as the spread between deposit rates (orange) and money market rates (blue) is still the widest ever (red). Image
Read 6 tweets
Aug 12
1/6
Fun with stats:

Below is the weekly change in the NASDAQ 100 (NDX).

The NDX had consecutive weekly declines for the first time this year (last two bars). The last streak of consecutive declines was a streak of 4 ending Dec 30, 2022 (or the NDX decline every week in Dec). Image
2/6

It has been 31 weeks since the NDX had consecutive weeks of decline.

The last time the NDX went this long without consecutive losing weeks was the peak of the NASDAQ bubble in 2000, 22 years ago!

That streak marked the peak of a tech bubble and an 80% decline! Image
3/6

The larger NASDAQ Composite also completed its first consecutive weeks of decline this calendar year, just like the NDX. Image
Read 6 tweets
Aug 2
1/5

The national average of gasoline prices jumped another two cents yesterday to $3.80/gallon.

Over the last nine days, prices have jumped 5.8%. Equaling the January pop higher for the biggest such move since last November. Image
2/5

CPI impact?

The 4th panel shows the monthly price change (2nd panel) times the weight (3rd panel). If $3.80/g holds for the month, it adds 0.19% to CPI.

The bottom panel shows the monthly CPI. When gasoline adds at least 0.10% to CPI, headline CPI prints at least 0.4%. Image
3/5

Have the markets noticed? Yes!

Since gasoline prices (orange) started popping higher on July 19, so has the 5-year/5-year inflation breakeven rate (blue). Image
Read 5 tweets

Did Thread Reader help you today?

Support us! We are indie developers!


This site is made by just two indie developers on a laptop doing marketing, support and development! Read more about the story.

Become a Premium Member ($3/month or $30/year) and get exclusive features!

Become Premium

Don't want to be a Premium member but still want to support us?

Make a small donation by buying us coffee ($5) or help with server cost ($10)

Donate via Paypal

Or Donate anonymously using crypto!

Ethereum

0xfe58350B80634f60Fa6Dc149a72b4DFbc17D341E copy

Bitcoin

3ATGMxNzCUFzxpMCHL5sWSt4DVtS8UqXpi copy

Thank you for your support!

Follow Us on Twitter!

:(