Trapped Traders
a thread 🧵
a thread 🧵
in this thread, I will cover the following:
- how I identify trapped traders using orderflow
- how I use trapped traders for executing trades
- how I use trapped traders as my invalidation
- where I prefer to see trapped traders
- how I identify trapped traders using orderflow
- how I use trapped traders for executing trades
- how I use trapped traders as my invalidation
- where I prefer to see trapped traders
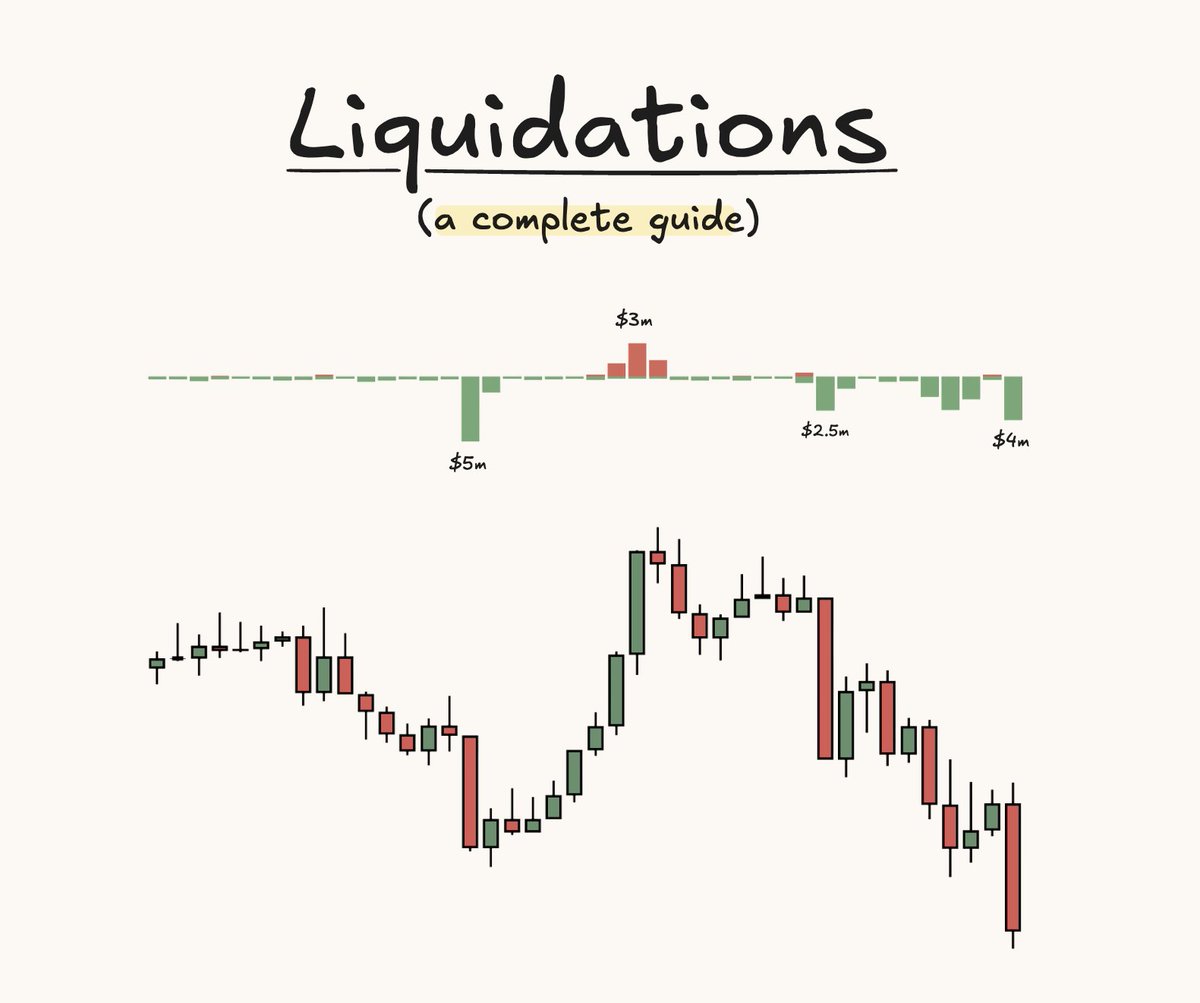
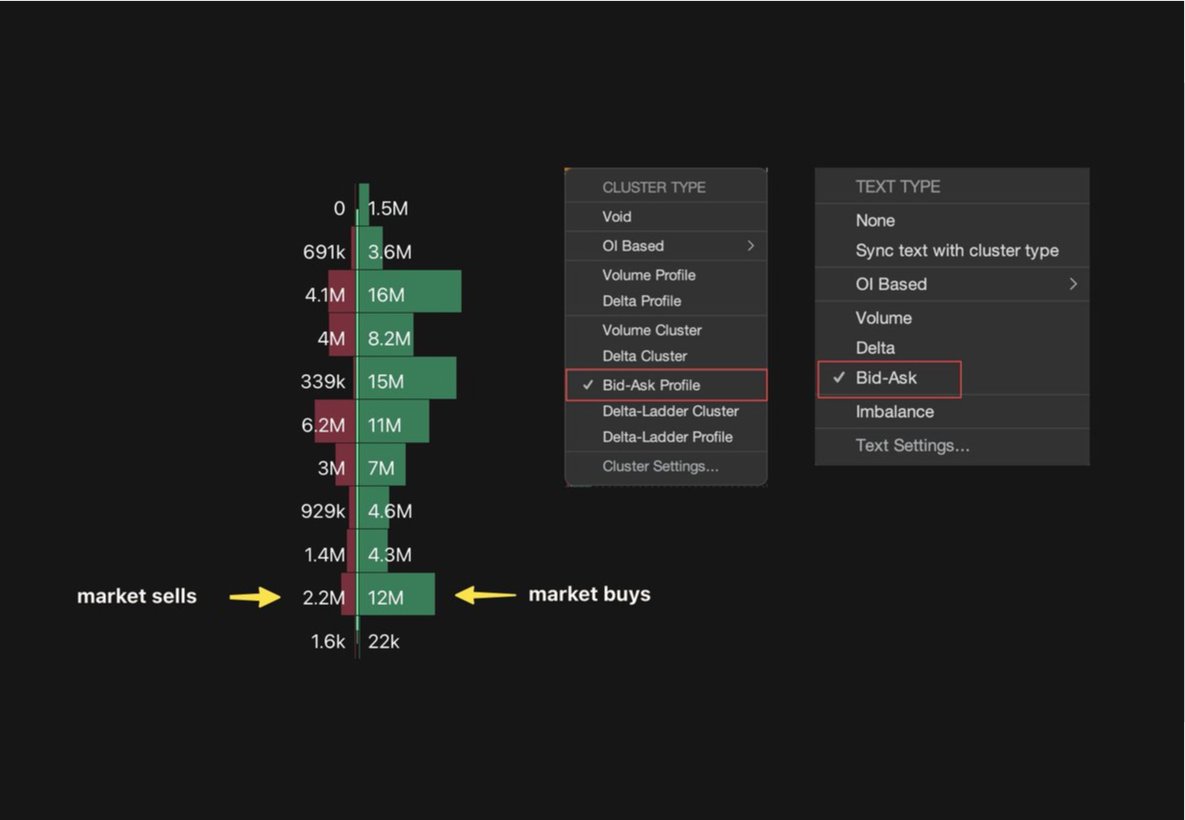
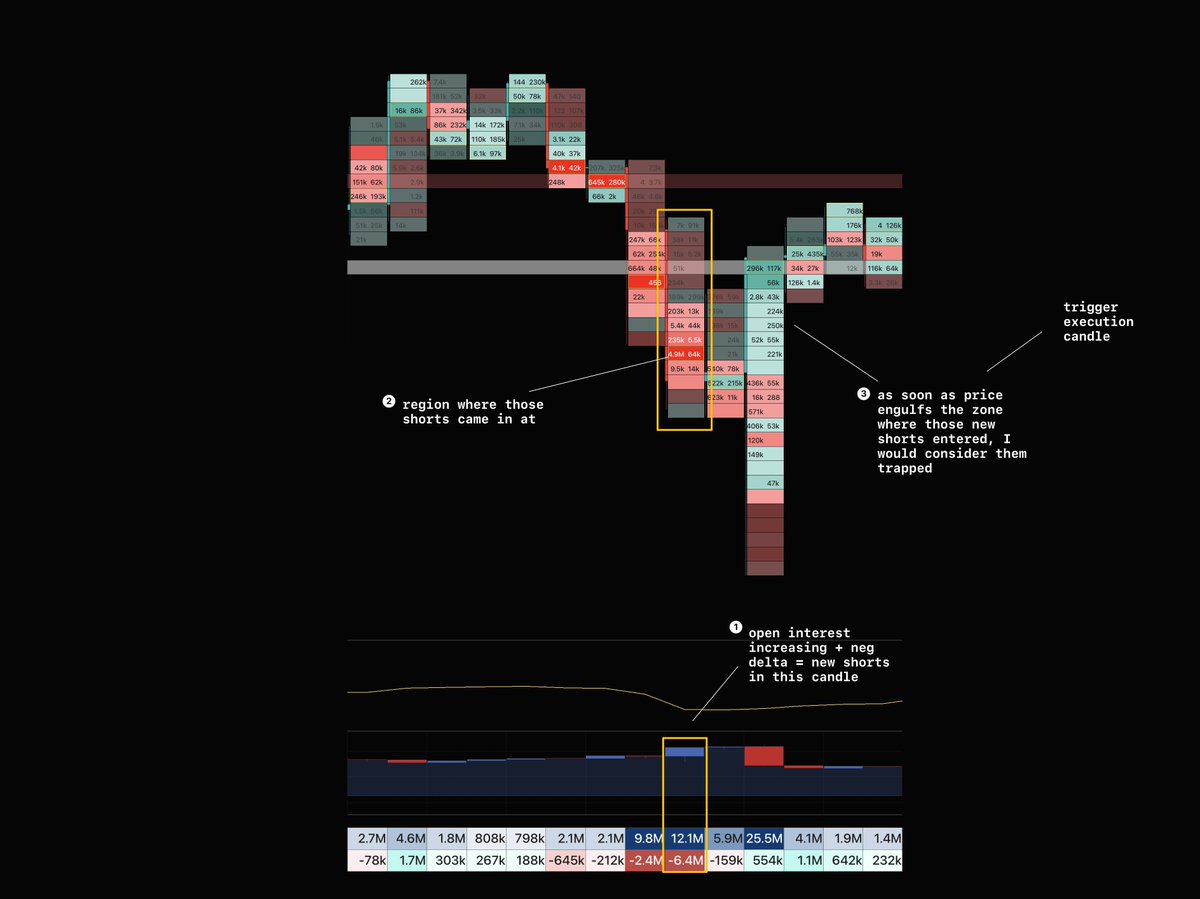
Identifying trapped traders using orderflow ( @ExochartsC )
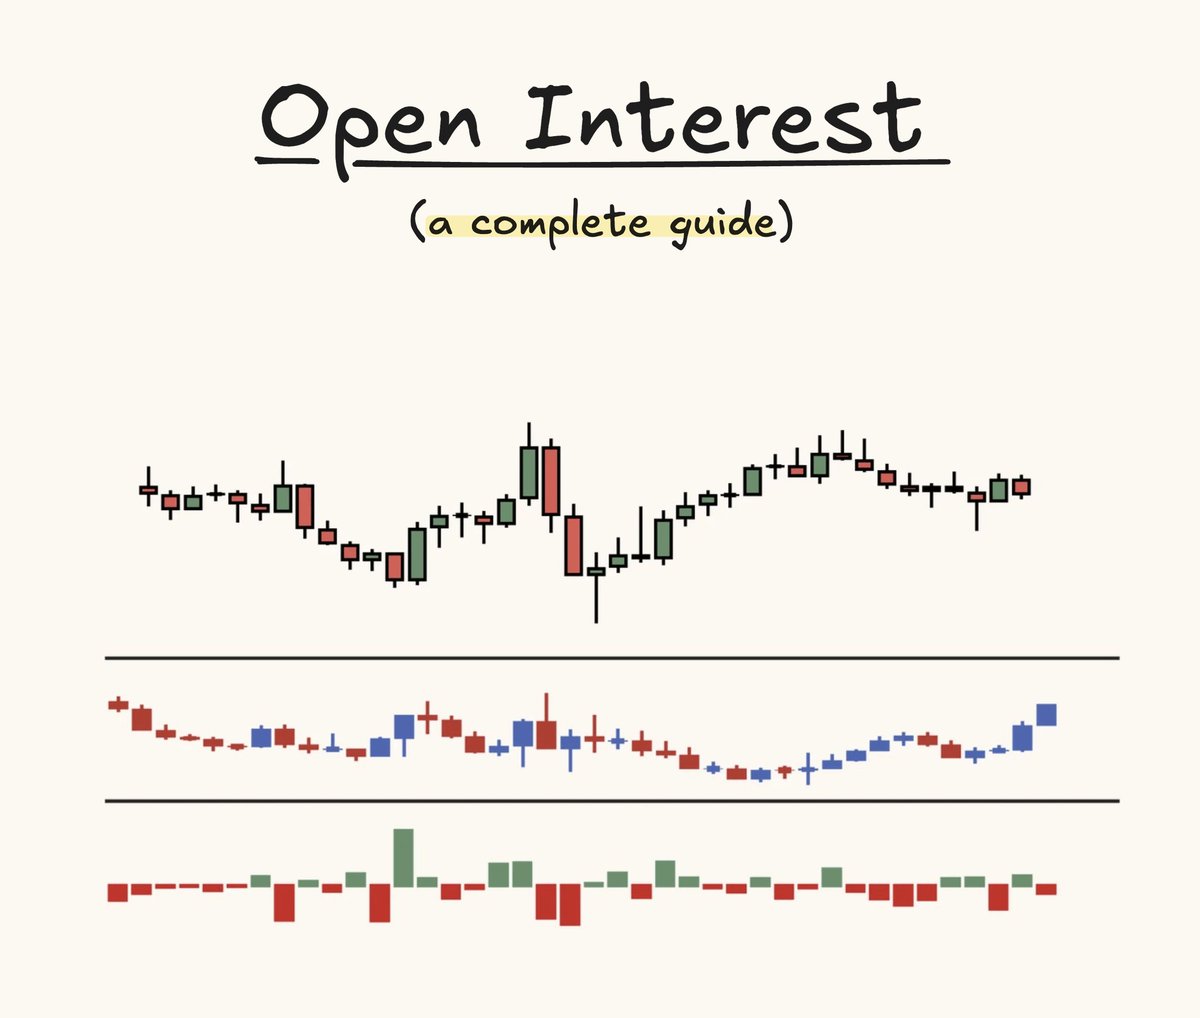
the combination of OI increasing + (either positive or negative delta) is what determines new positions coming in or not.
tip - you can use OI profile settings to identify new positions easier.
the combination of OI increasing + (either positive or negative delta) is what determines new positions coming in or not.
tip - you can use OI profile settings to identify new positions easier.

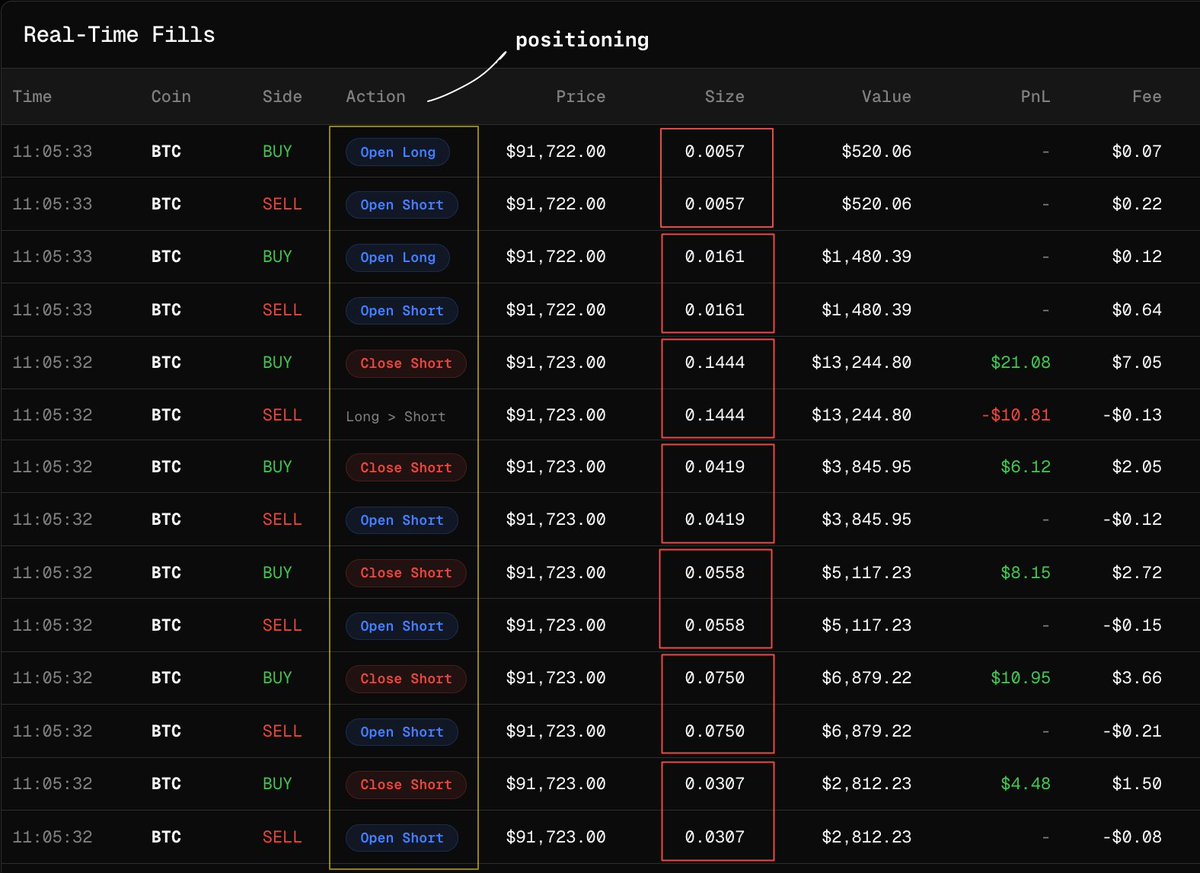
In this thread below, I cover how I exactly decipher what is going on within each individual candle in a simplified manner.
I suggest you read this before you continue reading...
I suggest you read this before you continue reading...
https://twitter.com/Luckshuryy/status/1671222696888107019
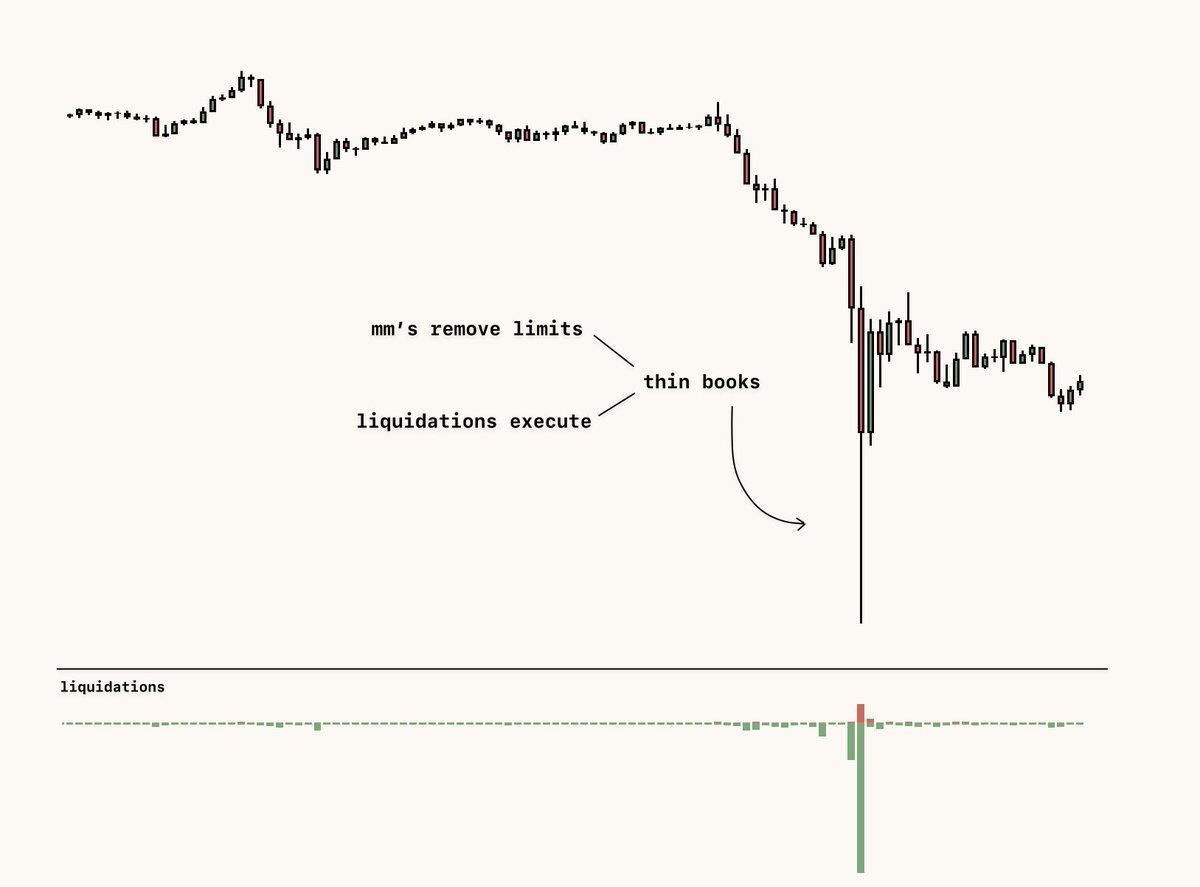
where I look for trapped traders:
- sfp levels (internal - I must stress this point)
- after a ms change
- into a hvn/volume based s/r level
- failed auctions
- obvious pattern fakeouts
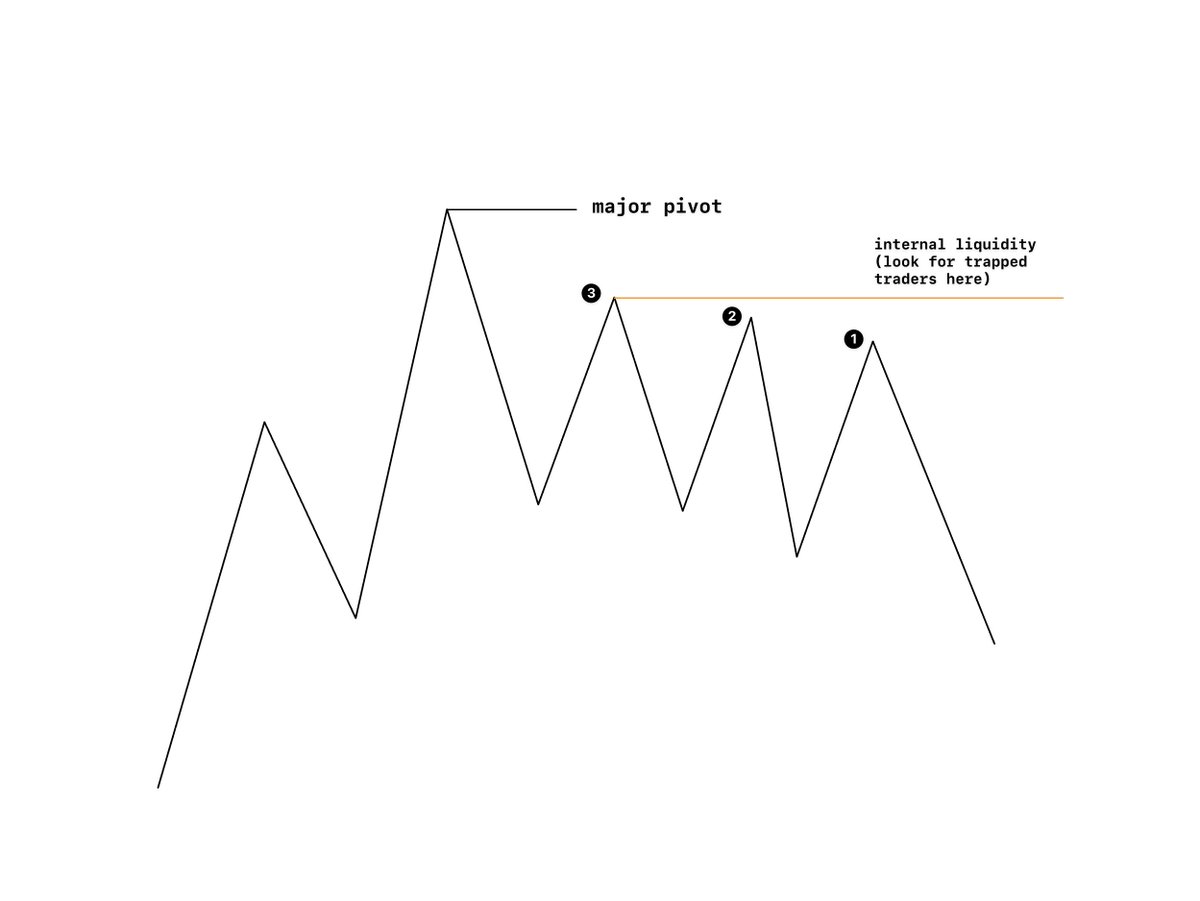
- just before any major pivot is taken
diagram should explain that last point better:
- sfp levels (internal - I must stress this point)
- after a ms change
- into a hvn/volume based s/r level
- failed auctions
- obvious pattern fakeouts
- just before any major pivot is taken
diagram should explain that last point better:
...
the reason this works (I cannot say for definite this is the reason)
however, some people at that stage would be looking to long to target the major pivot high.
the reason this works (I cannot say for definite this is the reason)
however, some people at that stage would be looking to long to target the major pivot high.
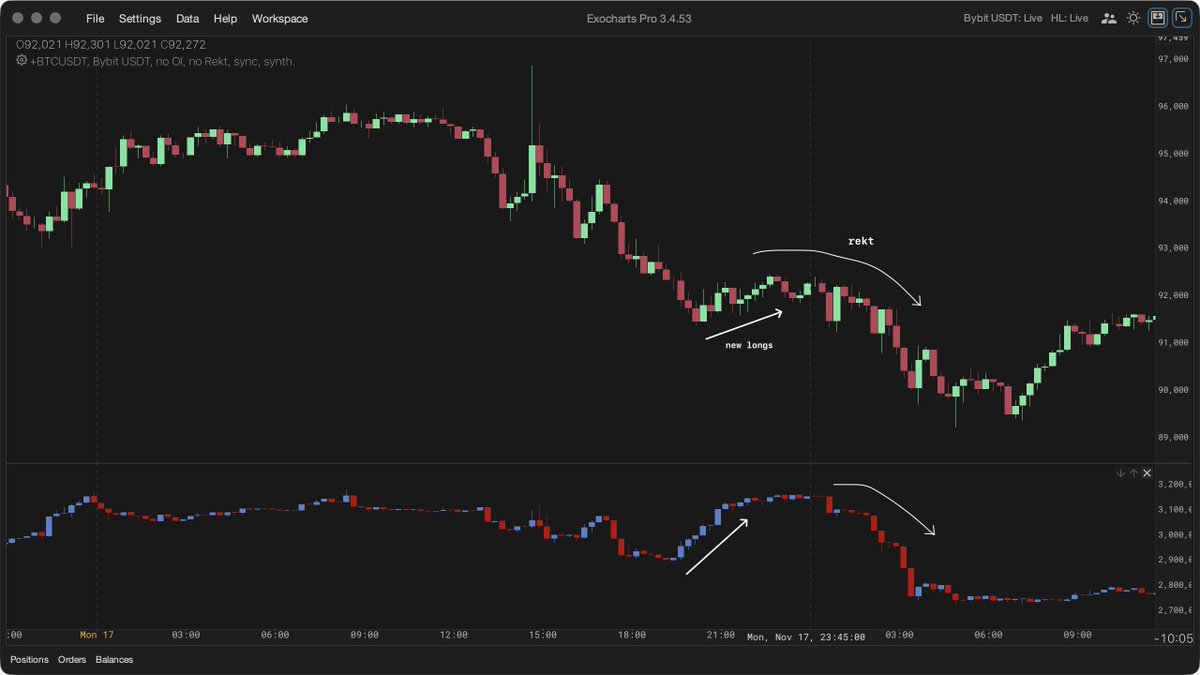
Executing off of trapped traders:
I will only view traders as trapped once price has engulfed them and put them into an offside position.
In the example below, you can see how I identify trapped traders, followed by the point of execution upon the engulfed candle close 👇
I will only view traders as trapped once price has engulfed them and put them into an offside position.
In the example below, you can see how I identify trapped traders, followed by the point of execution upon the engulfed candle close 👇
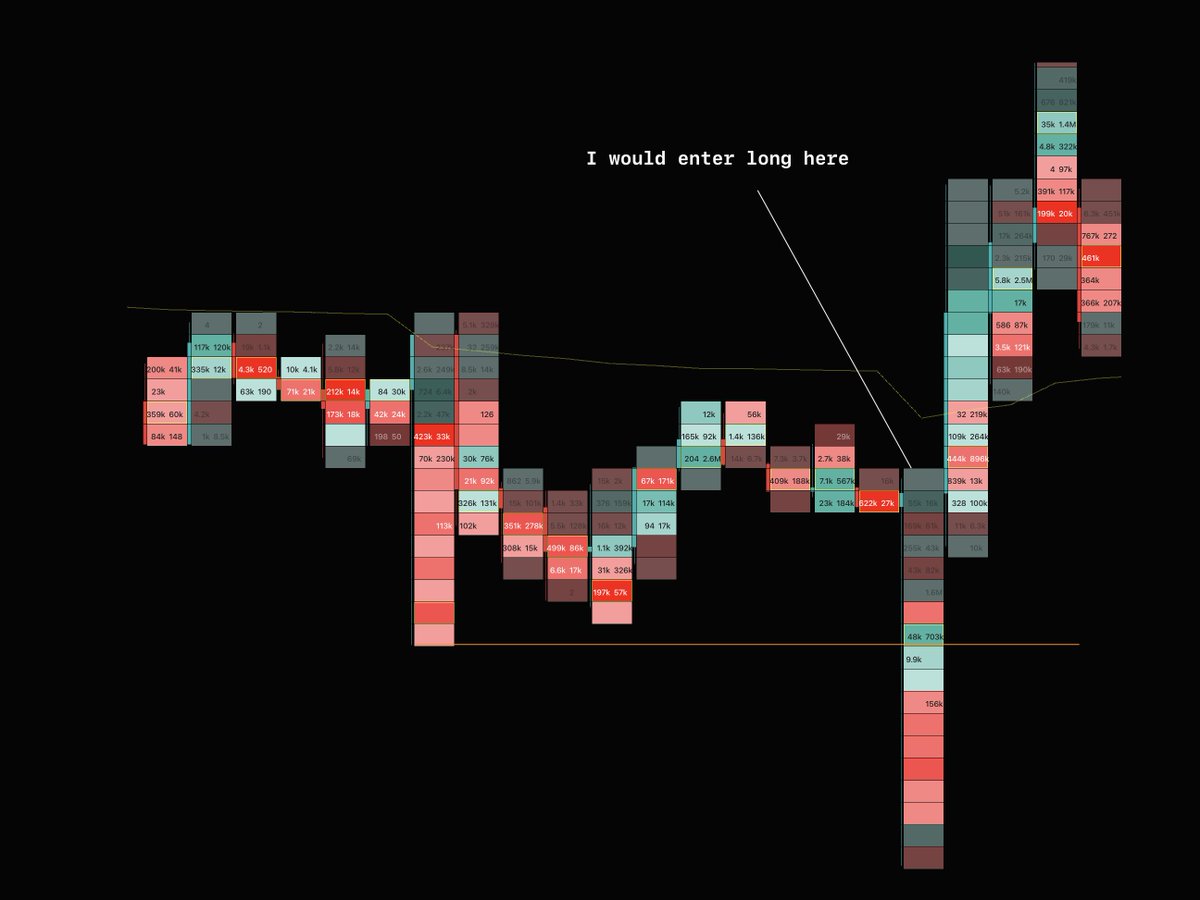
Executing off of trapped traders [2]
I must stress In most cases, for my trade executions, I am entering upon candle closes, whether that be 5m or 15m candles
I'm waiting for the candle close before triggering my hotkey to enter limits just below the current price to get filled
I must stress In most cases, for my trade executions, I am entering upon candle closes, whether that be 5m or 15m candles
I'm waiting for the candle close before triggering my hotkey to enter limits just below the current price to get filled
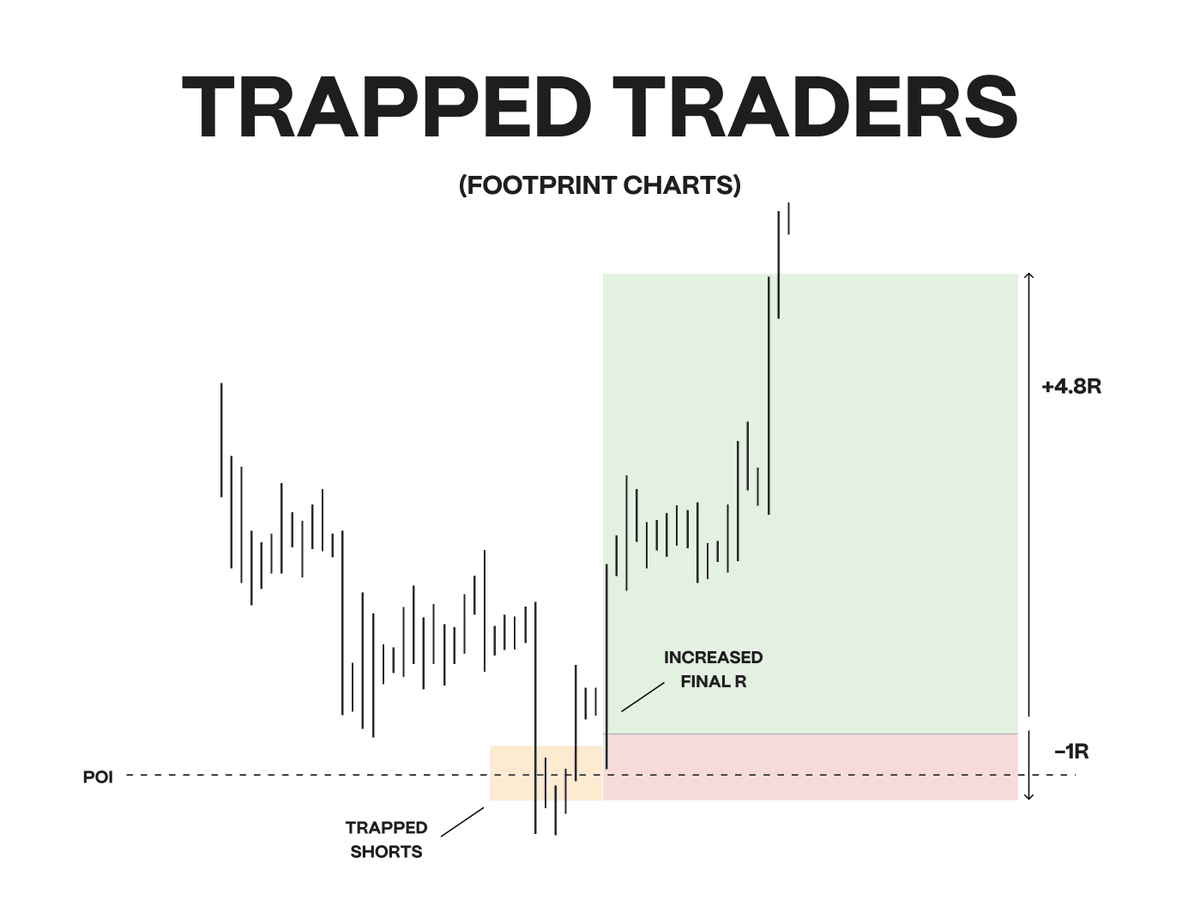
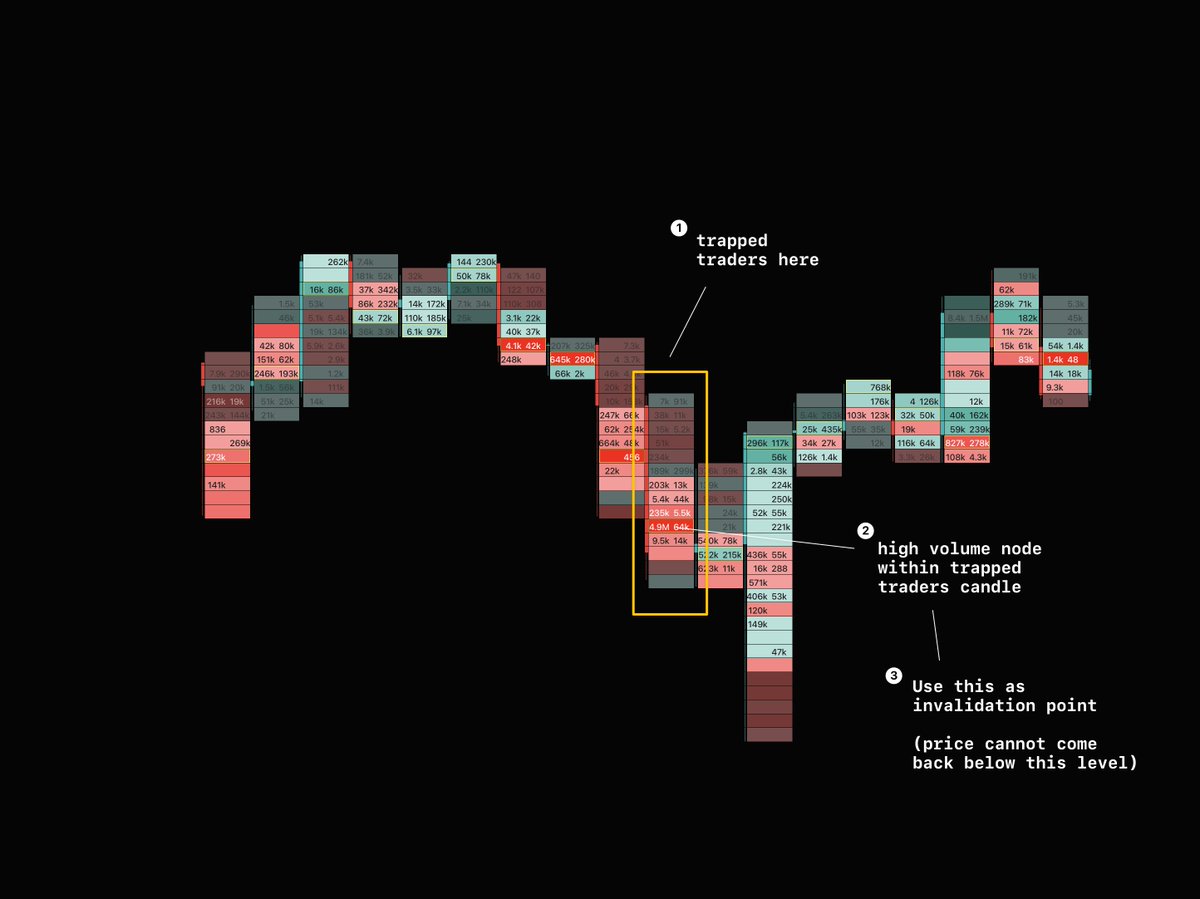
invalidation from trapped traders
- find the candle(s) where the trapped traders had entered
- find within that candle the hvn/large volume region where new positions likely had entered from
- use that as the invalidation
- find the candle(s) where the trapped traders had entered
- find within that candle the hvn/large volume region where new positions likely had entered from
- use that as the invalidation
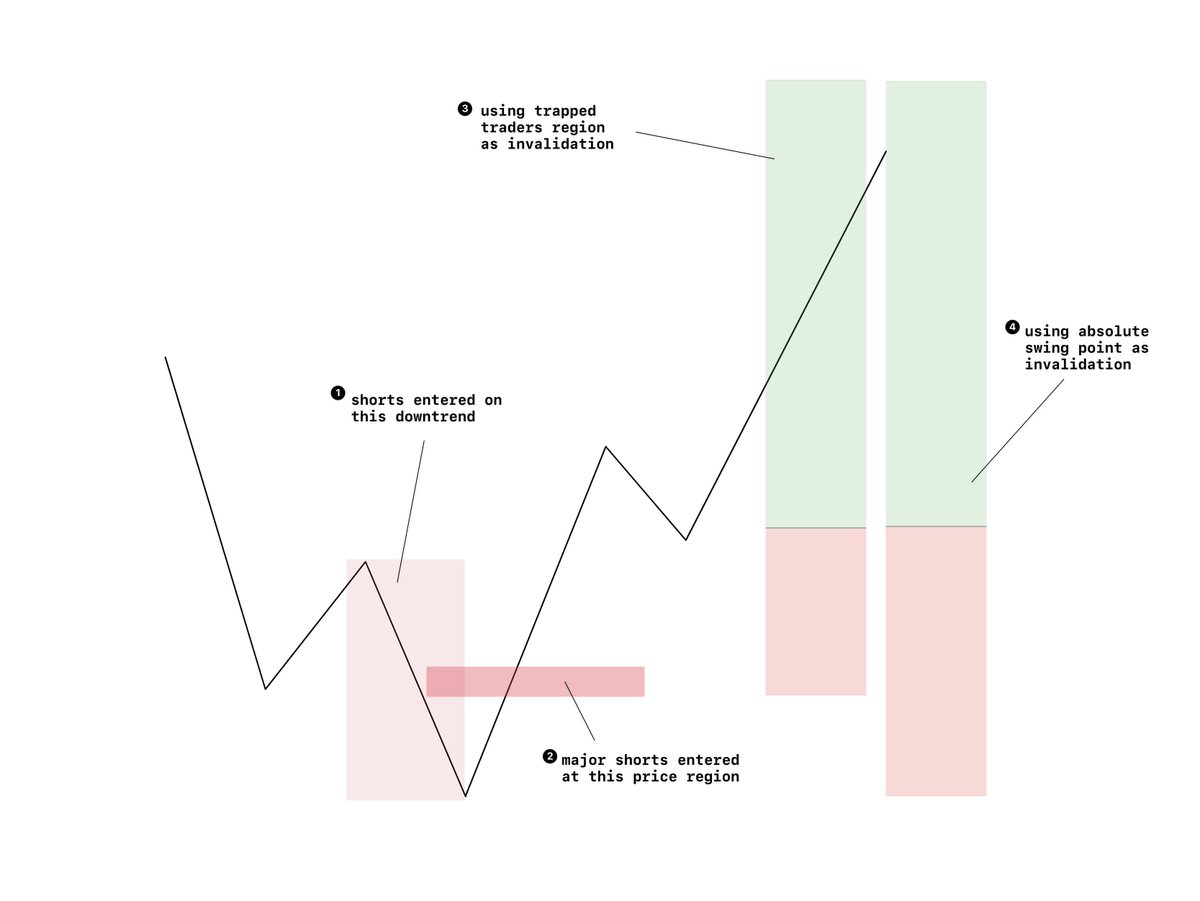
invalidation from trapped traders [2]
note that you can use the absolute low/high of the move as your invalidation.
however, using the region where the trapped traders occur generally would end up increasing your final r whilst also having good logic behind doing so.
note that you can use the absolute low/high of the move as your invalidation.
however, using the region where the trapped traders occur generally would end up increasing your final r whilst also having good logic behind doing so.
hope you found this valuable
a like is appreciated on the first post of this thread
any more recommendations on what you would want me to cover let me know down below 👇
a like is appreciated on the first post of this thread
any more recommendations on what you would want me to cover let me know down below 👇
• • •
Missing some Tweet in this thread? You can try to
force a refresh