🚨🚨Vaccination Saves Lives🚨
UK/ONS Misinfo correction
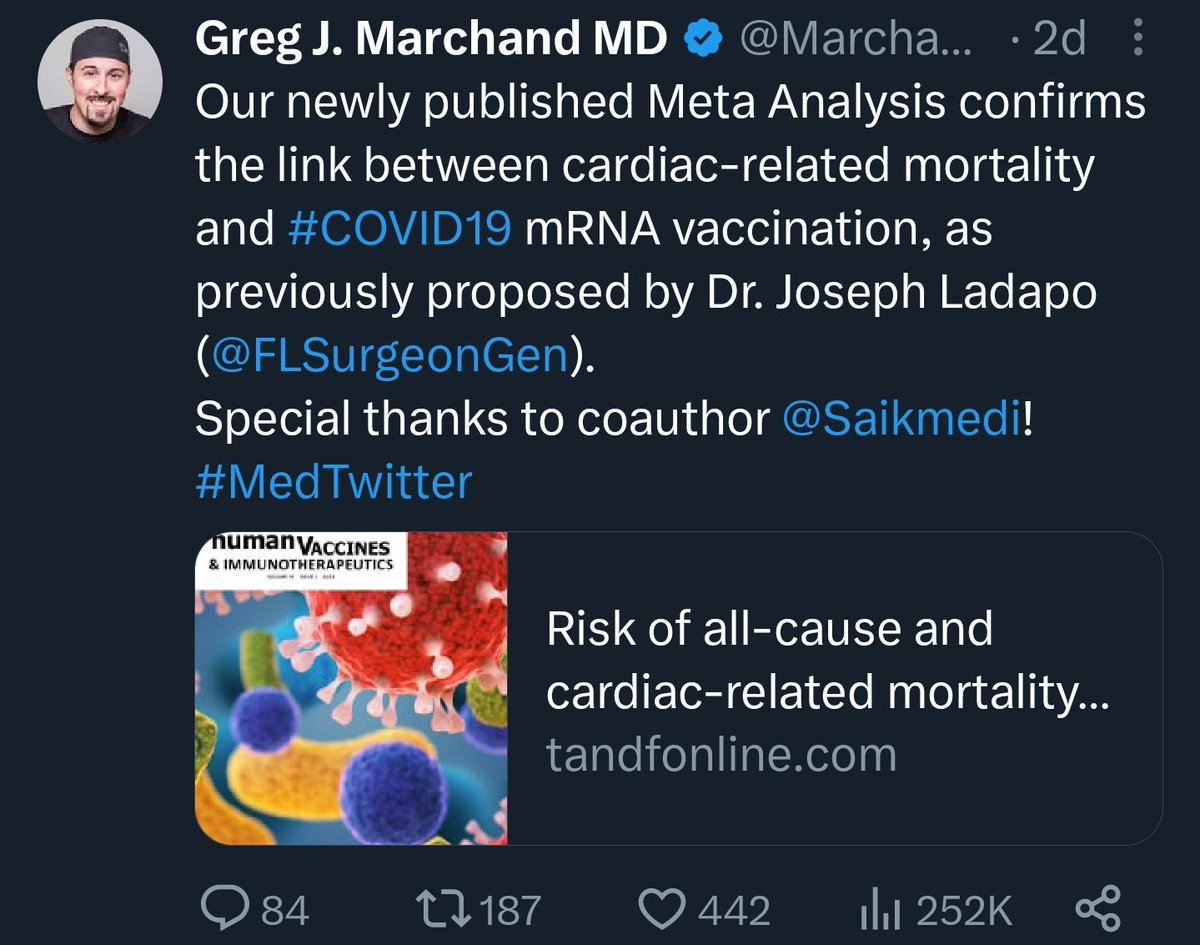
Contrary to twitter claims, UK's ONS shows stark protection is evident, AT EVERY AGE. Misinfo ghouls lie.
Here's a thread!
First: All-age mortality
-34% mortality (-74% covid, -28% non-covid) if vaxxed!
/1

UK/ONS Misinfo correction
Contrary to twitter claims, UK's ONS shows stark protection is evident, AT EVERY AGE. Misinfo ghouls lie.
Here's a thread!
First: All-age mortality
-34% mortality (-74% covid, -28% non-covid) if vaxxed!
/1


We're going to break this down by ages (for "it's just old people" ageist awful ghouls") in a second, but let's orient:
On the left, big:
All-cause mortality (Vax: -34%)
On the top right:
COVID mortality (Vax: -74%)
On the bottom right:
Non-COVID mortality (Vax: -28%)
/2
On the left, big:
All-cause mortality (Vax: -34%)
On the top right:
COVID mortality (Vax: -74%)
On the bottom right:
Non-COVID mortality (Vax: -28%)
/2


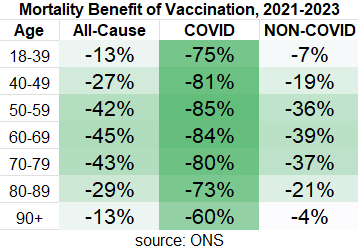
In the oldest age group, 90+, we see benefit of -12.5% mortality to being vaccinated. For COVID mortality, it's -60% and for non-COVID mortality it's -4%
(likely healthy vaccine effect w/early non-covid benefit, so more likely negligable non-COVID mortality benefit)
/3
(likely healthy vaccine effect w/early non-covid benefit, so more likely negligable non-COVID mortality benefit)
/3


Ages 80-89: -29% mortality benefit to being vaccinated.
For COVID mortality, it's -73%
For non-COVID mortality it's -21%
("healthy vax fx" NOT likely outside of first few months, COVID death undercount is a more likely explanation as it matches covid death wave)
/4
For COVID mortality, it's -73%
For non-COVID mortality it's -21%
("healthy vax fx" NOT likely outside of first few months, COVID death undercount is a more likely explanation as it matches covid death wave)
/4


Ages 70-79: -43% mortality benefit to being vaccinated.
For COVID mortality, it's -80%
For non-COVID mortality it's -37%
my guess as to the "blip" of increased mortality in 2022 is breakthrough serious infection in previously protected people, perhaps delayed vax rollout?
/5
For COVID mortality, it's -80%
For non-COVID mortality it's -37%
my guess as to the "blip" of increased mortality in 2022 is breakthrough serious infection in previously protected people, perhaps delayed vax rollout?
/5


Ages 60-69: -45% mortality benefit to being vaccinated.
For COVID mortality, it's -84%
For non-COVID mortality it's -39%
Just absolutely stark, likely combination of healthy vax fx + undercount COVID + med complications of covid infection.
/6
For COVID mortality, it's -84%
For non-COVID mortality it's -39%
Just absolutely stark, likely combination of healthy vax fx + undercount COVID + med complications of covid infection.
/6


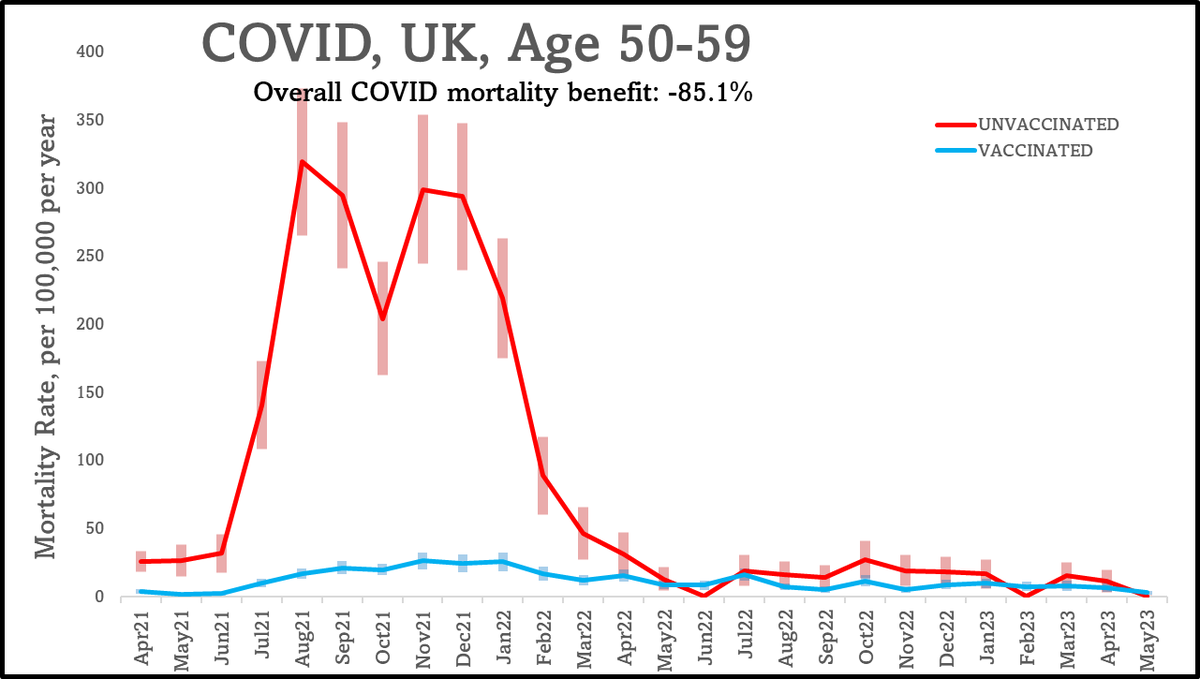
Ages 50-59: -42% mortality benefit to being vaccinated.
For COVID mortality, it's -85%
For non-COVID mortality it's -36%
Absolutely obvious and incredible mortality protection by being vaccinated.
/7
For COVID mortality, it's -85%
For non-COVID mortality it's -36%
Absolutely obvious and incredible mortality protection by being vaccinated.
/7


Now interestingly, below 50, we have strong evidence an inverse to "Healthy vax effect"- under 50, vaccines were first offered to the very sick.
(to illustrate: non-COVID mortality for 90+y with likely "healthy vax fx", for 40-49y with "unhealthy vax fx")
Lets press on!
/7
(to illustrate: non-COVID mortality for 90+y with likely "healthy vax fx", for 40-49y with "unhealthy vax fx")
Lets press on!
/7


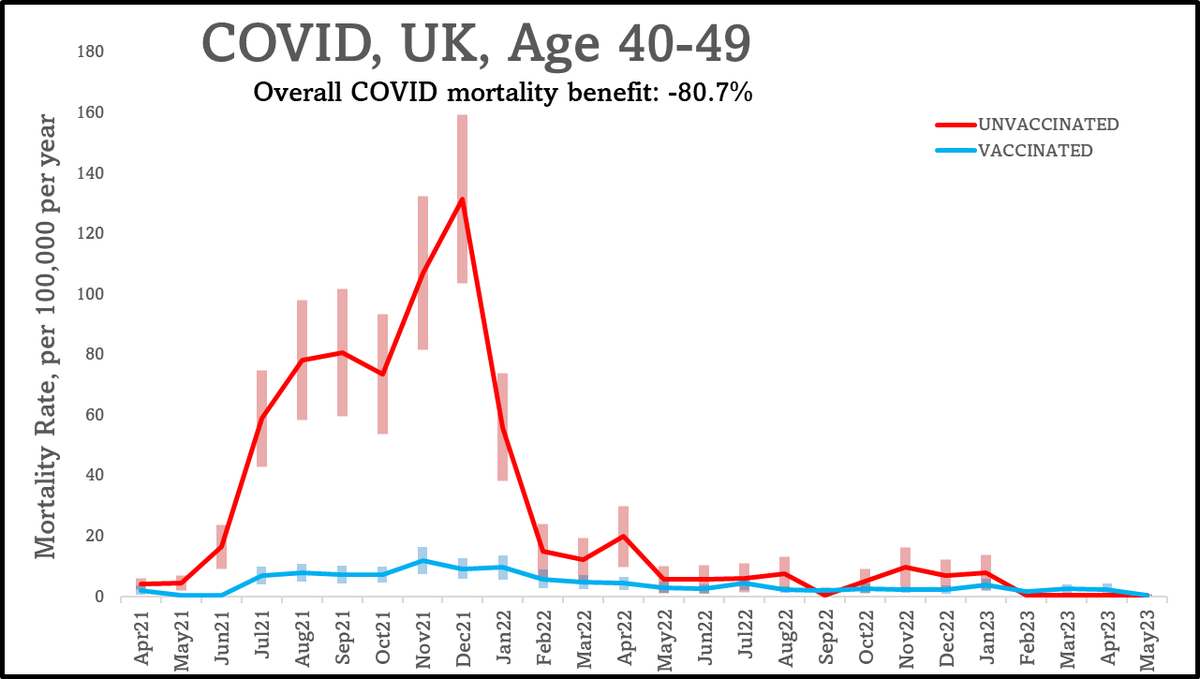
Ages 40-49: -27% mortality benefit to being vaccinated.
For COVID mortality, it's -81%
For non-COVID mortality it's -19%
And this is **battling** a likely "unhealthy vaccine effect" early on. Note at this young age, NO increased non-covid mortality even by may 2023!
/8
For COVID mortality, it's -81%
For non-COVID mortality it's -19%
And this is **battling** a likely "unhealthy vaccine effect" early on. Note at this young age, NO increased non-covid mortality even by may 2023!
/8


Ages 18-39: -13% mortality benefit to being vaccinated.
For COVID mortality, it's -75%
For non-COVID mortality it's -7% (with a HUGE headwind of early "unhealthy vax effect")
Unequivocally: even for the very young, COVID vaccination prevented death and did NOT cause death.
/9
For COVID mortality, it's -75%
For non-COVID mortality it's -7% (with a HUGE headwind of early "unhealthy vax effect")
Unequivocally: even for the very young, COVID vaccination prevented death and did NOT cause death.
/9


Quick data note - for COVID deaths at this young age group, we are dealing with very few covid deaths in 2022 onwards. However, given the overall mortality benefit, no evidence of non-covid mortality harm, the risk-benefit analysis clearly supports vaccinating this group.
/10
/10
So how do the misinfo ghouls lie?
1) cherrypicking extremes
We are usually dealing with 95% error, so if we chop data into 2 sexes, 9 vaccination states, & 7 age groups, we are making 126 comparisons per month. To adjust, error would have to be 99.96%!
/11
1) cherrypicking extremes
We are usually dealing with 95% error, so if we chop data into 2 sexes, 9 vaccination states, & 7 age groups, we are making 126 comparisons per month. To adjust, error would have to be 99.96%!
/11
2) ignoring the very likely "unhealthy vax effect"
The ghouls LOVE to show a subset where 18-39 year olds are more likely to die:
However, as i've demonstrated, the "Healthy vaccine effect" INVERTS at age 50, meaning that in this young group, likely a very strong effect.
/12
The ghouls LOVE to show a subset where 18-39 year olds are more likely to die:
However, as i've demonstrated, the "Healthy vaccine effect" INVERTS at age 50, meaning that in this young group, likely a very strong effect.
/12

Almost certainly, each subsequent booster, especially without mandates, will be taken by the people with the greatest health problems in the 18-39 age group.
After the winter campaign for 4th boosters in the UK, only 9% of 18-39 year olds received a vaccine!
/13
After the winter campaign for 4th boosters in the UK, only 9% of 18-39 year olds received a vaccine!
/13

3) COVID ghouls love to lie about the data. Lies, unfortunately, can be hidden behind clever use of statistics or ignoring biases.
/14
/14
CONCLUSION:
ONS UK data clearly shows that for both NON-COVID and COVID deaths, mortality benefit of vaccination exceeds mortality risk, and vaccination saves lives.
(note: non-covid benefit mostly derived from 2021-mid 2022, but still slightly beneficial 2022-2023)
/15
ONS UK data clearly shows that for both NON-COVID and COVID deaths, mortality benefit of vaccination exceeds mortality risk, and vaccination saves lives.
(note: non-covid benefit mostly derived from 2021-mid 2022, but still slightly beneficial 2022-2023)
/15
SOURCES:
All of this data comes from the ONS:
And the ONS writes this up very nicely:
ons.gov.uk/peoplepopulati…
ons.gov.uk/peoplepopulati…
All of this data comes from the ONS:
And the ONS writes this up very nicely:
ons.gov.uk/peoplepopulati…
ons.gov.uk/peoplepopulati…
• • •
Missing some Tweet in this thread? You can try to
force a refresh