Mike Konczal Profile picture
Oct 6 3 tweets 2 min read Twitter logo Read on Twitter
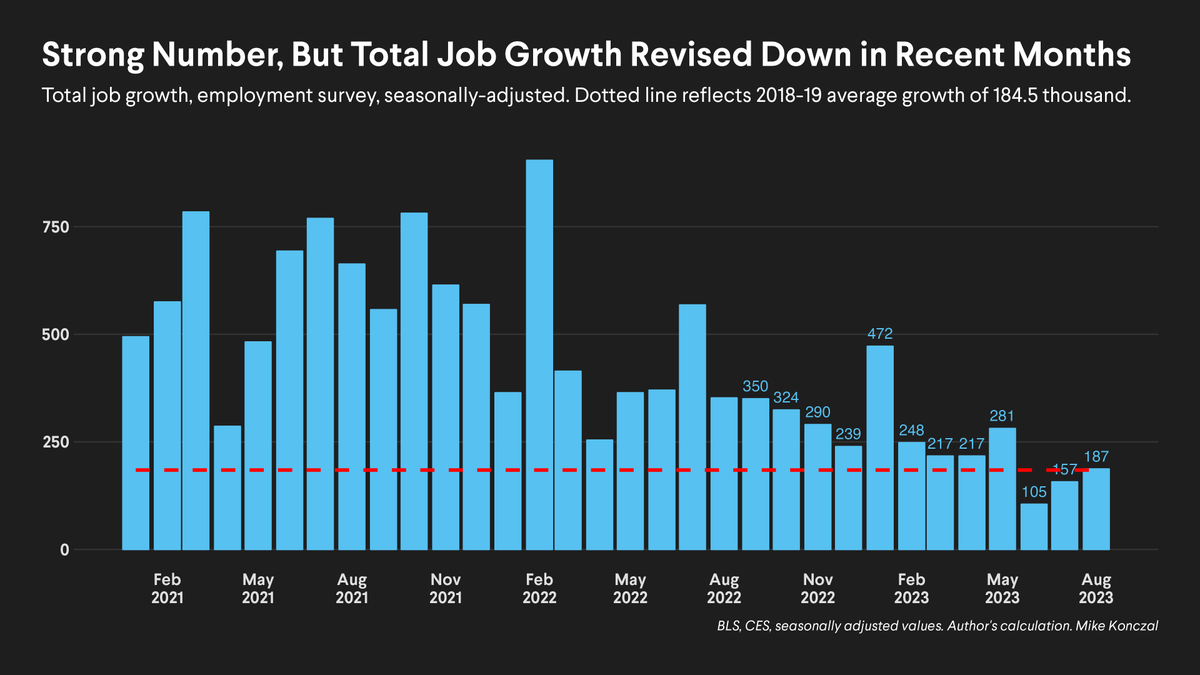
Two things to catch in the jobs numbers - nominal wages have decelerated such that the last two monthly numbers are actually below 2018-2019 levels.

There's a lot of noise and revisions, I wouldn't go off any one number, but this is not an overheated labor market. /1 Image
Unemployment stayed at 3.8%. But who is counted as unemployed shifted last couple months. Much more likely to be "new entrants/reentrants" than earlier 2023.

That's great. That's who we want in unemployed, people pulled into the labor market (not job losers). Expanded supply. /2 Image
Last, something people haven't been watching, (because why would they - it's not the early/mid 2010s) but, mirroring JOLTs slowdown trends, unemployment duration has crept back up to 2019 levels in recent months.

That's not a sign of overheating. 3/3 Image

• • •

Missing some Tweet in this thread? You can try to force a refresh
 

Keep Current with Mike Konczal

Mike Konczal Profile picture

Stay in touch and get notified when new unrolls are available from this author!

Read all threads

This Thread may be Removed Anytime!

PDF

Twitter may remove this content at anytime! Save it as PDF for later use!

Try unrolling a thread yourself!

how to unroll video
  1. Follow @ThreadReaderApp to mention us!

  2. From a Twitter thread mention us with a keyword "unroll"
@threadreaderapp unroll

Practice here first or read more on our help page!

More from @mtkonczal

Sep 29
Well that's about the best inflation print ever. Core PCE has a monthly value below 2 percent annualized (the Fed's target) for the first time since the lockdowns.

But under the hood it's even better - it's all in the right directions. Let's dive in. /1 Image
This month had zero inflation in core goods and further slowing in services, especially non-housing services. This is exactly the scenario we want to see.

(Last month had the opposite, with negative goods masking a pop in services; why the Fed started using this distinction.) /2 Image
Ok that's a lot of volatility in non-housing services. What's the trend? Good I'd say. The negative case is that the three- and six- month are the same, but I think that's hiding a real step-down in the level in recent months.

Worth pausing to see if it continues. /3 Image
Read 8 tweets
Sep 13
There's going to be variance. After 2 months of core CPI inflation at or below 2017-2019 levels, we have a number that popped higher. (Though this 1-month number is still lower than any number since 2022 outside the previous 2.)

Let's dig into what's going on underneath this. /1 Image
You can see the strong downward trend in 2023 by looking at the 3-month and 6-month values, which clock in at 2.4 and 3.7 percent respectively. Contrast that to values around 6 percent in 2022.

What's driving this, and what does it mean for the second half of 2023? /2 Image
If we look at goods/shelter/rest-of-services, we can see goods remain at zero (even with an investment boom ongoing!). Meanwhile shelter continues to decrease, but not enough to offset a pop in services.

What's driving that this month? /3 Image
Read 10 tweets
Sep 1
So let's jump right in: this month was right on the 2018-2019 average, but revisions lowered previous two months, especially, as you can see, for June. So labor market softening to watch here.

What's going on with that unemployment number? I have a take. /1 Image
Unemployment rate increased to 3.8 percent. Here is a graphic of the four categories in that.

To me, and I may reverse this take with more analysis, is that this is driven more by "new entrants and reentrants" than not temporary job losers, though that number did tick up too. /2 Image
You can see that in overall Labor Force Participation, which increased again and is so notably above CBO's prepandemic and pre-American Rescue Plan's projections. /3 Image
Read 7 tweets
Aug 10
Solid inflation report. Today we see 2 months of prepandemic levels of core inflation in a row. I added two lines which correspond to the two previous iterations of inflation panic in this recovery - we're distinctly down.

But there's some trends underneath worth flagging. /1 Image
First best news - another month of 0% goods inflation, stripping out used car prices (which are pulling them down more).

In the 21C through COVID, goods inflation has been around zero, completely invariant to demand conditions. Are we back? If so it realigns inflation debate. /2 Image
It's tough to judge noise from signal in monthly analysis. This month saw a pickup in Shelter and Non-Housing Services, likely giving some hawkish vibes in commentary.

While there's some debate on how far Shelter goes down, the overall trend is still in the right direction. /3 Image
Read 8 tweets
Jul 12
There it is: core inflation right at 2017-2019 levels. This is preloaded - and look, it's right there!

This is after ~9 months of it being stuck around 5 percent. More, when we look under the hood, there's reasons to believe this may continue. Let's dive in. /1
Looking at the three layers of inflation the Fed has emphasized (this is in units of contribution to inflation), all positive developments:
- Core goods at zero
- shelter continuing its decline
- rest of core goods has the lowest level since the recovery started. /2
I haven't said much because I didn't want to jinx it, but for the past 3 month we've had zero goods inflation outside always volatile used car valuations.

This was a big story of the recovery, the stubborn rise of goods after decades of slight deflation. Are we through this? /3
Read 8 tweets
May 10
Once again, core inflation moves sideways this month. It's lower by an important step than it was last year, but still one step above where it was pre-crisis.

However, under the hood, there's important shifts happening. Let's dive in. /1 Image
The story you are going to hear about is in this graphic. There was a lot of debate about shelter, but it slowed yet again this month - maybe the data is finally catching up?

But goods had a giant jump up, more than offsetting that. And rest of core services remains elevated. /2 Image
Here's where I was watching - the jump in used cars, which many analysts predicted, was partially offset by the rest of goods not seeing a price increase.

Stepping back from specifics, inflation in goods in 2023 has been higher overall than what the Fed expects. /3 Image
Read 8 tweets

Did Thread Reader help you today?

Support us! We are indie developers!


This site is made by just two indie developers on a laptop doing marketing, support and development! Read more about the story.

Become a Premium Member ($3/month or $30/year) and get exclusive features!

Become Premium

Don't want to be a Premium member but still want to support us?

Make a small donation by buying us coffee ($5) or help with server cost ($10)

Donate via Paypal

Or Donate anonymously using crypto!

Ethereum

0xfe58350B80634f60Fa6Dc149a72b4DFbc17D341E copy

Bitcoin

3ATGMxNzCUFzxpMCHL5sWSt4DVtS8UqXpi copy

Thank you for your support!

Follow Us on Twitter!

:(