
Senior Director Policy and Research, @EconomicSecProj. Former NEC. Liberal. #Rstats. Team Macro. Dad. Chicago guy.
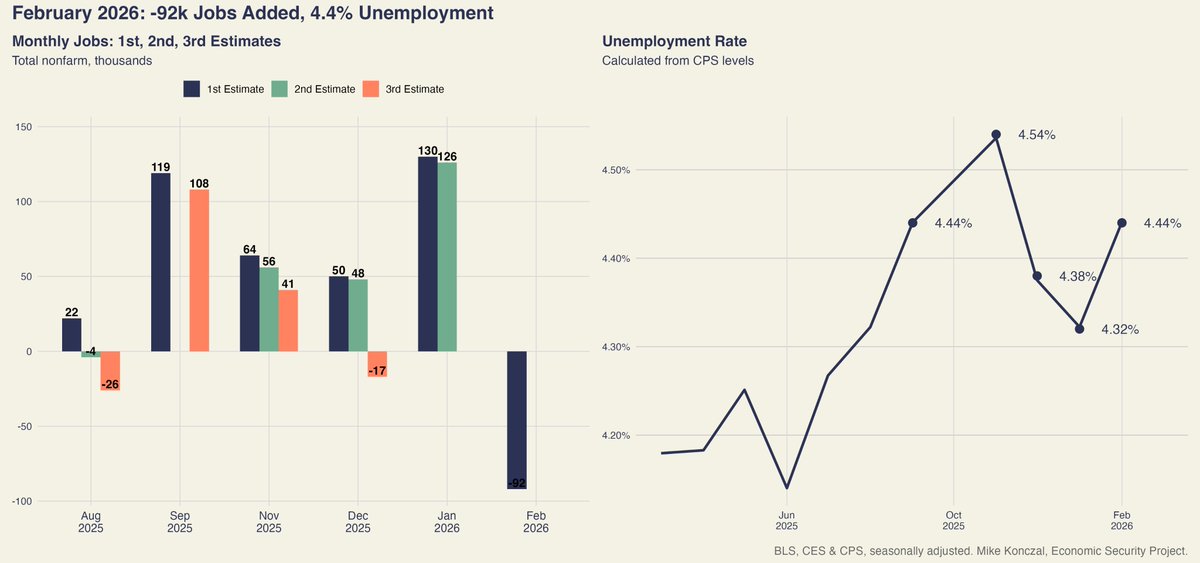 Start with unemployment: unemployment has hovered around 4.4% the last 6 months, an increase from the ~4.1% of the previous 12.
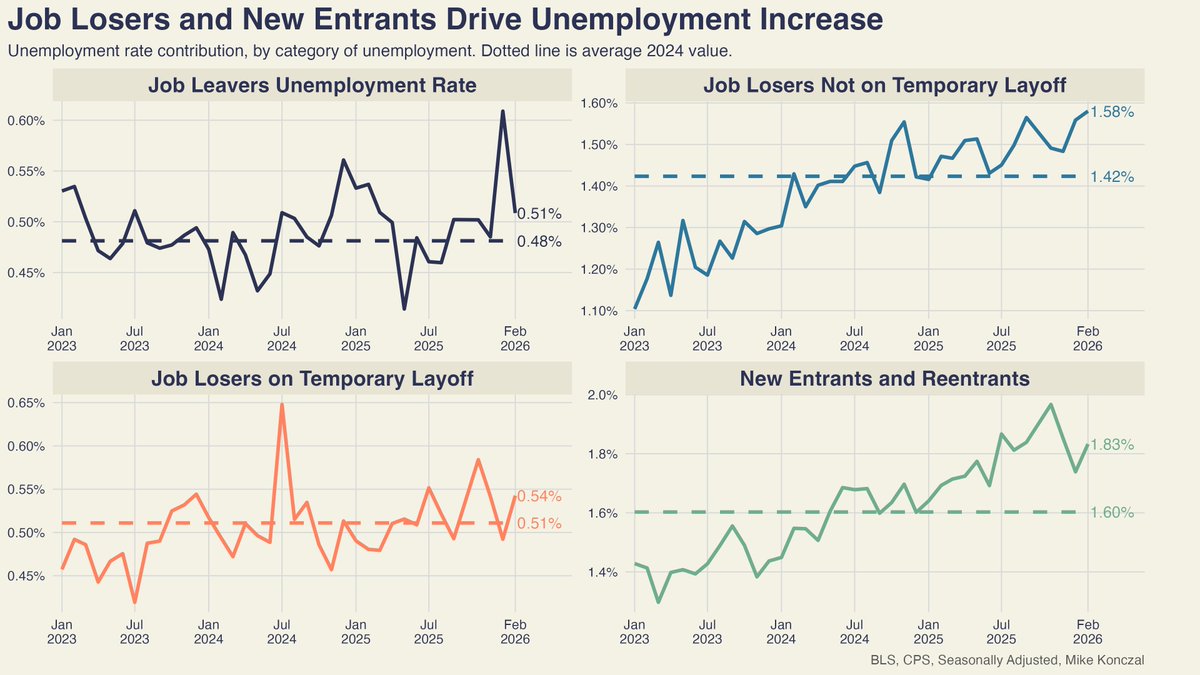
 As par for the course, 95% of those total job gains in January are from health care and social assistance. That's about 124% of private sector job growth since liberation day.
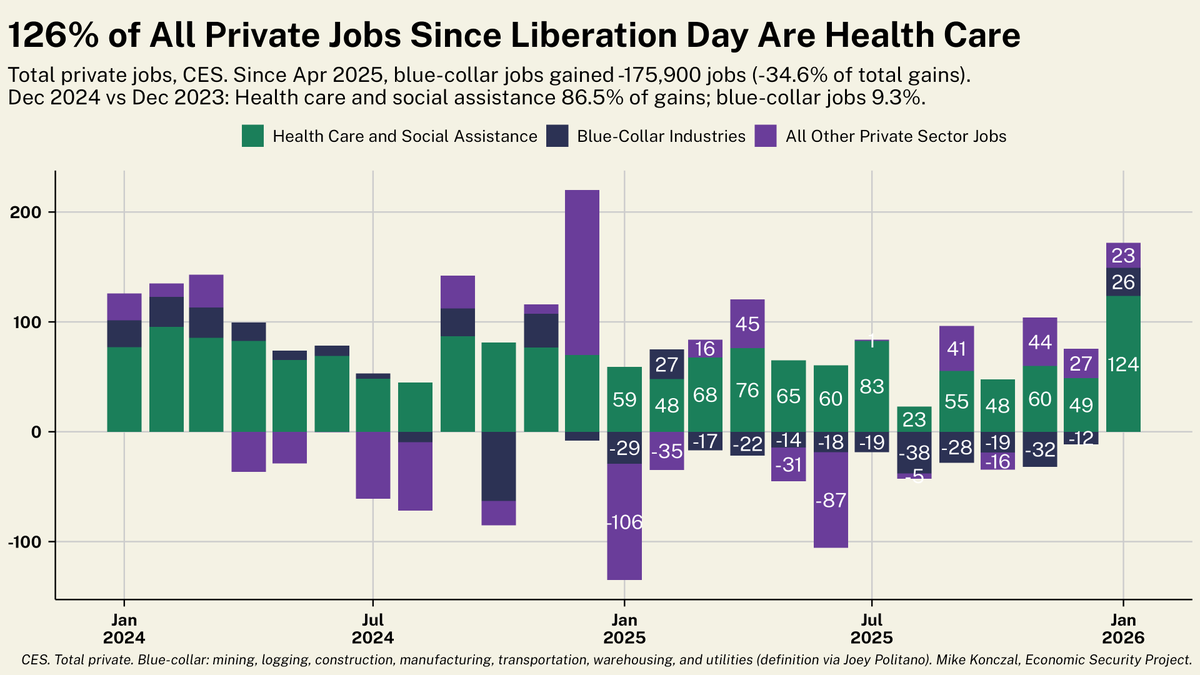
 If you want to see where unemployment increased, here it is broken down.
 Three-month core inflation pops to 3.6%, among the highest its been in a while (and in years if you exclude January bumps). Not the direction the Federal Reserve wants to see as the labor market is quickly slowing since Liberation Day. /2
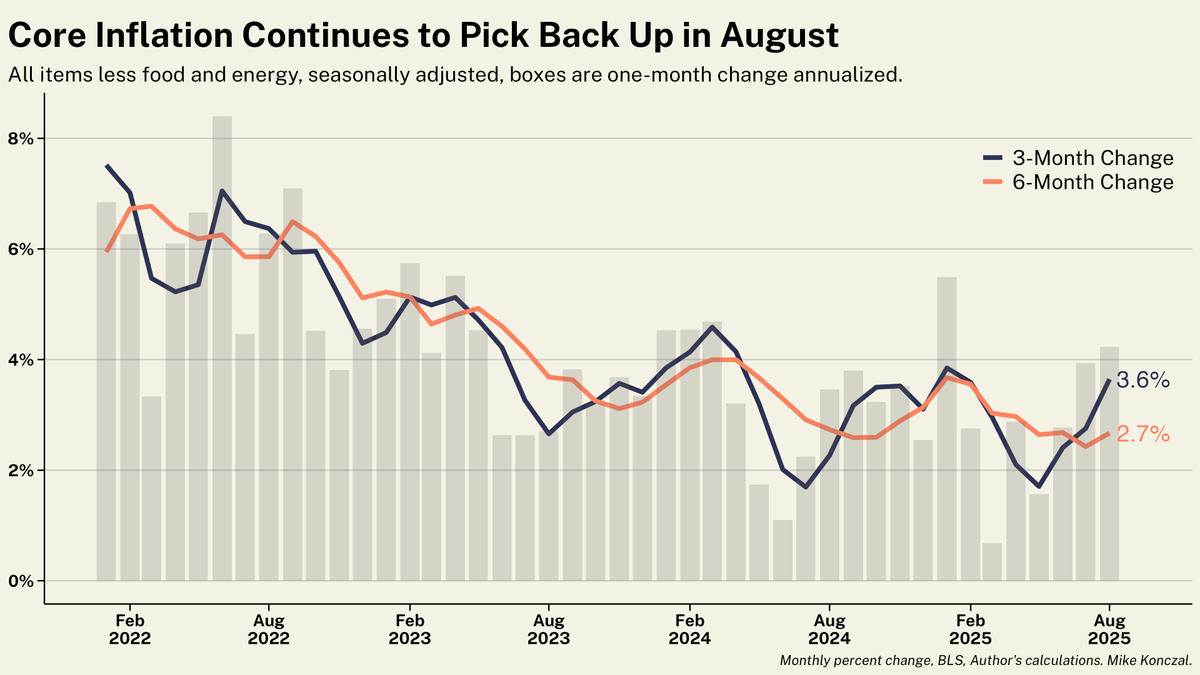
 They just narrowly dodged a 4.3% unemployment rate last month and got it this month, but these aren't rounding games. You can see a steady increase over the last two months.
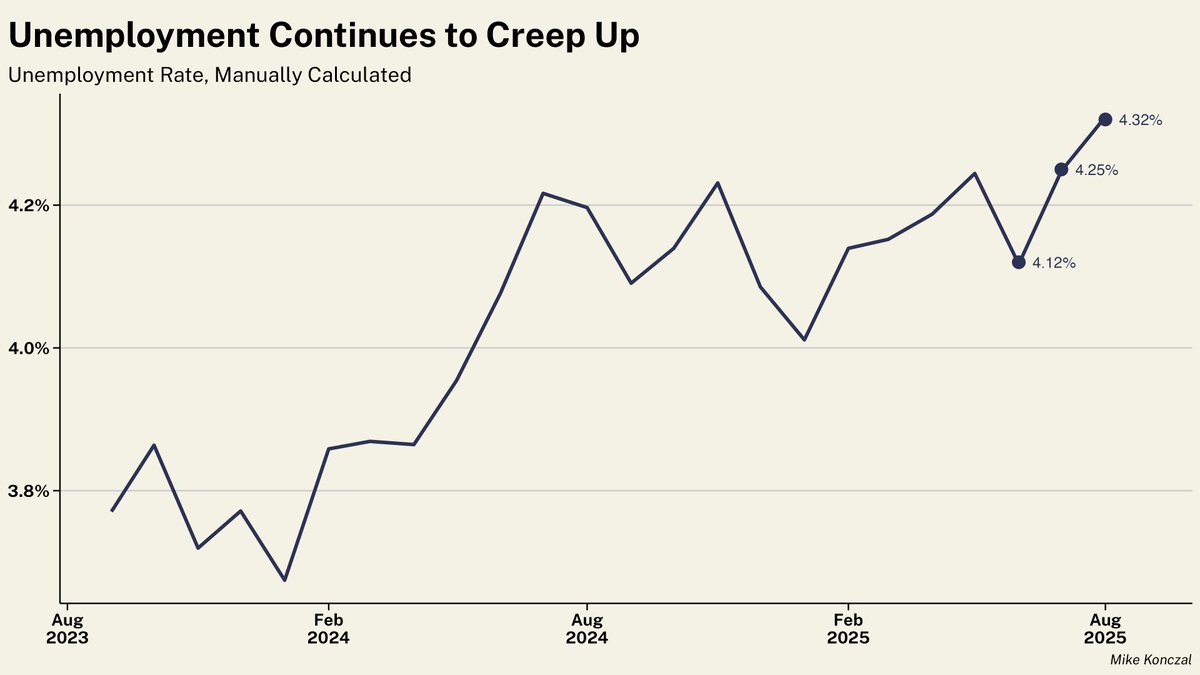
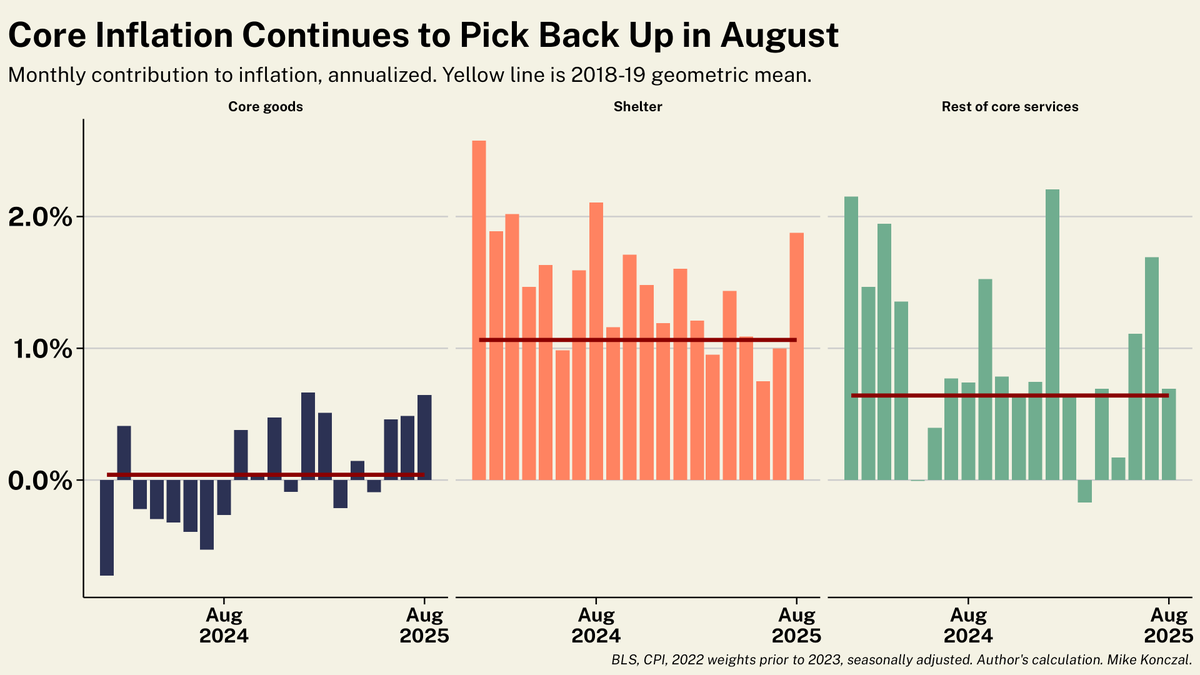
 Here's core broken down by goods, shelter, and services. Goods prices are increasing from a negative trend, as expected from tariffs.
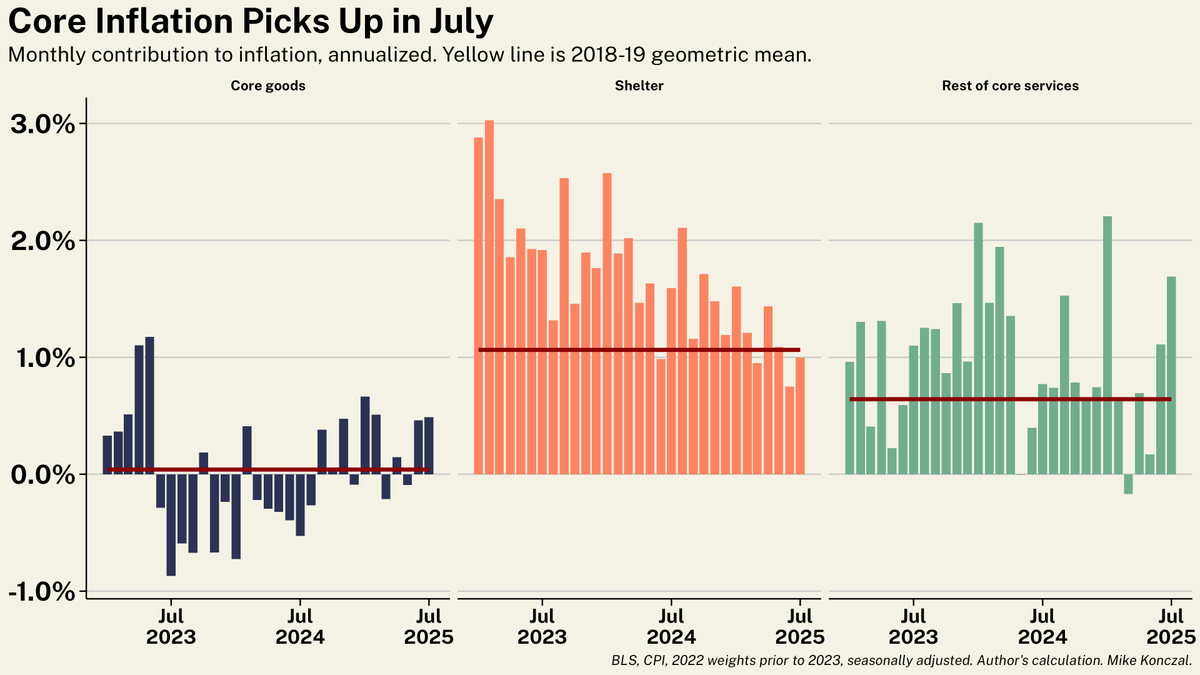
 Or consider the last decade. Essentially zero pre-covid.
 First: revisions. Negative revisions naturally occur at the end of recoveries/economic turning points from complexities of estimating business births, deaths, and seasonal adjusts.
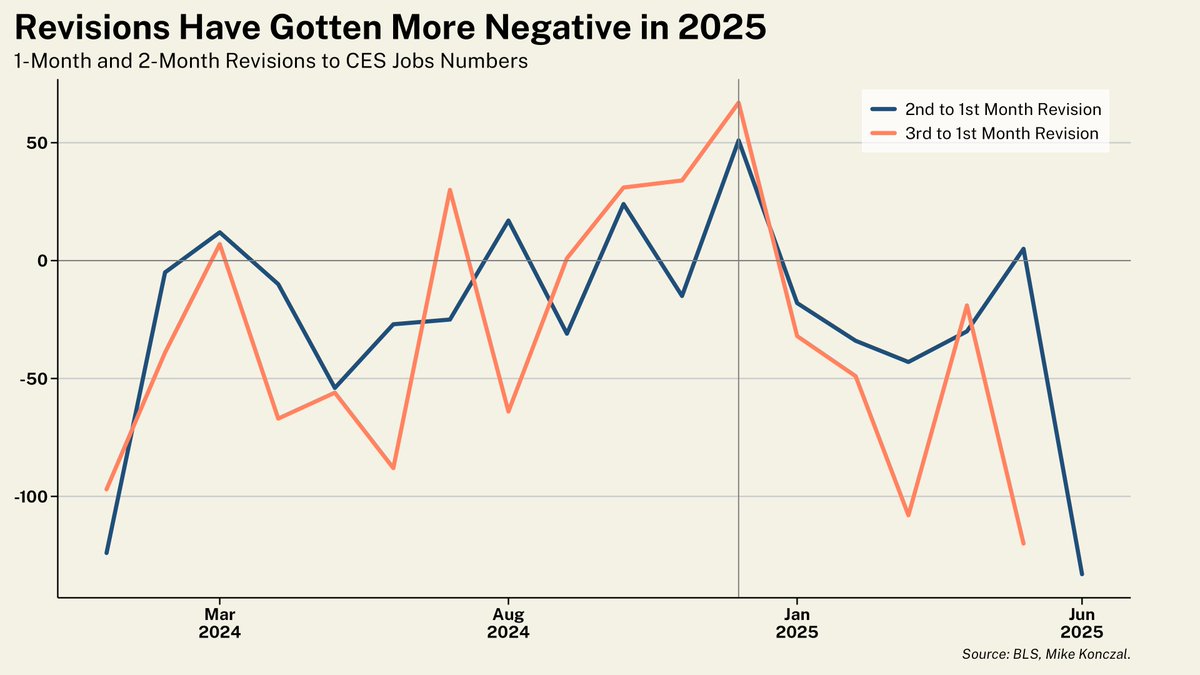
 You can see this in the components of GDP, where investment (driven by inventories) and net exports are doing wild, probably historically unique, things.
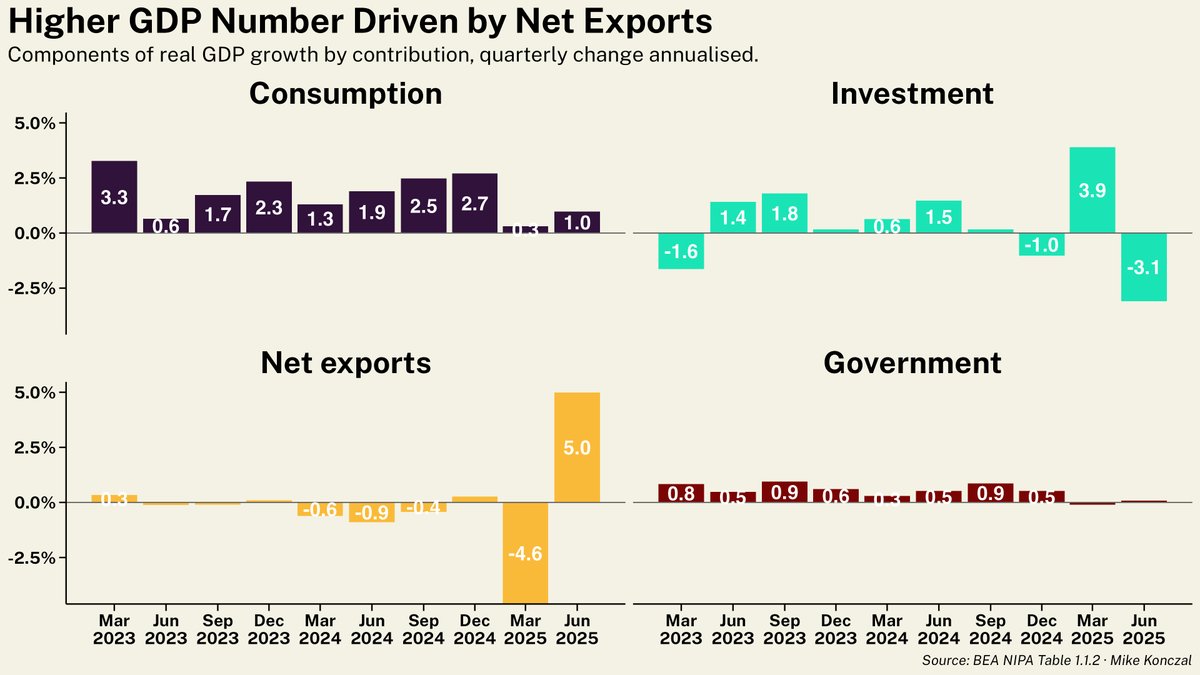
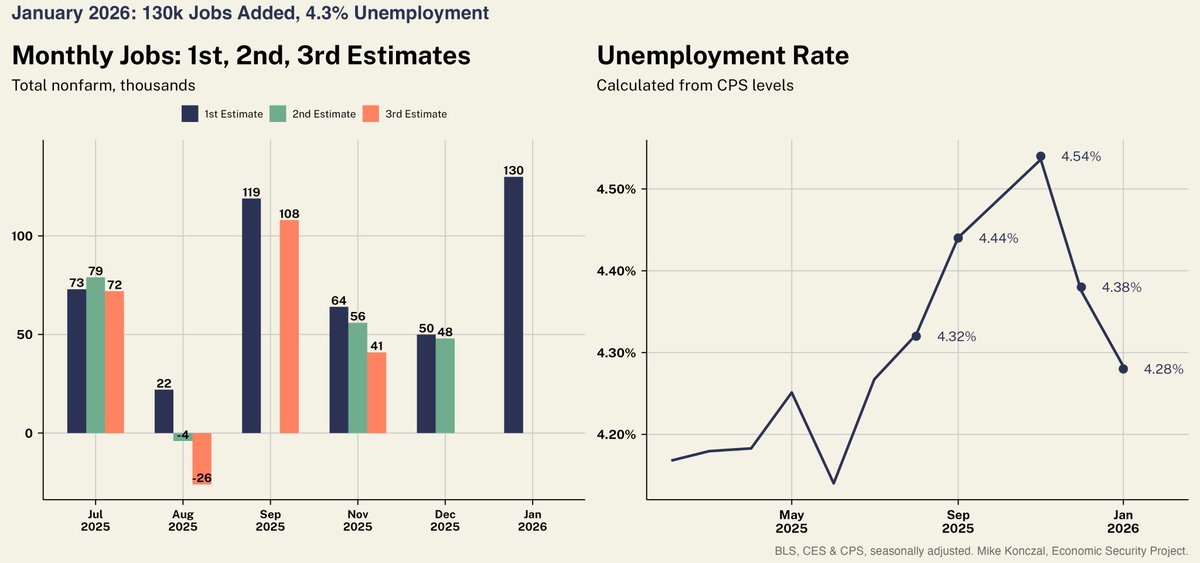
 The rounding gods were kind this month, with unemployment ticking up to 4.24 percent. You can see the slow increase over the past few months.
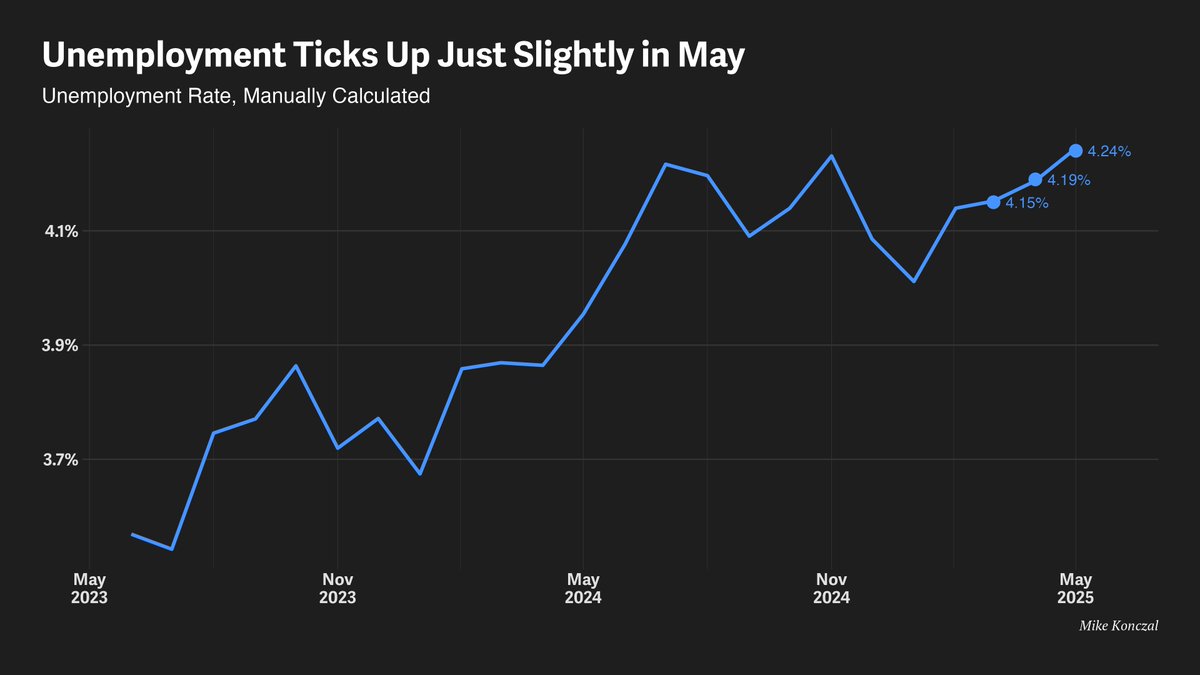
 Link here, which builds off the recent manufacturing jobs polling and then NEC director Gary Cohn's 2018 (incorrect) dive into JOLTS data.
 If the concern is in (wage-inertial?) services, hires and quits levels are also below there, and have been falling consistently.
 Last mile: weighted contribution to overall inflation by major categories over past 6 months.

 That model isn’t ideal - there’s no long-term costs to recessions - but it gives a sense. And given that we didn’t force a recession in response to reopening while long-term inflation expectations remained anchored, the choice looks like the right one. /2
 Big story is leveling out of core CPI inflation over the past 5 months in the low 3 percent range. I'm curious how next month's retroactive seasonal adjustment impacts this, and throughout the past years we've seen these leveling out then down shifts during the disinflation. /2
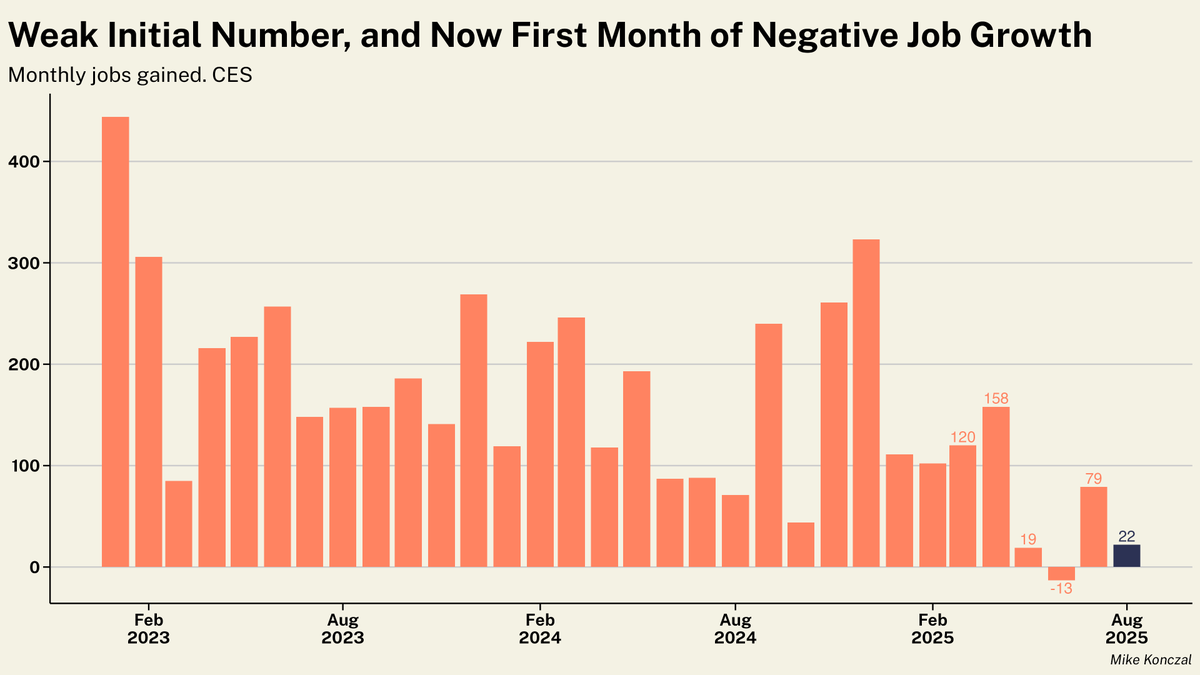
 You can see job numbers having more variance over the past six months, especially coming off the big job growth the past two years. That means we should be more careful not to read too much into any one month.
 But but but....job openings!


 I still automate this graphic but took it out of active circulation, but it is worth sharing. We focus on 3-, 6-, and 12- month changes for good reasons, the monthly data is noisy.
 Wage growth is in line with what we'd want for lower inflation. Nobody should reevaluate anything based on one month; over the last several we're seeing a slow deceleration consistent with other labor market indicators. /2
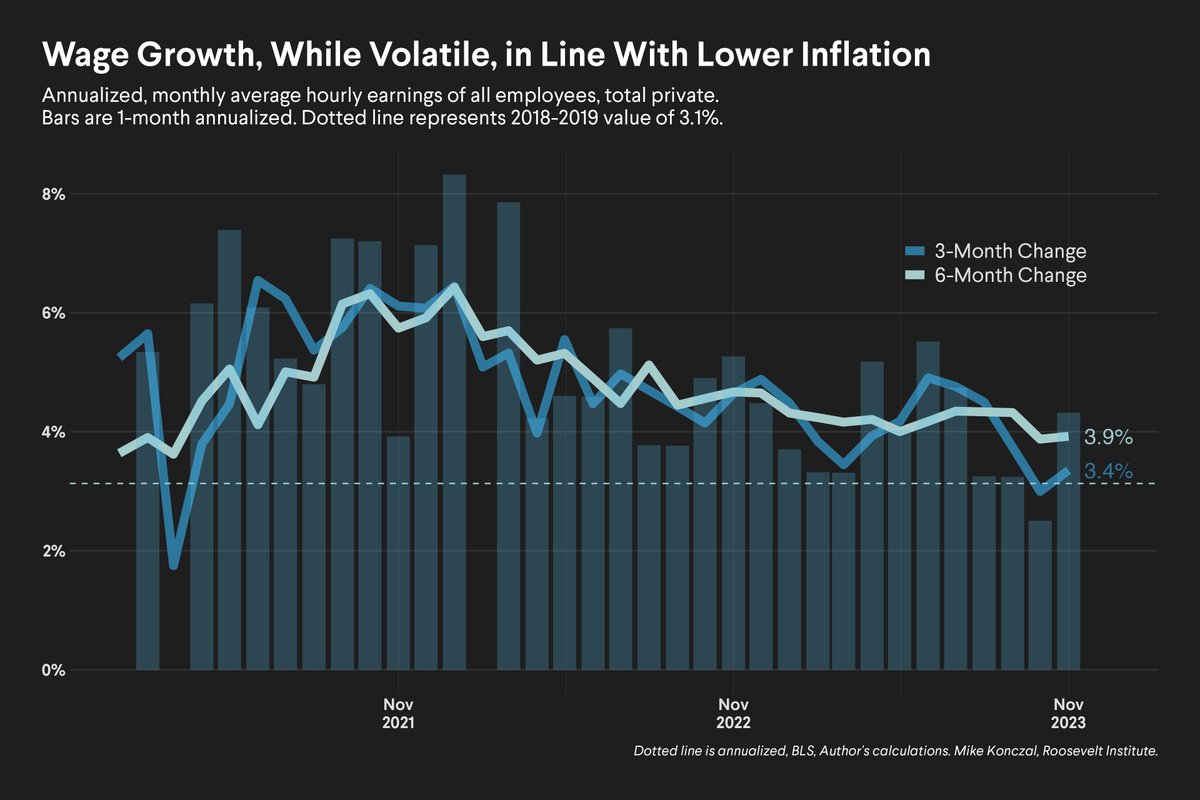
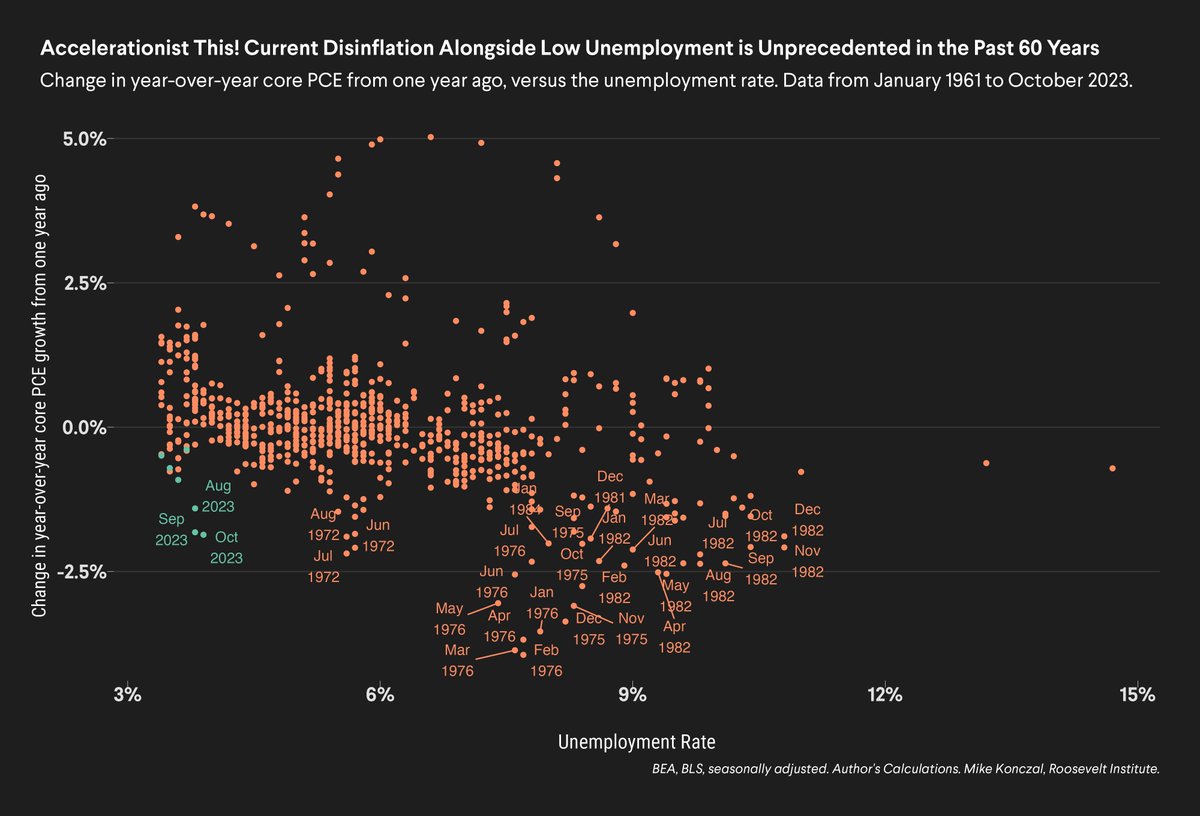 Look at it again, just with values less than 0, so deceleration in year-over-year change.