E.J. Antoni, Ph.D. Profile picture
Oct 6, 2023 10 tweets 4 min read Read on X
Latest Jobs Report looks good w/ headline numbers blowing away expectations, but the devil is in the details - here's a plain-English thread on why this is a very troubling report🧵... Image
First the headlines:
Sep nonfarm payrolls jump 336k; Unemployment rate flat at 3.8%; Labor force participation rate remains depressed at 62.8%; Those not in the labor force rose to roughly 5 million more than pre-pandemic - this is artificially pushing down unemployment rate: Image
There are various ways to account for the people missing from the labor force (4.5-5.4 million) and doing so yields an unemployment rate between 6.3 and 6.8% Image
Where were the jobs added in Sep? 22% came from government - an unsustainable increase; remember that private sector workers have to support those public sector jobs: Image
What kinds of jobs were added? Entirely part-time (+151k); in fact, we LOST full-time jobs (-22k); last 3 months have seen part-time jump 1.2 million while full-time fell 700k (most since lockdowns); double counting of multiple jobholders (123k) was 37% of job gains... Image
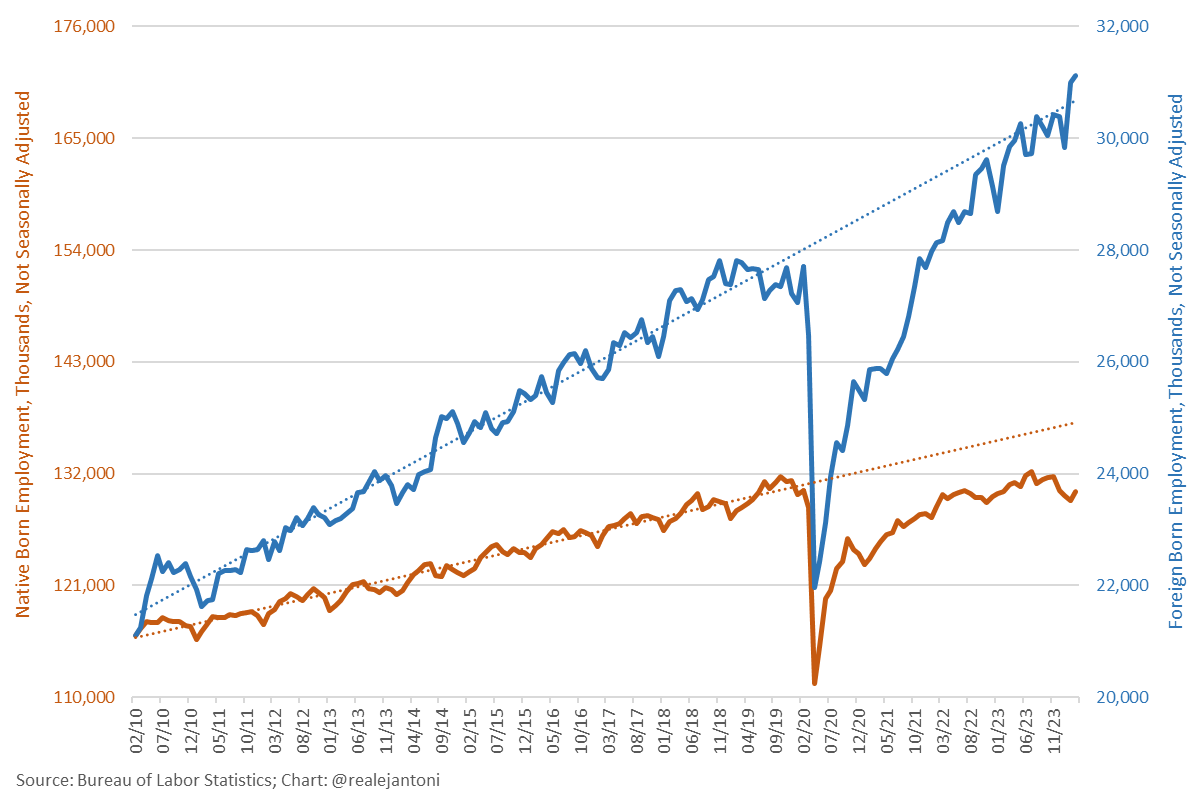
Who has the jobs? Let's break it down a few ways; first, foreign-born workers are already back to pre-pandemic trend while native-born workers have never recovered; since Mar '22, jobs disproportionately went to the foreign born, which brings up another important point... Image
Something broke in the labor market in Mar '22; the household and establishment surveys began to diverge and full-time job gains slowed dramatically; this continues today as nonfarm payrolls (establishment) jumped 336k in Sep, employment level (household) only rose 86k:
Image
Image
But back to who has the jobs, it's college grads, in spades: unemployment rate 2.1%, employment level 63 million (inline w/ pre-pandemic trend), emp-to-pop ratio 71.9%, and their earnings are outpacing inflation - why would you give this group a student loan bailout? Image
Lastly, the loss of full-time jobs and their replacement w/ part-time work is helping slow wage growth, which is then negative after adjusting for inflation - real weekly earnings fell dramatically until Jun '22 and have moved sideways since: Image
TLDR: people supplementing incomes w/ part-time jobs are goosing the headline numbers while underlying economic fundamentals remain weak; people absent from workforce pushing down unemployment rate; earnings not keeping up with inflation; don't expect the job gains to last... Image

• • •

Missing some Tweet in this thread? You can try to force a refresh
 

Keep Current with E.J. Antoni, Ph.D.

E.J. Antoni, Ph.D. Profile picture

Stay in touch and get notified when new unrolls are available from this author!

Read all threads

This Thread may be Removed Anytime!

PDF

Twitter may remove this content at anytime! Save it as PDF for later use!

Try unrolling a thread yourself!

how to unroll video
  1. Follow @ThreadReaderApp to mention us!

  2. From a Twitter thread mention us with a keyword "unroll"
@threadreaderapp unroll

Practice here first or read more on our help page!

More from @RealEJAntoni

Apr 6
For convenience, here's all the info on the Mar jobs report in a single thread - sorry to be the bearer of bad news, especially regarding American citizens losing so much ground in this economy... Image
The headline numbers once again look good w/ over 300k payrolls added and the employment number from the household survey rising even faster, but what kinds of jobs are being created? Turns out they're all part-time: Image
And this isn't new - it's a continuation of a long trend: full-time employment is lower today than Feb '23 w/ all of the net job creation since then being part-time work: Image
Read 18 tweets
Feb 13
Here's the CPI🧵 on today's dumpster fire of a report - hint: inflation isn't dead, you're $6,800 poorer b/c of it, and it's poised to get much worse next year... Image
First, the headlines:
CPI rose 0.3% M/M, 3.1% Y/Y
Core (ex- food and energy) rose 0.4% M/M, 3.9% Y/Y
Team Transitory™️ has egg on their face for the thousandth time: we haven't been trending toward 2% but 3% - we're there and there's no indication we're going lower: Image
Consumer staples have gone through the roof since Jan '21 - here's the basic energy components, all up 20% or more: Image
Read 13 tweets
Feb 2
Jan jobs report🧵- here's what you need to know that the talking heads and gov't statisticians won't tell you, including why the real unemployment rate is btwn 6.3% and 7.4%... Image
First the headlines:
Nonfarm payrolls rose 353k last month
Unemployment rate steady at 3.7% (more on that later)
Note that updates to the BLS' data make it difficult to compare Jan '24 to prior months, so this monthly change needs an important qualifier...
In brief, things once again look good b/c prior periods were revised down; the new seasonal adjustments and other changes reduced the number of payrolls in every month last year except Dec; cumulative monthly difference is -1.3 million w/ average monthly difference -126k... Image
Read 14 tweets
Jan 11
Dec CPI 🧵...
Inflation rips the stake out of its chest, looses a blood-chilling scream, and tells the Fed it's ready for another round; real weekly earnings are down 4.5% since Jan '21 and things are poised to get worse... Image
First, the headlines:
CPI up 0.3% M/M and 3.4% Y/Y
Core CPI (excludes volatile food & energy) up 0.3% M/M and 3.9% Y/Y
For all the talk of "disinflation," no one seems to have been paying attention to the trend that clearly shows us approaching 3%+ and not the 2% target... Image
Have to briefly mention health insurance, which I did a deep dive on previously; flawed methodology at BLS erroneously drove the index down for whole year, and now it's payback time, w/ index set to regain that ground in the months to come; up 1.1% M/M, down 27.1% Y/Y... Image
Read 13 tweets
Jan 5
Dec jobs report 🧵: there's SO much bad news under the hood of this report, including the economy shedding 1.5 million full-time jobs in a single month, big downward revisions, and a true unemployment rate between 6.4% and 7.5% - here's the truth you should know... Image
First, the headlines: nonfarm payrolls rose 216k on the backs of big downward revisions to previous months and unemployment rate remained unchanged at 3.7% - let's delve into why that rate is so low (hint: 676k people left the labor force in Dec)... Image
LFPR fell hard in Dec, closing the year well below pre-pandemic levels - this is artificially lowering the unemployment rate... Image
Read 18 tweets
Dec 8, 2023
Another round of very mixed data, but in line w/ recession early next year - here's a plan English, deep dive 🧵 on the Nov jobs report, including why the unemployment rate is much higher than the official number: Image
First, headlines: nonfarm payrolls up 199k, as jobs "increased in manufacturing, reflecting
the return of workers from a strike" exactly as expected; unemployment rate down to 3.7% amid surge in household survey employment (seasonal adj problem?)...
Downward revisions to previous data continue w/ Sep's last estimate unsurprisingly revised lower; 1/5 of all jobs initial added this year have been revised away: Image
Read 18 tweets

Did Thread Reader help you today?

Support us! We are indie developers!


This site is made by just two indie developers on a laptop doing marketing, support and development! Read more about the story.

Become a Premium Member ($3/month or $30/year) and get exclusive features!

Become Premium

Don't want to be a Premium member but still want to support us?

Make a small donation by buying us coffee ($5) or help with server cost ($10)

Donate via Paypal

Or Donate anonymously using crypto!

Ethereum

0xfe58350B80634f60Fa6Dc149a72b4DFbc17D341E copy

Bitcoin

3ATGMxNzCUFzxpMCHL5sWSt4DVtS8UqXpi copy

Thank you for your support!

Follow Us!

:(