Wage growth is dropping fast. Down to 3.9% YoY for American Workers. 📉
That is now the lowest rate of wage growth since the pandemic started. And also below the 60-year average.
Bad news for US Economy & Housing Market. ❌
That is now the lowest rate of wage growth since the pandemic started. And also below the 60-year average.
Bad news for US Economy & Housing Market. ❌

1) If wage growth continues dropping, Americans won't have any hope of "catching up" to how expensive everything has become.
Whether it's home prices, rent, food, or gas.
And they will be forced to cut back spending.
Whether it's home prices, rent, food, or gas.
And they will be forced to cut back spending.
2) To understand this reality, look at the Personal Savings Rate in America.
Right now the average American is only saving 3.9% of their paycheck each month.
Close to the lowest level on record.
Right now the average American is only saving 3.9% of their paycheck each month.
Close to the lowest level on record.

3) Suggesting that consumer's ability to keep the economy afloat is on fragile footing.
Propped by some excess savings from 2020-21. To go along with credit card usage.
But ultimately a 3.9% savings rate isn't sustainable. The last time it was this low was 2006-07.
Propped by some excess savings from 2020-21. To go along with credit card usage.
But ultimately a 3.9% savings rate isn't sustainable. The last time it was this low was 2006-07.
4) And we all know what happened after 2006-07.
The economy crashed.
But more specifically - prices across the economy went down to a level that more closely aligned with people's incomes and wages.
Allowing the savings rate to rise to a more normal level.
The economy crashed.
But more specifically - prices across the economy went down to a level that more closely aligned with people's incomes and wages.
Allowing the savings rate to rise to a more normal level.
5) This happened in the real estate sector very obviously.
Where the Home Price / Income Ratio plunged 4.3x in 2006 down to 3.2x in 2012. A more normal level historically.
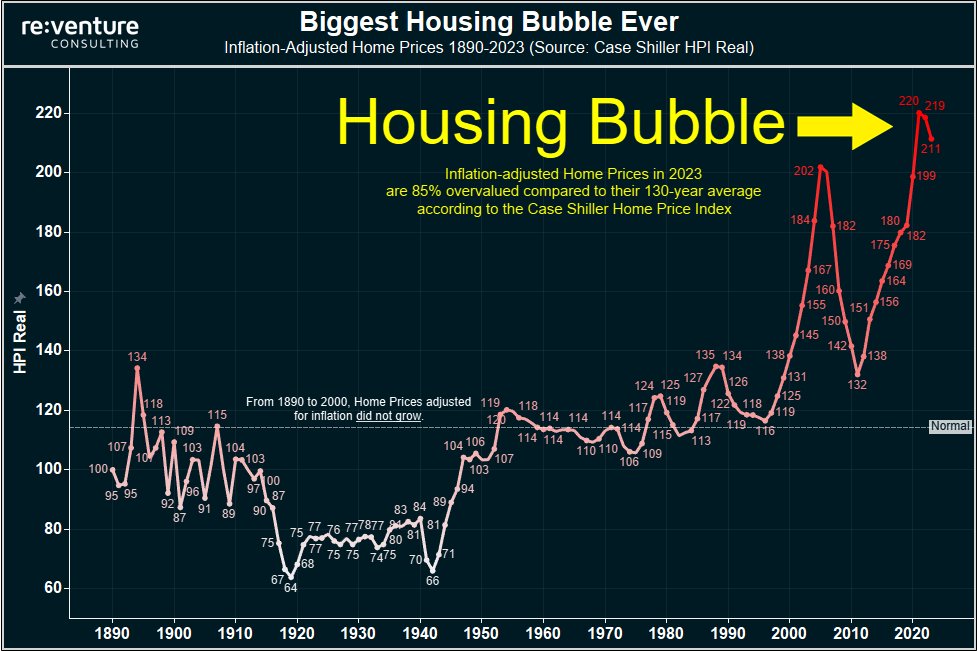
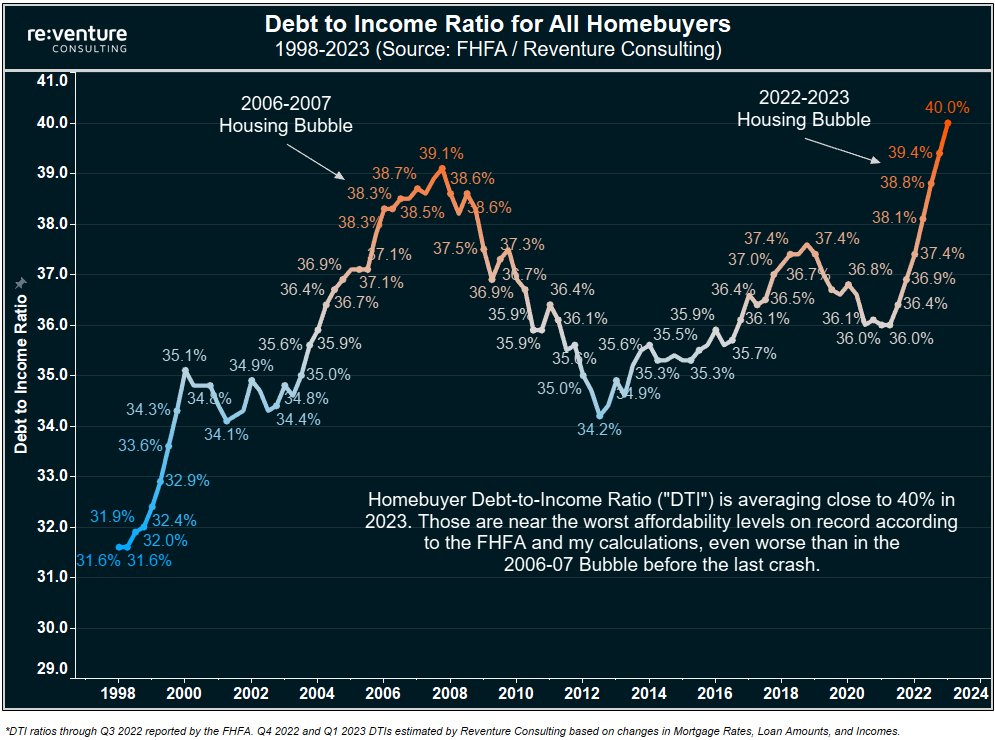
But fast forward to today and Home / Price Income is back to an all-time, unsustainable high.
Where the Home Price / Income Ratio plunged 4.3x in 2006 down to 3.2x in 2012. A more normal level historically.
But fast forward to today and Home / Price Income is back to an all-time, unsustainable high.

6) Now home prices crashing is one way the Housing Bubble can be cured.
But another way is for Incomes to rise. 📈
Like what happened in the 1950s/60s. Wage growth surged and that made the housing market more affordable, preventing a crash.
But another way is for Incomes to rise. 📈
Like what happened in the 1950s/60s. Wage growth surged and that made the housing market more affordable, preventing a crash.

7) But that's not happening right now.
Wage growth is dropping hard. Likely due to an influx of labor, automation, and of course the Fed removing money supply from the system.
And so if wages/incomes don't grow meaningfully, there is only one way for home prices to go. 📉
Wage growth is dropping hard. Likely due to an influx of labor, automation, and of course the Fed removing money supply from the system.
And so if wages/incomes don't grow meaningfully, there is only one way for home prices to go. 📉
8) So if you're a Housing Market watcher, I'd encourage you to focus on the Wage Growth portion of the BLS Jobs Report.
Everyone else focuses on job #. But that doesn't matter much for home prices.
Wage growth is what does. And it is trending in the wrong direction.
Everyone else focuses on job #. But that doesn't matter much for home prices.
Wage growth is what does. And it is trending in the wrong direction.

9) Also - side comment about the 1970s. The decade of great inflation where home prices exploded.
Why did home prices explode in the 1970s?
Wage Growth.
It averaged 7-9%/year for a decade. When wages grow that much, home prices will grow that much.
Why did home prices explode in the 1970s?
Wage Growth.
It averaged 7-9%/year for a decade. When wages grow that much, home prices will grow that much.
10) Also note that in the 1970s Americans were saving over 10% of their income each month.
Meaning that even though inflation was bad, their wages were growing enough to keep a good savings level.
So different from today. Where Savings is sub-4.0%
Meaning that even though inflation was bad, their wages were growing enough to keep a good savings level.
So different from today. Where Savings is sub-4.0%

11) For those interested in the sources of this post:
Wage Growth was calculated as the trailing 3-month average of weekly earnings (hourly wage x hours worked) for non-supervisory workers.
You can find those data sets here:
fred.stlouisfed.org/series/AHETPI
fred.stlouisfed.org/series/AWHNONAG
Wage Growth was calculated as the trailing 3-month average of weekly earnings (hourly wage x hours worked) for non-supervisory workers.
You can find those data sets here:
fred.stlouisfed.org/series/AHETPI
fred.stlouisfed.org/series/AWHNONAG
• • •
Missing some Tweet in this thread? You can try to
force a refresh

 Read on Twitter


