This is so crazy.
The Northern Hemisphere used to radiate more heat to space than it absorbed from the sun.
The difference was made up for by heat transported north from the Southern Hemisphere through (mainly the Atlantic) oceans and atmosphere.
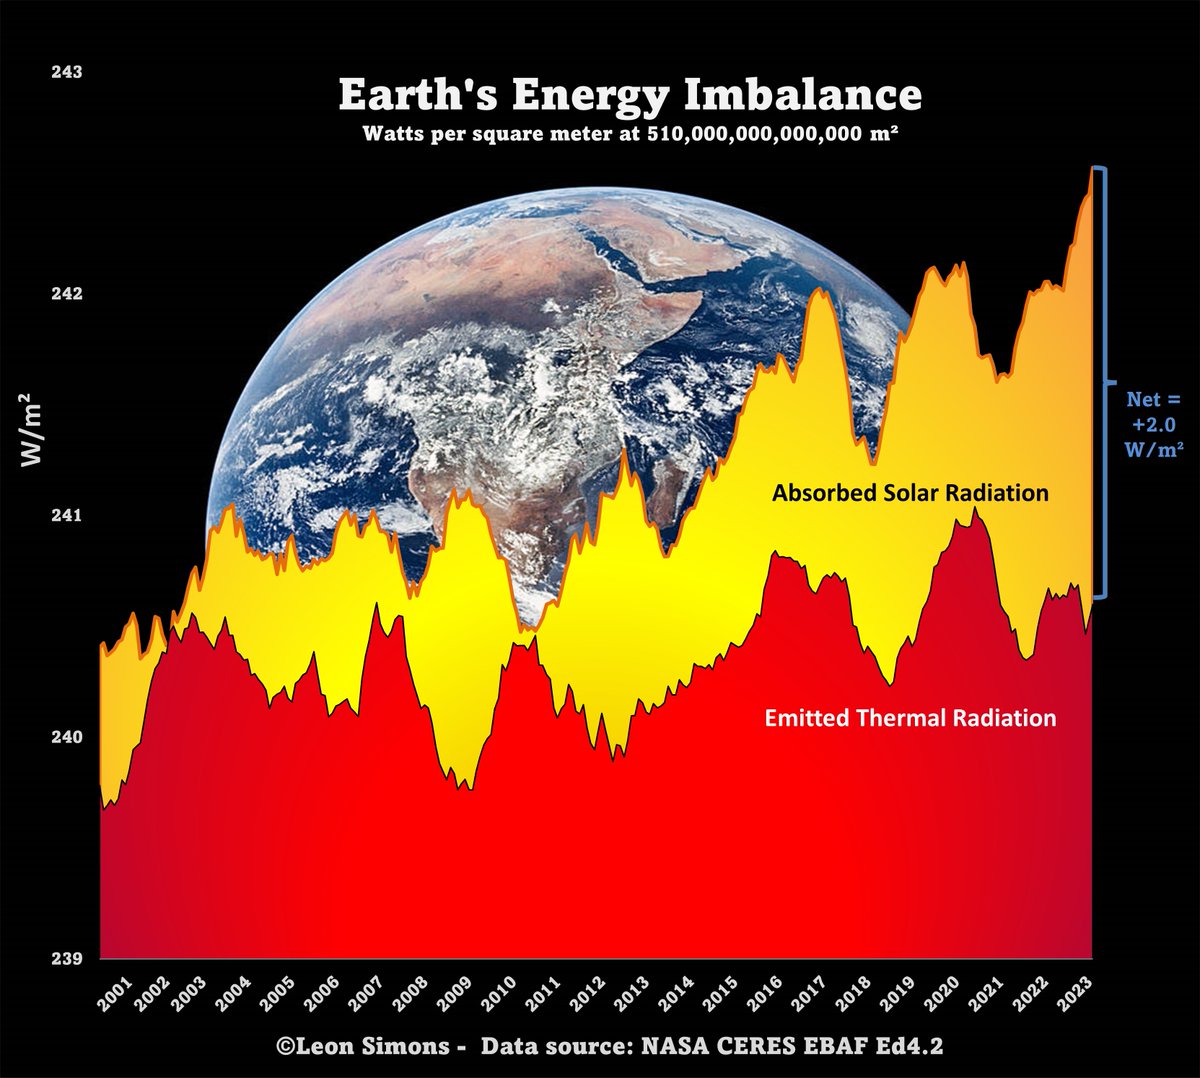
Around 2014 the amount of Absorbed Solar Radiation started to rapidly increase, surpassing Outgoing Longwave (Thermal or IR) Radiation to space, leading to a positive Energy Imbalance of the Northern Hemisphere!
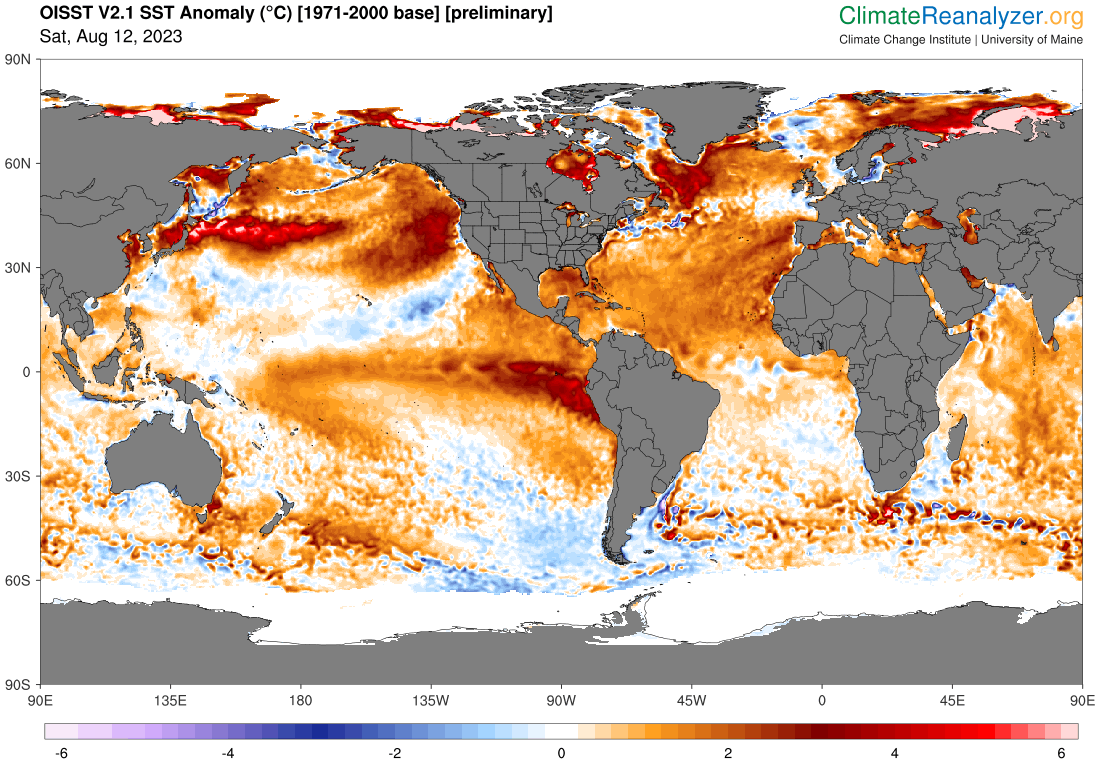
So more heat was absorbed from the sun than radiated to space, possibly also reducing heat transported from the Southern to the Northern Hemisphere and leaving more to e.g. melt Antarctic Sea ice.
In recent years this energy imbalance has been increasing further, as air pollution and cloud cover decreased, and the amount of sunlight reflected back to space decreased.
And because outgoing heat radiation was not increasing (as much).
The balance can be restored (or made negative again) in two ways:
1⃣ Increasing Outgoing Longwave Radiation.
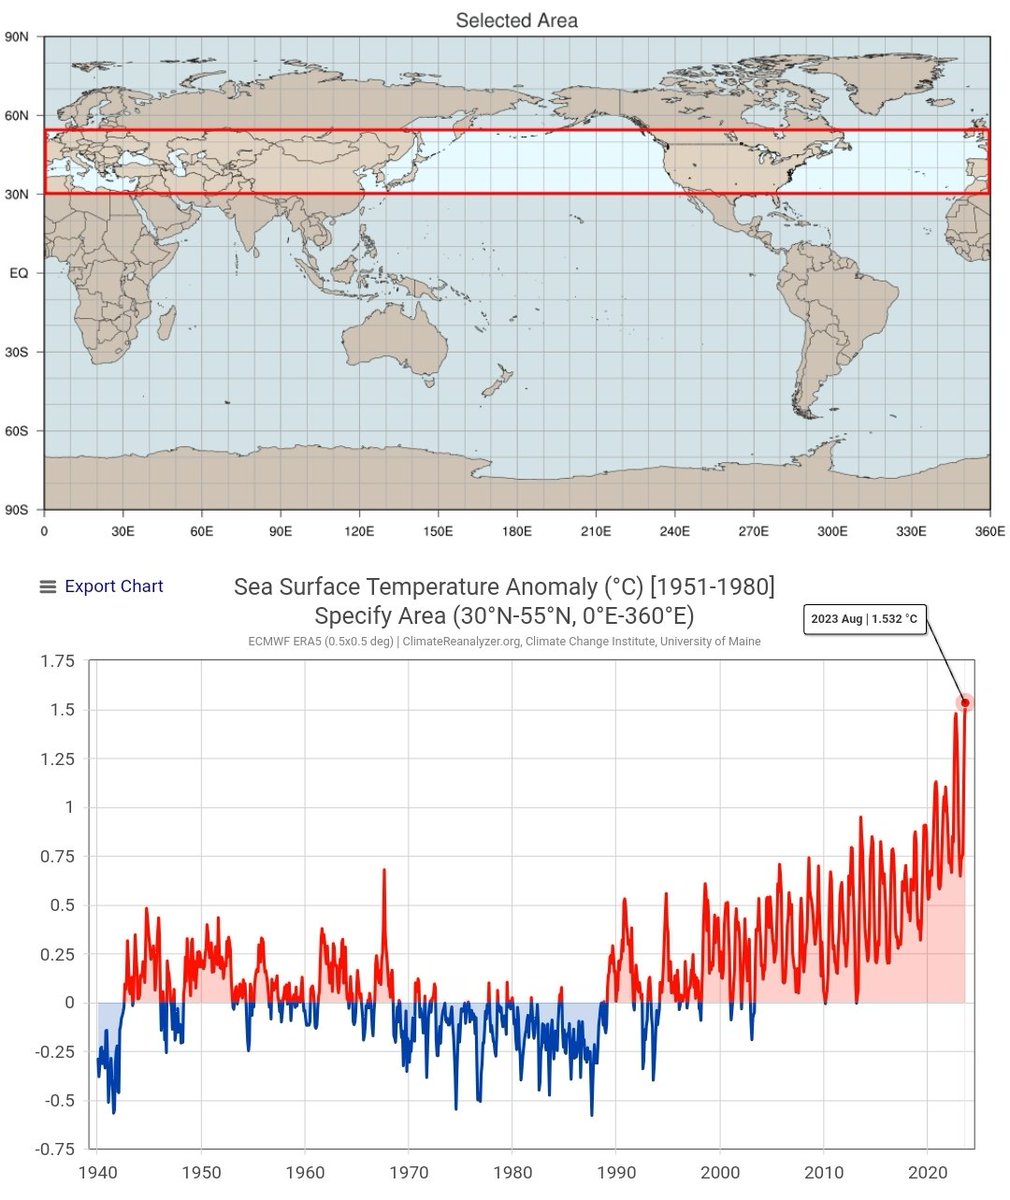
For that temperatures of the Northern Hemisphere need to increase, which is happening at the moment.
2⃣ Increasing air pollution and cloud cover to reflect more sunlight to space.
Neither of these are policy recommendations.
We are between a rock and a hard place.
People need to be aware of the situation.

The Northern Hemisphere used to radiate more heat to space than it absorbed from the sun.
The difference was made up for by heat transported north from the Southern Hemisphere through (mainly the Atlantic) oceans and atmosphere.
Around 2014 the amount of Absorbed Solar Radiation started to rapidly increase, surpassing Outgoing Longwave (Thermal or IR) Radiation to space, leading to a positive Energy Imbalance of the Northern Hemisphere!
So more heat was absorbed from the sun than radiated to space, possibly also reducing heat transported from the Southern to the Northern Hemisphere and leaving more to e.g. melt Antarctic Sea ice.
In recent years this energy imbalance has been increasing further, as air pollution and cloud cover decreased, and the amount of sunlight reflected back to space decreased.
And because outgoing heat radiation was not increasing (as much).
The balance can be restored (or made negative again) in two ways:
1⃣ Increasing Outgoing Longwave Radiation.
For that temperatures of the Northern Hemisphere need to increase, which is happening at the moment.
2⃣ Increasing air pollution and cloud cover to reflect more sunlight to space.
Neither of these are policy recommendations.
We are between a rock and a hard place.
People need to be aware of the situation.

See this thread for more on the interhemispheric energy imbalance and meridional (south to north) heat transport:
https://twitter.com/LeonSimons8/status/1683855710314979332?t=hu_Mf6aJBPTNpRCTwAS2xA&s=19
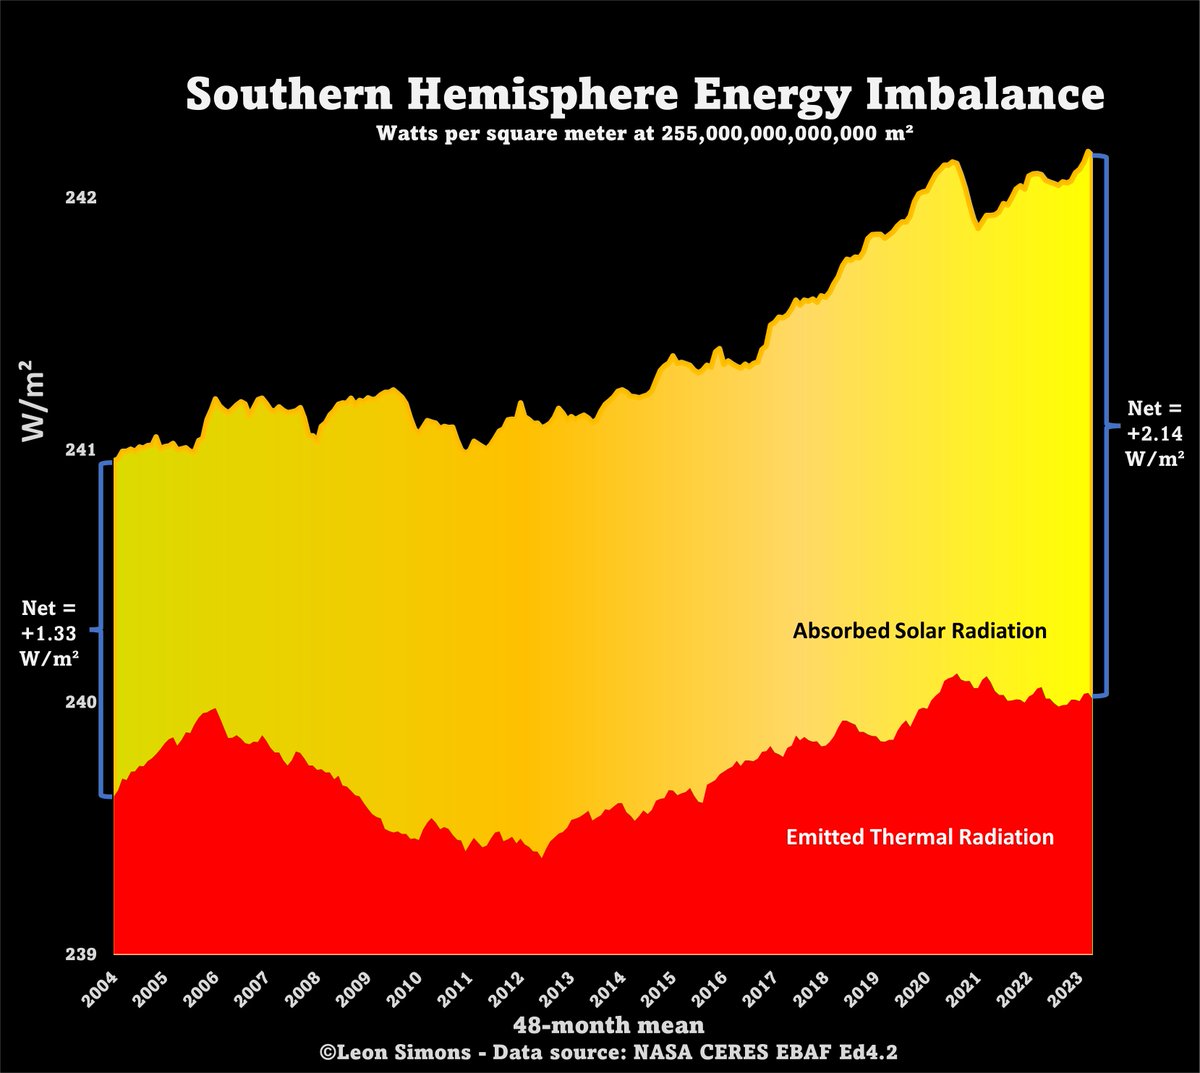
Also see the 48-month running mean of the Southern Hemisphere (note larger y-axis scale).
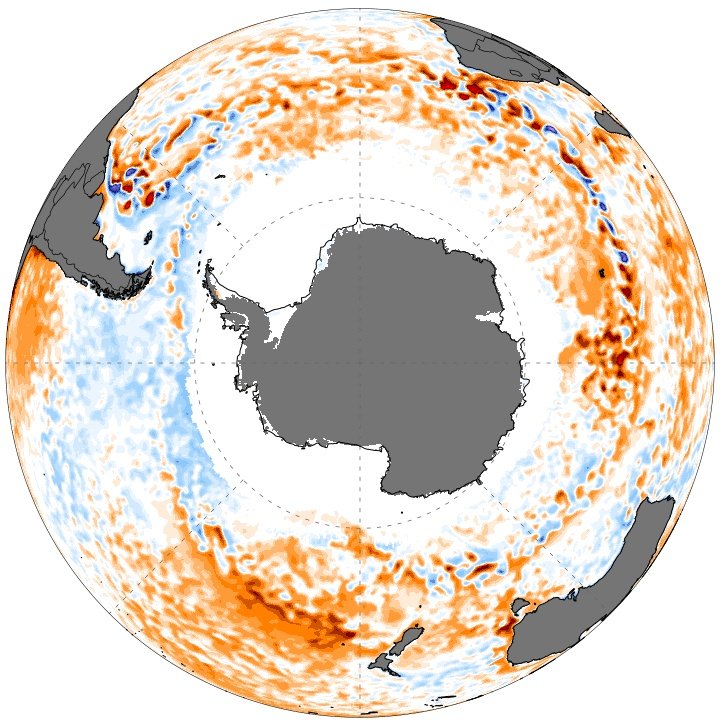
This looks very different. The Southern Hemisphere already had a positive (net heat adding) Energy Imbalance, which increased in recent years, as Antarctic sea-ice started to decline, reflecting less sunlight back to space.
As there is less human activity on the Southern Hemisphere (7 of the 8 billion people live north of the equator), aerosol emission changes matter much less here.
The Southern Hemisphere net imbalance increased by ~0.8 W/m² over 20 years, while the Northern Hemisphere increased by about 1.1 W/m²
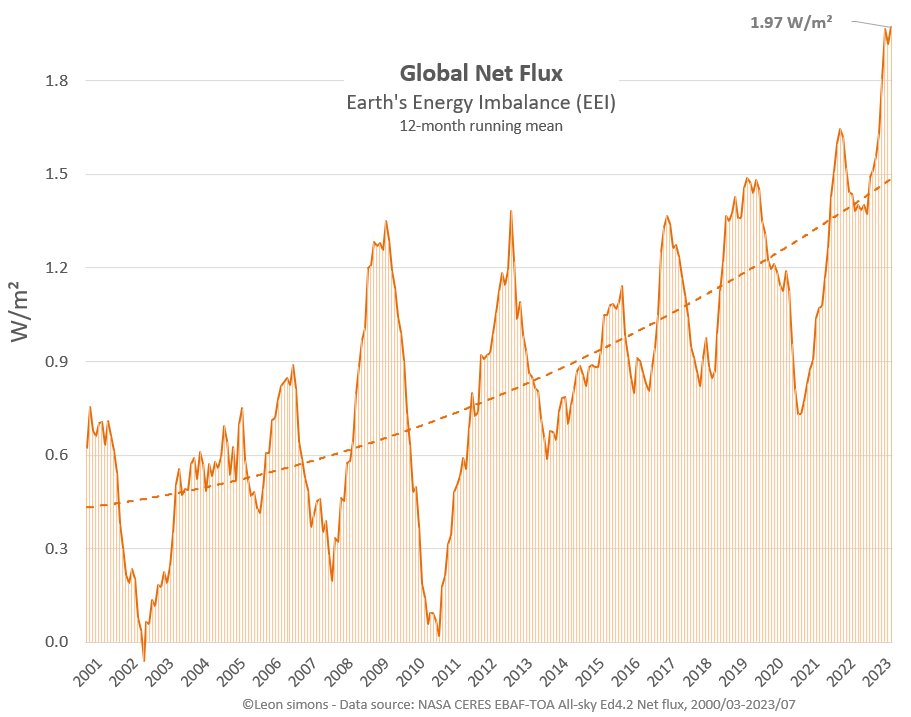
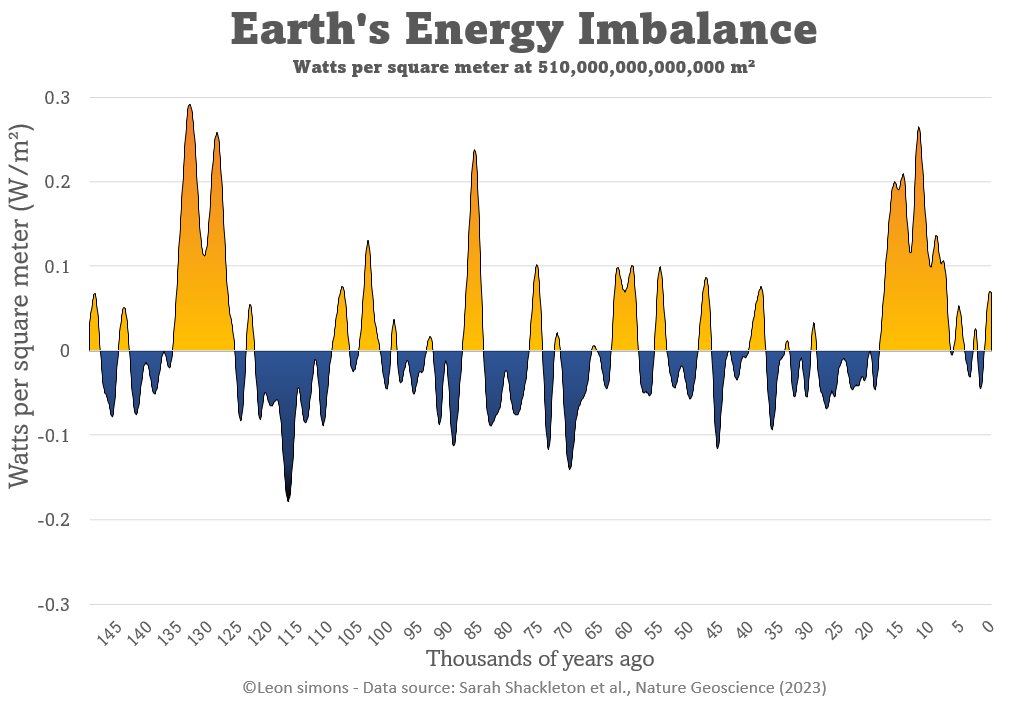
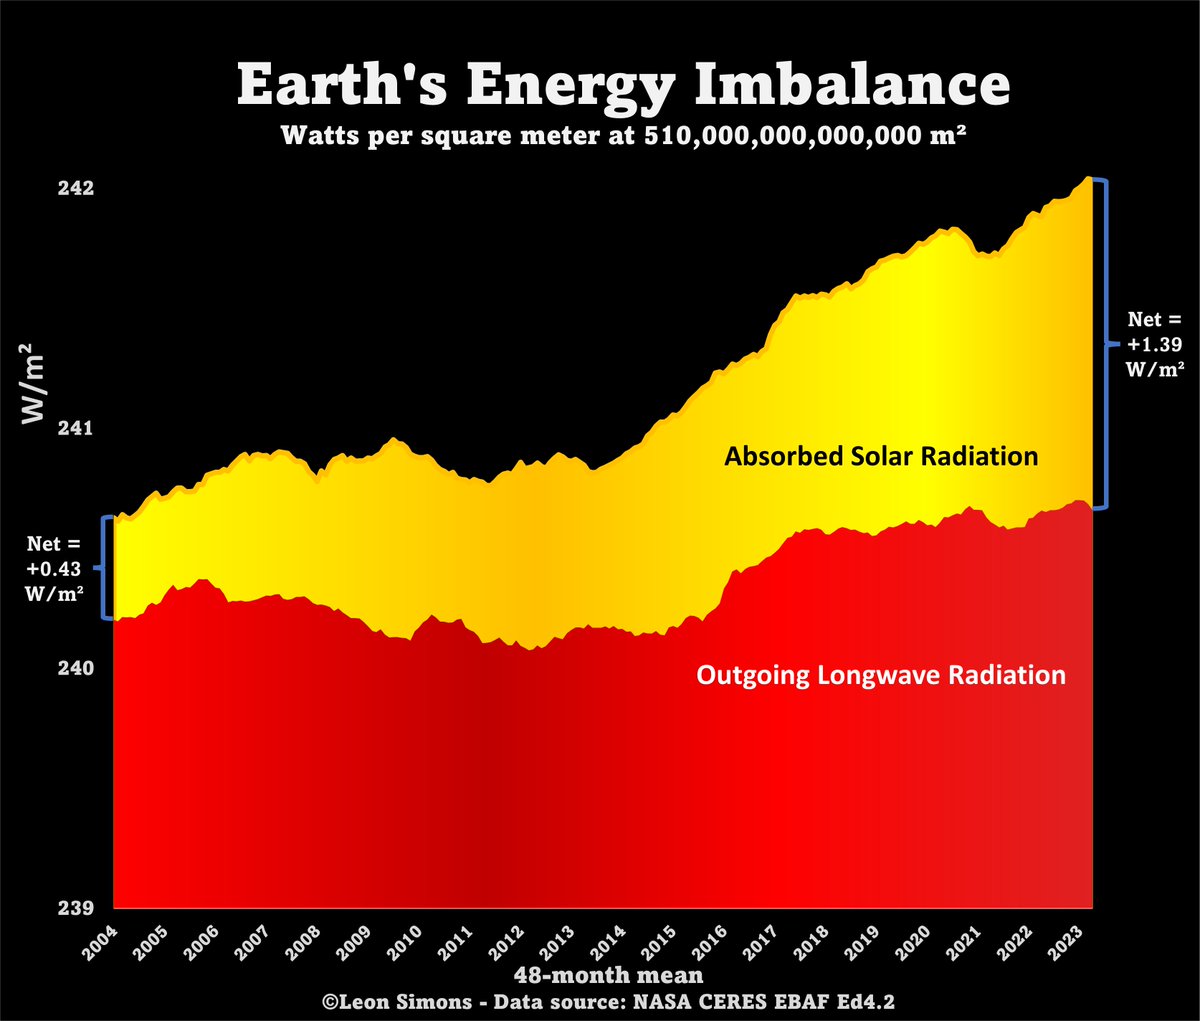
Together, this results in the Earth's Energy Imbalance, which increased by almost 1 W/m²:
Before the deniers find this thread, it's not (just) the sun:
https://twitter.com/LeonSimons8/status/1686752199852879873?t=XJjcYnzMFvfuN7jMcHLRBA&s=19
• • •
Missing some Tweet in this thread? You can try to
force a refresh