
Our new article is out documenting the burden of the #pandemic on food service workers.
What it boils down to is fighting an #AIRBORNE virus with droplet dogma.
I will walk you through some of the more shocking highlights.
1/
🧵
What it boils down to is fighting an #AIRBORNE virus with droplet dogma.
I will walk you through some of the more shocking highlights.
1/
🧵
During the BA.1 Omicron wave, for example, food service workers could often get free #HandSanitizer.
Yet, free high-quality masks (e.g., #N95) were hard to come by.
N95s prevent people from inhaling airborne virus into their lungs. Hand sanitizer does not.
2/
Yet, free high-quality masks (e.g., #N95) were hard to come by.
N95s prevent people from inhaling airborne virus into their lungs. Hand sanitizer does not.
2/

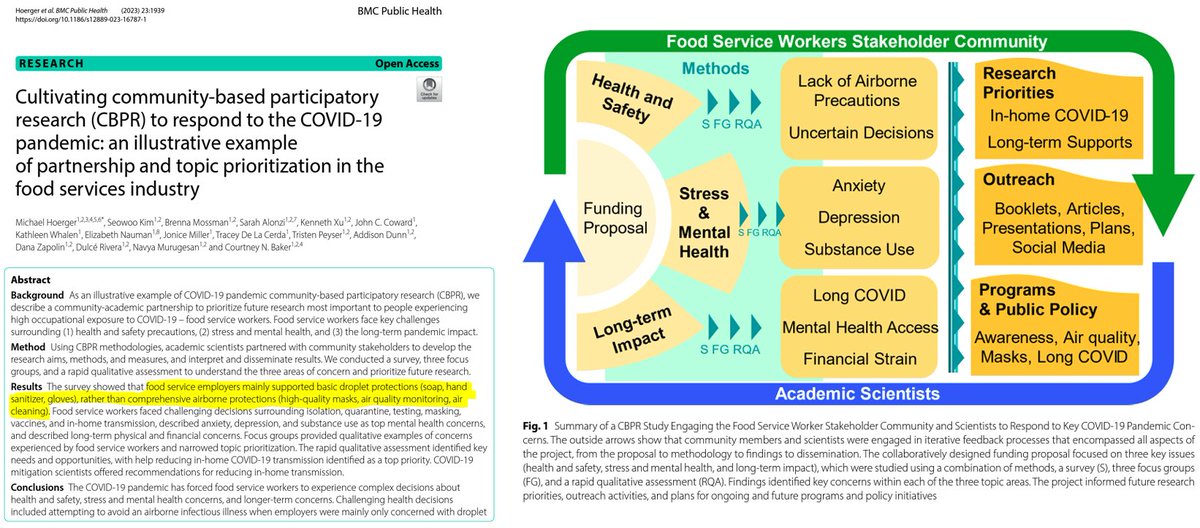
With a lack of #PublicHealth guidance, many in the food service industry have faced decision fatigue in handling C0VID-related issues.
Participants said co-workers struggle with what to do if sick (87%), when to return to work (83%), or whether to get a booster (61%).
3/
Participants said co-workers struggle with what to do if sick (87%), when to return to work (83%), or whether to get a booster (61%).
3/

Food service workers have expressed that C0VID has had a big impact on co-workers' #MentalHealth.
Anxiety, depression, and substance use lead the way. However, many respondents also noted a co-worker dealing with #bereavement, suicidal ideation, or violence (17-36%).
4/
Anxiety, depression, and substance use lead the way. However, many respondents also noted a co-worker dealing with #bereavement, suicidal ideation, or violence (17-36%).
4/

Shortly after the BA.1 Omicron surge, many in the food service industry were aware of a co-worker dealing with #LongCOVID.
"Fatigue" (often EXHAUSTION) led the way. Many knew a co-worker with prolonged loss of taste or smell, which are huge to that occupation.
5/
"Fatigue" (often EXHAUSTION) led the way. Many knew a co-worker with prolonged loss of taste or smell, which are huge to that occupation.
5/

In the more recent days of the pandemic, food service workers emphasized that a key priority was reducing in-home spread of C0VID.
Experts you know from Twitter provided their guidance on reducing in-home spread. Here's a link to another resource.
6/ cleanaircrew.org/someone-in-my-…
Experts you know from Twitter provided their guidance on reducing in-home spread. Here's a link to another resource.
6/ cleanaircrew.org/someone-in-my-…

When explaining to other scientists that #CovidIsAirborne, I have found it helpful to quote Jha.
7/
7/
https://twitter.com/michael_hoerger/status/1585345898733006848

Too often, restaurants continue to be superspreaders of C0VID and other airborne illnesses.
#ASHRAE indicates that they should be cleaning the air 28-40 times per hour. Instead, many are doing more like 0.8
8/
#ASHRAE indicates that they should be cleaning the air 28-40 times per hour. Instead, many are doing more like 0.8
8/
![The new standards indicate that restaurants and similar establishments should clean the air approximately 28–40 times per hour, depending on occupancy level (more precisely, 40 cubic feet per minute per person [cfm/person] or 20 L per second per person [l/s/person]) to reduce airborne illness transmission, approximately double the historic standard of 15 air changes per hour in U.S. operating rooms. To put in context, many restaurants, bars, and similar establishments clean the air 0.8 times per hour [43], 35–50 times lower than the current ASHRAE air cleaning standards.](https://pbs.twimg.com/media/F8Bwsr5WcAEkNbp.png)
In fact, we clean fish tanks better than we clean the air in many dangerous settings like restaurants.
@sri_srikrishna
9/
@sri_srikrishna
9/
![As the engineer Devabhaktuni Srikrishna frequently notes, even fish get 4–6 full water exchanges per hour in properly running fish tanks [44]. Essentially, food service venues are among the highest-risk settings and have the lowest mitigation. The ASHRAE standards are a firm indication of the occupational hazards of food service work.](https://pbs.twimg.com/media/F8BxFE7WAAAcLiR.png)
• • •
Missing some Tweet in this thread? You can try to
force a refresh


