A thread about Australia’s hydro generating assets & how they can greatly help Australia get very close to 100% renewable electricity.
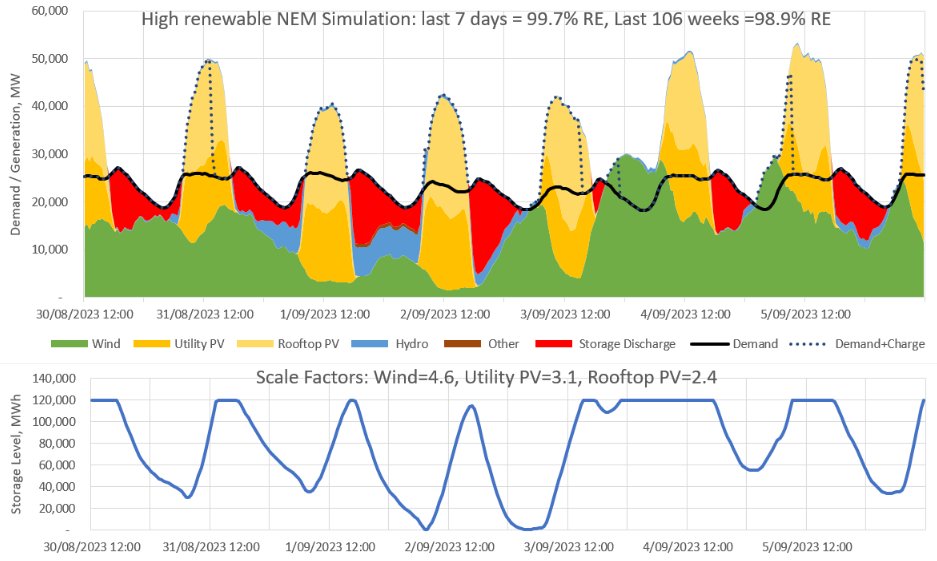
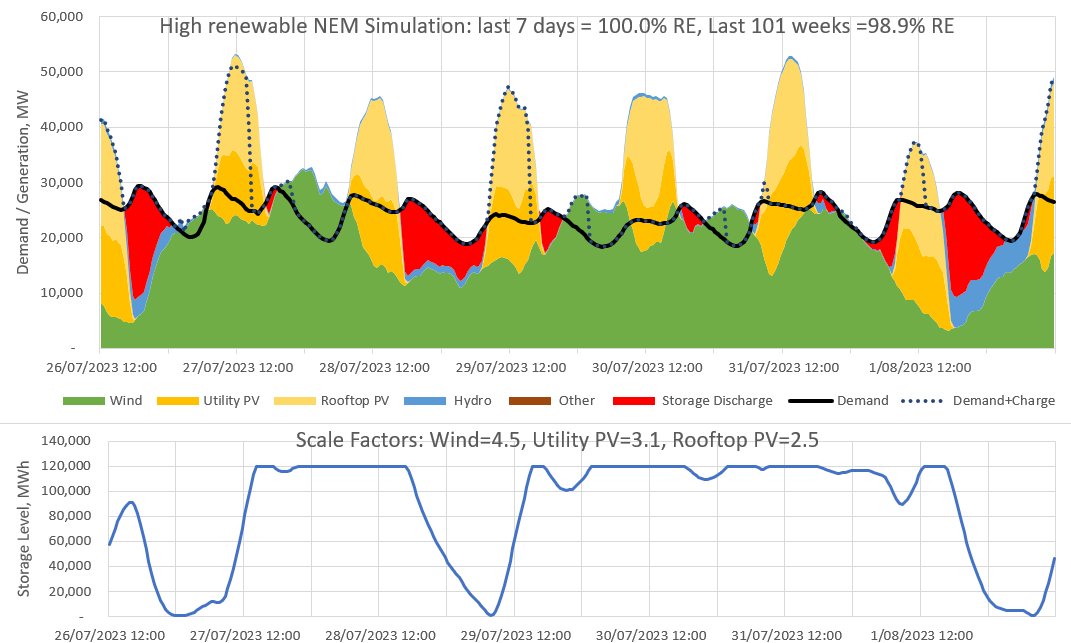
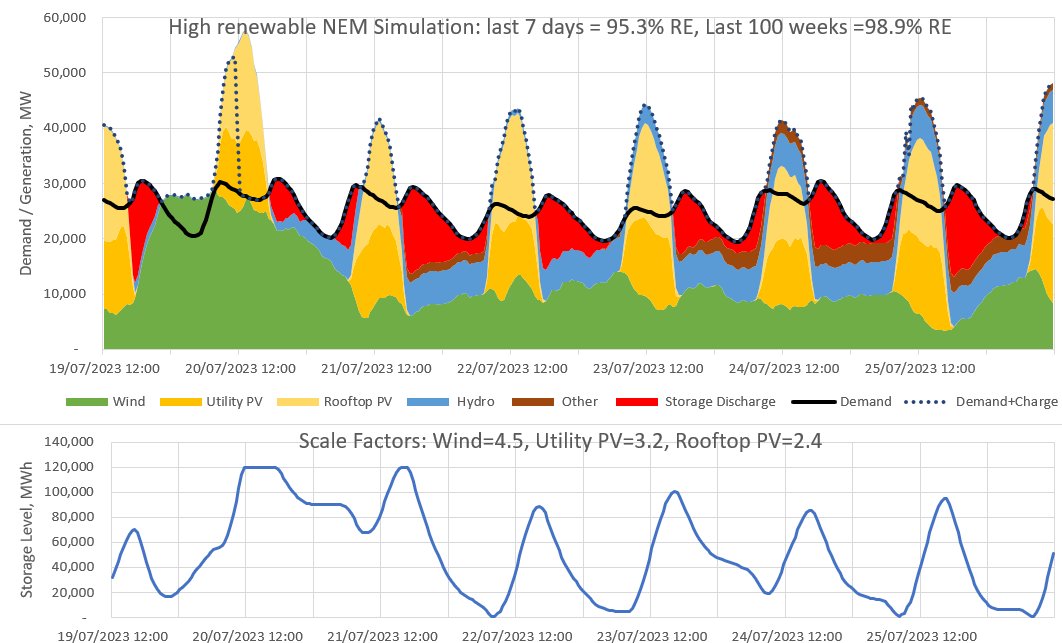
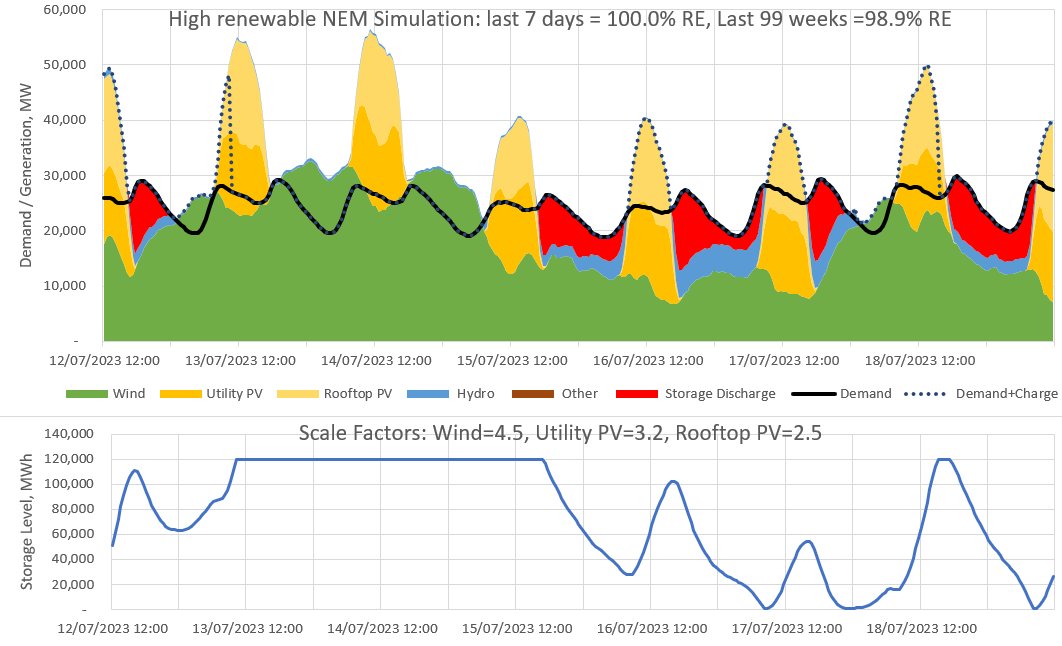
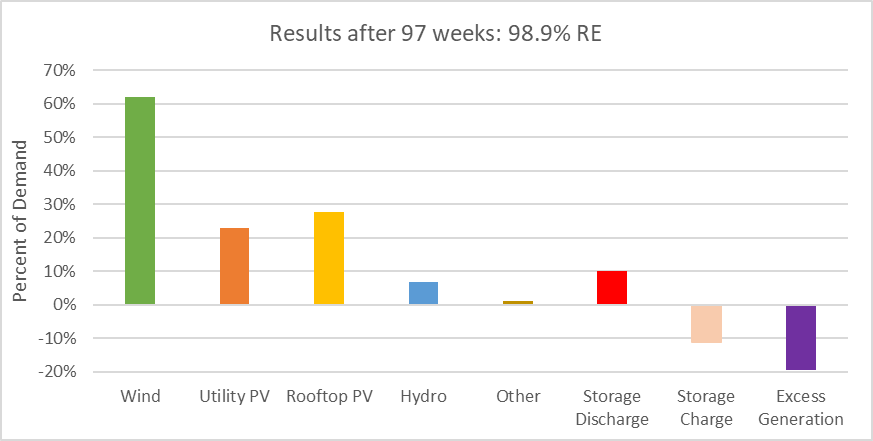
I’ve previously tweeted about how hydro can balance wind & solar on a daily basis (1/n)
I’ve previously tweeted about how hydro can balance wind & solar on a daily basis (1/n)
https://twitter.com/DavidOsmond8/status/1704362836707934470
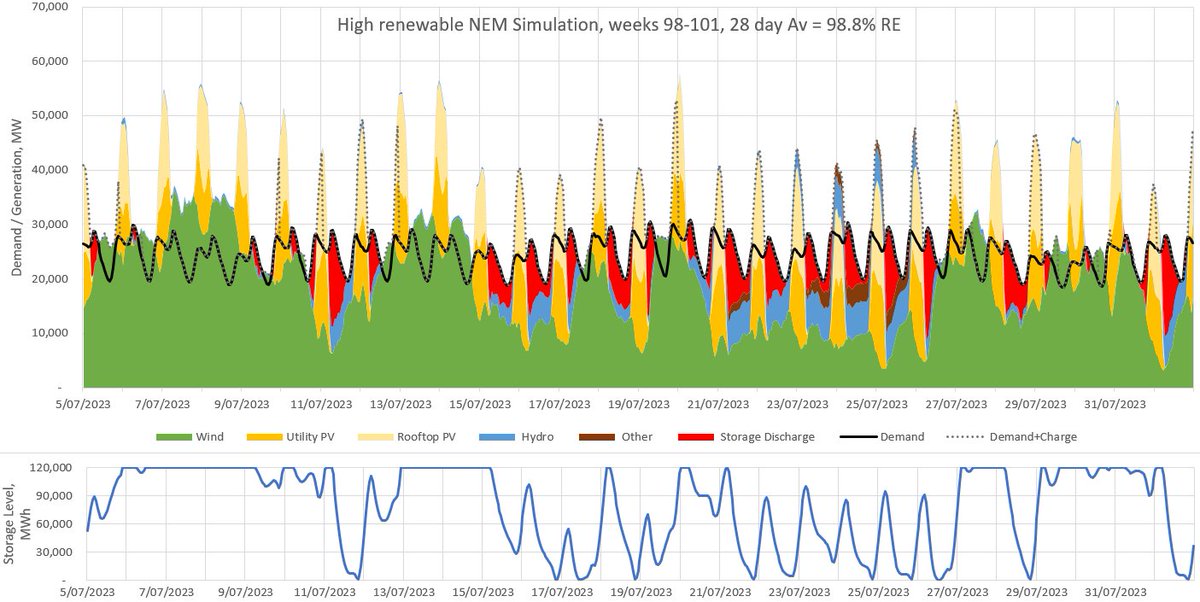
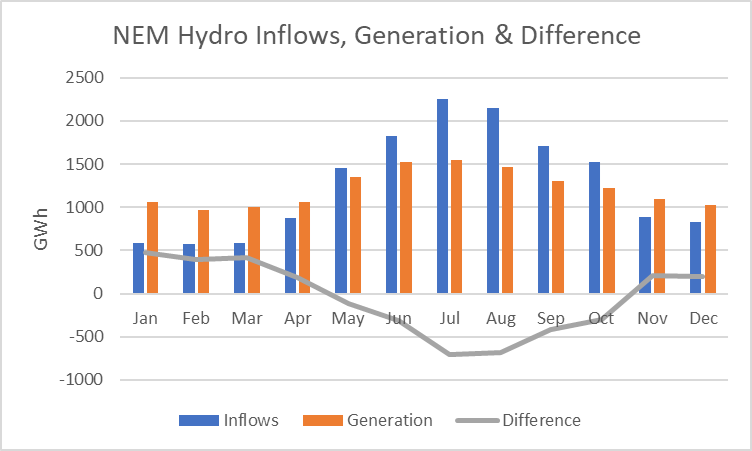
But hydro is also useful for balancing renewables on a seasonal & yearly basis.
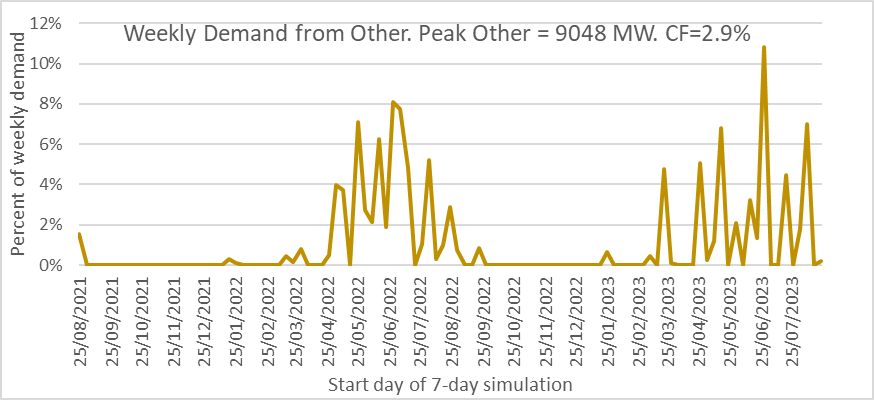
Our dams store ~2 TWh of excess inflows from May-Oct & release them in Nov-Apr.
In FY2013 & 14, hydro generated 6.5 TWh more than inflows to take advantage of high prices during the carbon tax (2/n)

Our dams store ~2 TWh of excess inflows from May-Oct & release them in Nov-Apr.
In FY2013 & 14, hydro generated 6.5 TWh more than inflows to take advantage of high prices during the carbon tax (2/n)
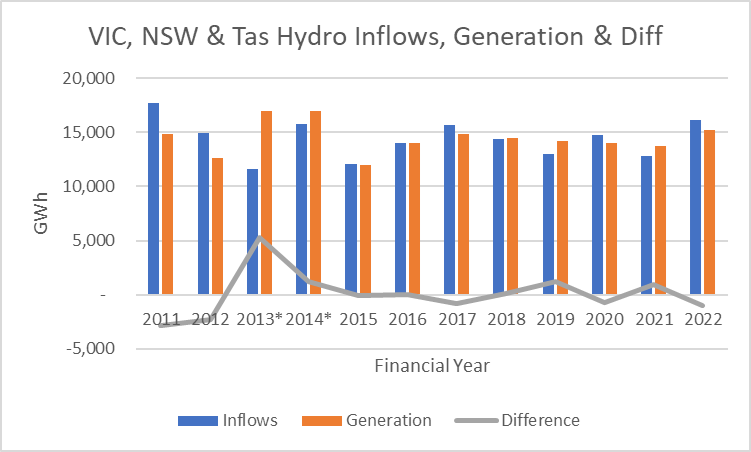
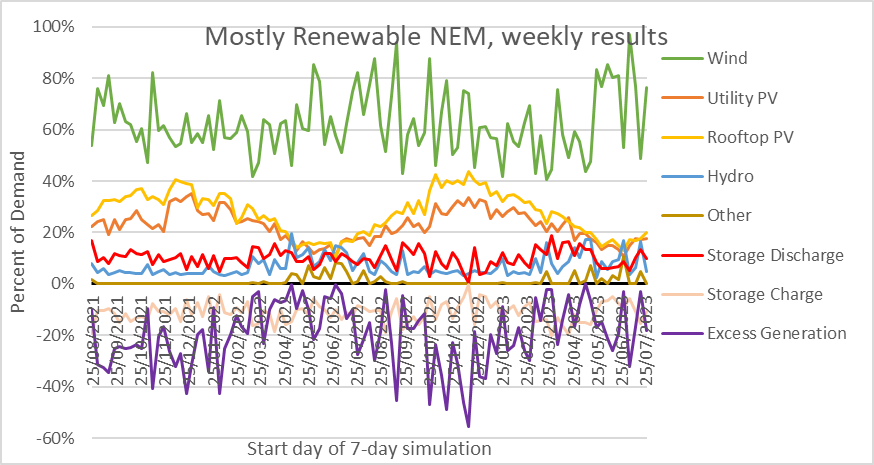
So it is clear that our hydro assets are able to store multiple TWh of potential generation in dams, and release them in different months or years depending on our needs (3/n)
But the Snowy hydro scheme is for irrigation as well as generation. Thankfully, there are 2 big dams near the bottom of this scheme, Blowering & Hume, that can store over a year of typical Snowy generation. Thus irrigation needs can be mostly decoupled from generation (4/n)
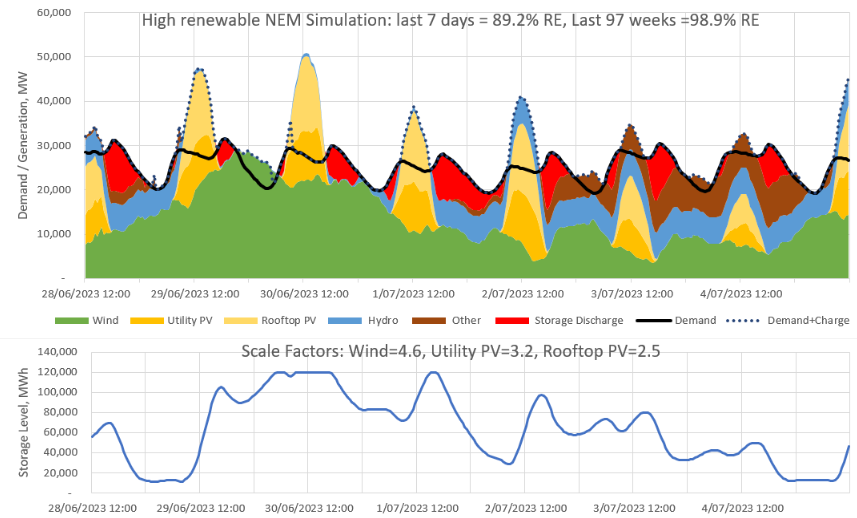
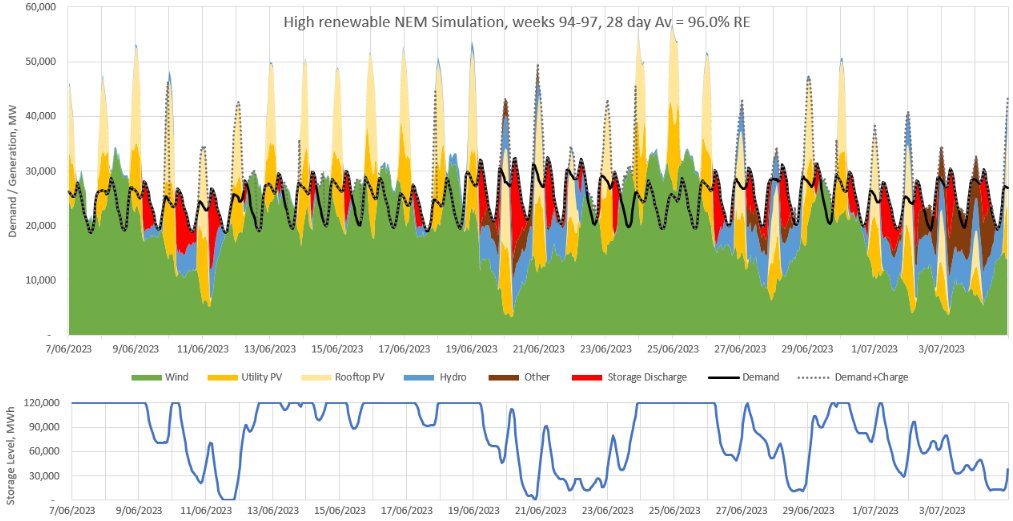
Which brings me back to a point that I often make. If you see a study claiming that Australia's NEM needs multiple TWh of storage to get near 100% renewable, always check their assumptions about hydro (5/n)
https://twitter.com/DavidOsmond8/status/1699342992606371965
• • •
Missing some Tweet in this thread? You can try to
force a refresh