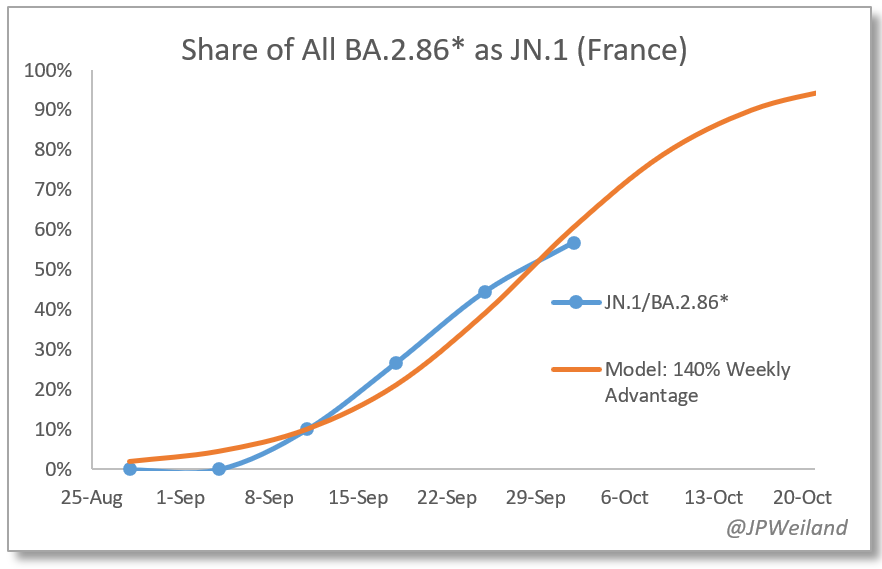
#JN.1 #Pirola is demonstrating strong growth in France, where its been found most frequently. At 2% by Oct 2.
These estimates tend to skew high early with a new variant.
To me it looks likely >100%/wk, which would make it more than twice as fast as anything else out there.
These estimates tend to skew high early with a new variant.
To me it looks likely >100%/wk, which would make it more than twice as fast as anything else out there.

We are also seeing it outcompete the baseline BA.2.86.1 quickly in France. Now more than 50% of Pirola in France are JN.1, in just a few weeks.
If >100% holds, JN.1 could drive a wave in France as early as mid November.
More data can change that timeline.
If >100% holds, JN.1 could drive a wave in France as early as mid November.
More data can change that timeline.
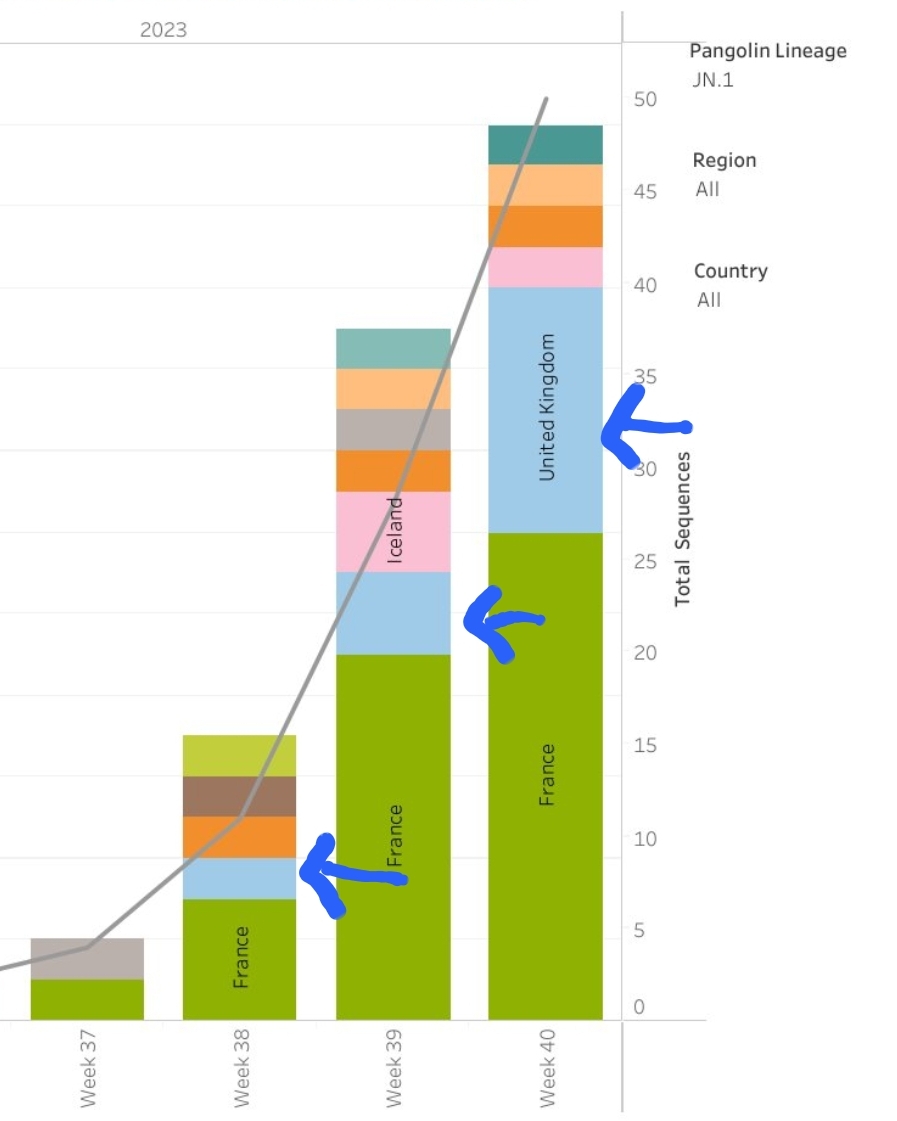
This chart from @RajlabN shows it growing in various places. Take a look at the UK, also showing exceptionally fast growth
https://twitter.com/RajlabN/status/1714282780195213757
Nick Rose @Asinickle1 has been doing a fantastic job keeping track of JN.1, and has also been estimating growth. We are arriving at close to the same numbers.
https://twitter.com/Asinickle1/status/1714307808902992348
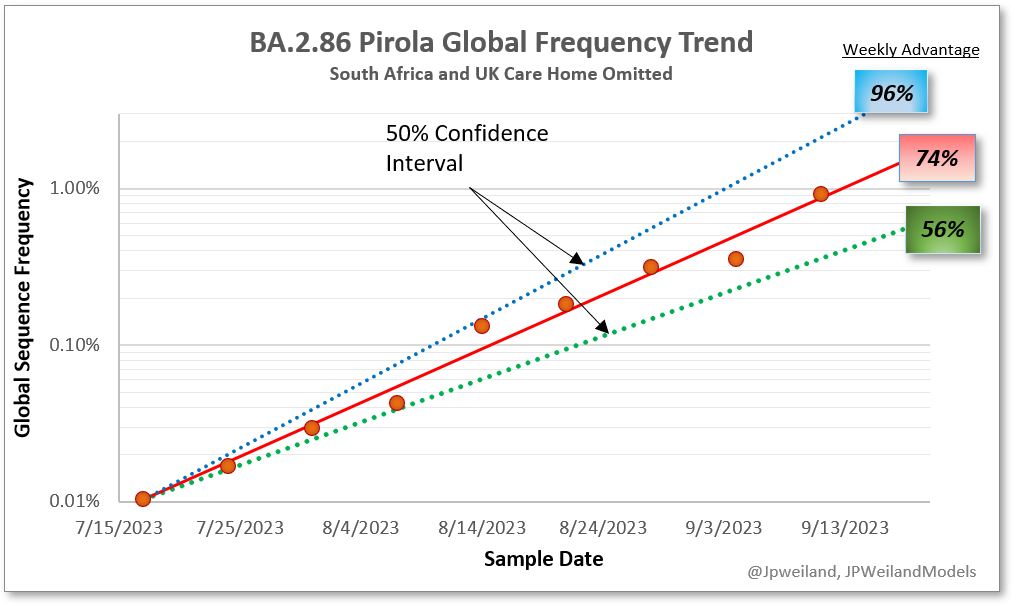
Some of us have been told that were focusing too much on Pirola vs other variants.
We thought from the early on that it was going to quickly optimize.
I think our focus has been warranted.
We thought from the early on that it was going to quickly optimize.
I think our focus has been warranted.
https://twitter.com/JPWeiland/status/1697382504003477717
• • •
Missing some Tweet in this thread? You can try to
force a refresh