Tara Moriarty Profile picture
Oct 19 6 tweets 1 min read Twitter logo Read on Twitter
I'm trying a couple of new ways to try to contextualize current COVID numbers to help people understand the scale of the current problem.

I'll post these tests in this thread.

Please provide feedback...

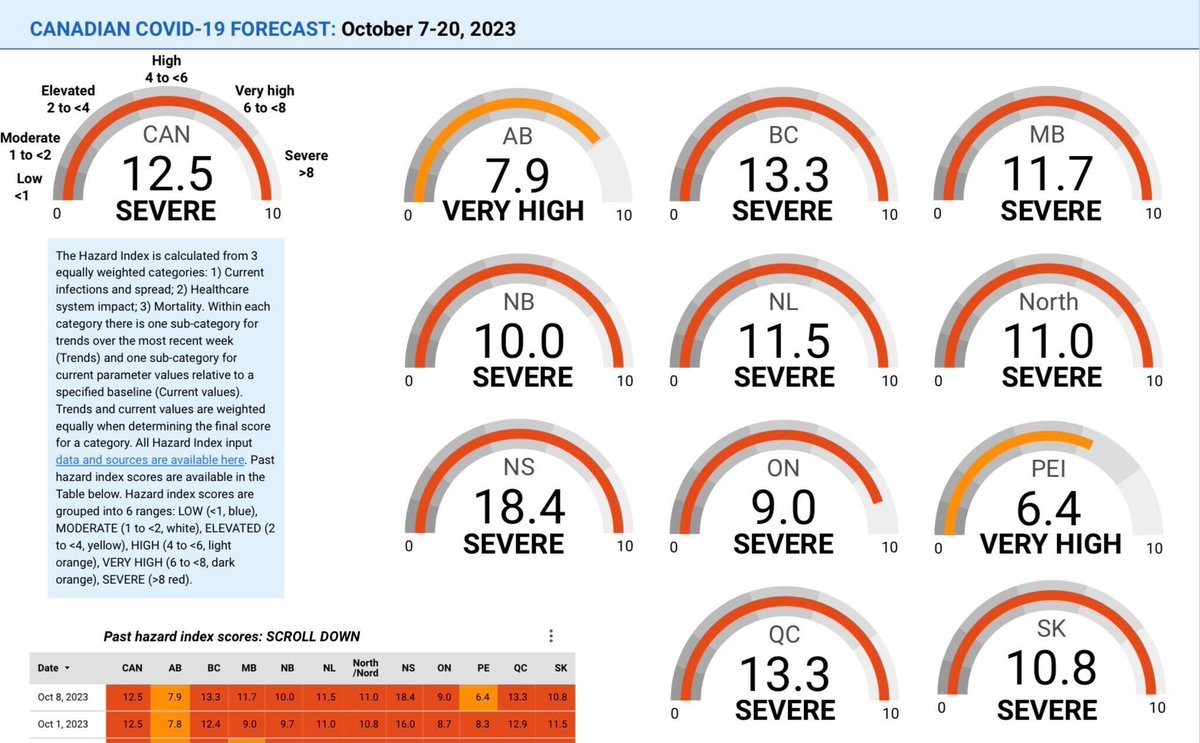
P.S. these are real estimates for the week ending Oct 14/23
Estimated numbers of healthcare professionals with COVID-19, week ending Oct 14/23:

CAN 60,477
NL 1,016
PEI 298
NS 1,966
NB 1,481
QC 14,013
ON 21,977
MB 2,329
SK 1,986
AB 7,697
BC 7,430
YK, NWT, NUN 141

This is professionals only--not PSWs, non-professional workforce.
The week ending Oct 14/23:

About 9% of ICU beds were occupied by COVID-19 patients (average epidemic to date: 12%)

About 21% of hospital beds were occupied by COVID-19 patients (average epidemic to date: 7%)
The estimated costs of COVID-19 hospitalizations in Canada for the week ending Oct 14/23:

CAN $274M
NL $3.7M
PEI $1.2M
NS $7.2M
NB $5.7M
QC $61.2M
ON $106.3M
MB $9.9M
SK $8.4M
AB $32.0M
BC $37.4M
YT, NWT, NUN $0.9M
cc @alandrummond2 @DickZoutman for thoughts

Estimated current COVID prevalence is about 4% of population infected in Canada. Professional healthforce numbers are CIHI 2021. Costs/hosp/ICU admission CIHI 2022.
@alandrummond2 @DickZoutman QC is publishing estimates of % of healthcare workforce who currently have long COVID. I have to dig around some more, but can do estimates of % workforce with COVID and long COVID to give a sense of scale--it doesn't explain all ER closures, but definitely contributes.

• • •

Missing some Tweet in this thread? You can try to force a refresh
 

Keep Current with Tara Moriarty

Tara Moriarty Profile picture

Stay in touch and get notified when new unrolls are available from this author!

Read all threads

This Thread may be Removed Anytime!

PDF

Twitter may remove this content at anytime! Save it as PDF for later use!

Try unrolling a thread yourself!

how to unroll video
  1. Follow @ThreadReaderApp to mention us!

  2. From a Twitter thread mention us with a keyword "unroll"
@threadreaderapp unroll

Practice here first or read more on our help page!

More from @MoriartyLab

Oct 16
Canadian COVID Forecast : Oct 7-20, 2023

SEVERE: CAN, BC, MB, NB, NL, North, NS, ON, QC, SK
VERY HIGH: AB, PEI
HIGH: none
ELEVATED: none
MODERATE: none
LOW: none

About 1 in 25 people in Canada are CURRENTLY infected. This image shows a series of gauges with the Oct 7 - Oct 20, 2023 Hazard Index scores for Canada, the provinces, and territories. Read from left to right:  Canada: 12.5 - SEVERE Alberta: 7.9 - VERY HIGH British Columbia: 13.3 - SEVERE Manitoba: 11.7 - SEVERE New Brunswick: 10.0 - SEVERE Newfoundland and Labrador: 11.5 - SEVERE North: 11.0 - SEVERE Nova Scotia: 18.4 - SEVERE Ontario: 9.0 - SEVERE Prince Edward Island: 6.4 - VERY HIGH Quebec: 13.3 - SEVERE Saskatchewan: 10.8 - SEVERE  All Hazard Index input data and sources are available here (https://covid19resources.ca/covid-hazard-index/) ...
Prévisions de COVID pour le Canada : 7 - 20 oct 2023

EXTRÊME: CAN, CB, MB, NB, TNL, Nord, NÉ, ON, QC, SK
GRAVE: AB, ÎPÉ
TRÈS ÉLEVÉ: aucun
ÉLEVÉ: aucun
MODÉRÉ: aucun
FAIBLE: aucun

Environ 1 personne sur 25 au Canada est actuellement infectée
Canadian healthcare settings, when will you follow WHO 2023 masking guidance?

#MasksKeepUsSafe

who.int/news-room/ques…
A blue-bordered image by Covid-19 Resources Canada has an inset frame. Heading, in red text: Canadian healthcare settings, when will you follow WHO 2023 masking guidance?  a cluster of viruses next to the text.  Smaller blue text: When COVID-19 is circulating, WHO recommends: -Well-fitting masks worn at all times -By health workers and visitors -In ALL parts of healthcare settings, including common areas -Masks should be worn In Addition to physical distancing each bullet is a small red virus. Below the guidelines is the line: WHO Guidance Jan 13, 2023 with link to the guidelines.  A masked...
Read 48 tweets
Sep 28
Let's talk about equity...

From the US Long COVID Pulse survey Aug 23-Sep 4/23

1.4% of US adult pop is CURRENTLY experiencing LC that significantly limits life activities--4.6M people.

Ppl w/ disabilities 7.8X more likely to have activ-limiting LC than those w/out disabilities
People who identify as LGBTQ2S+ are 1.5X more likely to be living with LC that significantly limits daily life activities than straight/cis people.

People with less than a Bachelor's degree are 1.3X more likely to be living with activ-limiting LC than people with a Bachelor's.
1.7X more women are living with LC that significantly limits daily life activities than men.

People 30-59 are ~1.6X more likely to be living with life activ-limiting LC than people in other age groups.

cdc.gov/nchs/covid19/p…
Read 4 tweets
Sep 25
Canadian COVID Forecast
Sep 23-Oct 6, 2023

SEVERE: CAN, BC, NB, NL, North, NS, ON, PEI, QC, SK

About 1 in 29 people are currently infected Image
I'm travelling today and don't have time to do a long thread.

As always, you can find all the province-specific forecasts and other data in our biweekly Canadian COVID report here:

covid19resources.ca/covid-hazard-i…
There is still some disconnect between waste water-estimated infections and infections estimated from our model. Our estimates of the number of people currently infected average both estimates. Image
Read 16 tweets
Sep 16
We've added new pages to our biweekly Canadian COVID data report and forecast.

These are focused on measuring reporting of severe outcomes (hospital and ICU admissions, deaths) in each province.

I'll do a quick TL;DR here--more details are in the report. Image
Report here:

This is a first draft of a non-scientist-oriented summary of data we're writing up.

Please let me know what types of info/clarification etc you'd like to see. It may not be possible to include all in the report, but it can go in the paper!

covid19resources.ca/covid-hazard-i…
Percent actual hospital admissions reported by @CIHI_ICIS that were reported publicly by provinces, Jan 1/20 to Mar 31/23

CAN 69%
NL 29%
PEI 36%
NB 38%
ON 52%
NS 55%
SK 76%
BC 84%
QC 85%
AB 85%
MB 86% Image
Read 17 tweets
Sep 9
1st view of revisions to our model of estimated daily infections in Canada incorporating waste water.

In this thread I'll paste the first draft of the explainer in our biweekly report. There's not a ton of space, so the description is condensed (confusing?).

Feedback please! Image
FYI I'm trying to post graphs comparing model- and waste water-estimated infections for every province before the next issue of our biweekly report comes out tomorrow.

But, I have lots of teaching prep to finish, so may not make it until the next report in 2 weeks.
ok, below please find pasted the text of the explainer you can see underneath the graph at the top of the thread.
Read 23 tweets
Aug 30
Canadian COVID Forecast: Aug 26-Sep 8, 2023

SEVERE: AB, NB, NL
VERY HIGH: CAN, BC, MB, ON, PEI
HIGH: North, NS, QC, SK
ELEVATED: none
MODERATE: none
LOW: none

About 1 in 54 people in Canada are CURRENTLY infected.

/1 This image shows a series of gauges with the Aug 26 - Sep 8, 2023 Hazard Index scores for Canada, the provinces, and territories. Read from left to right:  Canada: 7.6 - VERY HIGH Alberta: 11.9 - SEVERE British Columbia: 8.0 - VERY HIGH Manitoba: 6.8 - VERY HIGH New Brunswick: 9.1 - SEVERE Newfoundland and Labrador: 9.5 - SEVERE North: 5.0 - HIGH Nova Scotia: 4.9 - HIGH Ontario: 6.3 - VERY HIGH Prince Edward Island: 6.8 - VERY HIGH Quebec: 5.6 - HIGH Saskatchewan: 5.7 - HIGH  All Hazard Index input data and sources are available here (https://covid19resources.ca/covid-hazard-index/)  Hazard...
Prévisions de COVID pour le Canada: 26 août - 8 sep 2023

EXTRÊME: AB, NB, TNL
GRAVE: CAN, CB, MB, ON, ÎPÉ
TRÈS ÉLEVÉ: Nord, NÉ, ÎPÉ, QC, SK
ÉLEVÉ: aucun
MODÉRÉ: aucun
FAIBLE: aucun

Environ 1 personne sur 54 au Canada est actuellement infectée

/2 Image
Studies show even Mild Covid can have long term effects. #MasksKeepUsSafe.

Graphic is courtesy of BIRCH, @BIRcovidhealth, used with permission.

/3 A blue-bordered image with safety guidelines by Covid-19 Resources Canada has 3 inset frames on the left side. Top frame: Caption surrounding image with beige background: Covid Can Get on Your Nerves. Silhouette, body showing internal nerve paths, in the centre, surrounded by brown  circles, with text in each: Internal tremors, Pain, Ringing ears, Chills & sweats, Numb hands & feet, Shakes. Message on left: Studies show even Mild Covid can have long term effects. #MasksKeepUsSafe.  Graphic is courtesy of BIRCH, @BIRcovidhealth, used with permission. Image, below, left, shows a gender-neutra...
Read 36 tweets

Did Thread Reader help you today?

Support us! We are indie developers!


This site is made by just two indie developers on a laptop doing marketing, support and development! Read more about the story.

Become a Premium Member ($3/month or $30/year) and get exclusive features!

Become Premium

Don't want to be a Premium member but still want to support us?

Make a small donation by buying us coffee ($5) or help with server cost ($10)

Donate via Paypal

Or Donate anonymously using crypto!

Ethereum

0xfe58350B80634f60Fa6Dc149a72b4DFbc17D341E copy

Bitcoin

3ATGMxNzCUFzxpMCHL5sWSt4DVtS8UqXpi copy

Thank you for your support!

Follow Us on Twitter!

:(