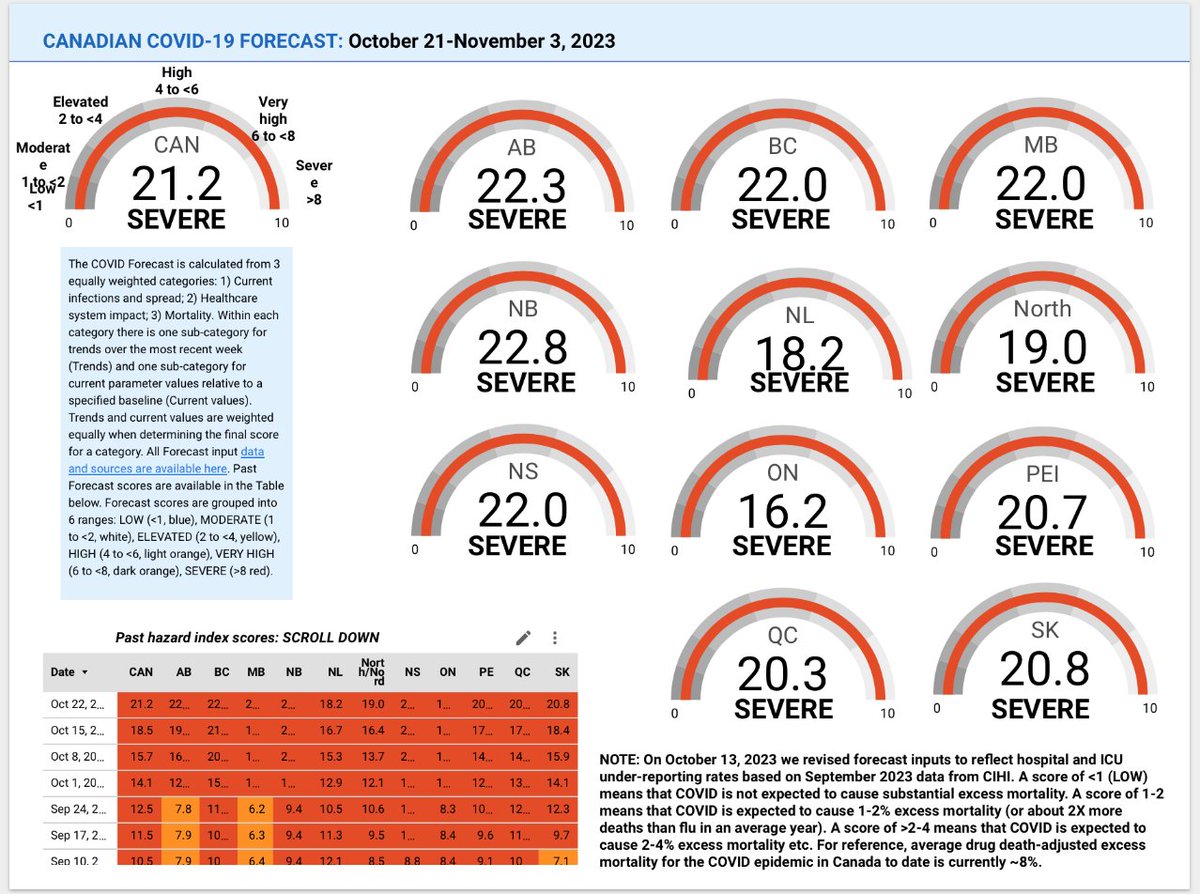
Canadian COVID Forecast: Oct 21-Nov 3, 2023
SEVERE: CAN, AB, BC, MB, NB, NL, North, NS, ON, PEI, QC, SK
VERY HIGH: none
HIGH: none
ELEVATED: none
MODERATE: none
LOW: none
About 1 in 19 people in Canada are CURRENTLY infected.
SEVERE: CAN, AB, BC, MB, NB, NL, North, NS, ON, PEI, QC, SK
VERY HIGH: none
HIGH: none
ELEVATED: none
MODERATE: none
LOW: none
About 1 in 19 people in Canada are CURRENTLY infected.
Prévisions de COVID pour le Canada: 21 oct - 3 nov, 2023
EXTRÊME: CAN, AB, CB, MB, NB, TNL, Nord, NÉ, ON, ÎPÉ, QC, SK
GRAVE: aucun
TRÈS ÉLEVÉ: aucun
ÉLEVÉ: aucun
MODÉRÉ: aucun
FAIBLE: aucun
Environ 1 personne sur 19 au Canada est actuellement infectée
EXTRÊME: CAN, AB, CB, MB, NB, TNL, Nord, NÉ, ON, ÎPÉ, QC, SK
GRAVE: aucun
TRÈS ÉLEVÉ: aucun
ÉLEVÉ: aucun
MODÉRÉ: aucun
FAIBLE: aucun
Environ 1 personne sur 19 au Canada est actuellement infectée
Studies show even Mild Covid can have long term effects. #MasksKeepUsSafe.
Graphic is courtesy of BIRCH, @BIRcovidhealth, used with permission.
Graphic is courtesy of BIRCH, @BIRcovidhealth, used with permission.

@BIRcovidhealth THREAD OUTLINE:
- Links to data sources, resources
- What’s new this week?
-Current COVID Forecasts by province
- Links to data sources, resources
- What’s new this week?
-Current COVID Forecasts by province
@BIRcovidhealth PLAN DU FIL:
- Liens vers des sources de données et des ressources
- Quoi de neuf cette semaine ?
- Liens vers des sources de données et des ressources
- Quoi de neuf cette semaine ?
@BIRcovidhealth -Prévisions actuelles du COVID par province
Information about methods, forecast inputs, estimated infections, long COVID cases, hospital and ICU admissions and deaths is available in our biweekly report at link here:
covid19resources.ca/covid-hazard-i…
Information about methods, forecast inputs, estimated infections, long COVID cases, hospital and ICU admissions and deaths is available in our biweekly report at link here:
covid19resources.ca/covid-hazard-i…
@BIRcovidhealth Des infos sur les méthodes, prévisions, infections estimées, cas de COVID à long terme, admissions dans les hôpitaux et soins intensifs et décès sont disponibles dans notre rapport bihebdomadaire ici:
covid19resources.ca/covid-hazard-i…
covid19resources.ca/covid-hazard-i…
@BIRcovidhealth Information about excess mortality in every Canadian province is available in our monthly report at link here:
covid19resources.ca/public/excess-…
covid19resources.ca/public/excess-…
@BIRcovidhealth Des informations sur la surmortalité dans chaque province canadienne sont disponibles dans notre rapport mensuel en cliquant ici :
covid19resources.ca/public/excess-…
covid19resources.ca/public/excess-…
@BIRcovidhealth Do you have questions about:
-this week’s forecast
-COVID
-vaccines
-masks
-risks of specific activities
We can help!
You can join one of our free evening Zoom sessions by signing up at the link here:
covid19resources.ca/discussions/
-this week’s forecast
-COVID
-vaccines
-masks
-risks of specific activities
We can help!
You can join one of our free evening Zoom sessions by signing up at the link here:
covid19resources.ca/discussions/
@BIRcovidhealth Vous avez des questions?
-les prévisions
-COVID
-les vaccins
-les masques
-les risques liés à certaines activités
Nous pouvons vous aider!
Vous pouvez participer à l'une de nos sessions Zoom gratuites en vous inscrivant ici:
covid19resources.ca/discussions/
-les prévisions
-COVID
-les vaccins
-les masques
-les risques liés à certaines activités
Nous pouvons vous aider!
Vous pouvez participer à l'une de nos sessions Zoom gratuites en vous inscrivant ici:
covid19resources.ca/discussions/
@BIRcovidhealth Do you want to see how the forecast is changing as new data come in?
You can go to the Forecast Inputs page of the report (p11). Most pages of the report are live. We enter data on Wed, Fri and Sat each week.
covid19resources.ca/covid-hazard-i…
You can go to the Forecast Inputs page of the report (p11). Most pages of the report are live. We enter data on Wed, Fri and Sat each week.
covid19resources.ca/covid-hazard-i…
@BIRcovidhealth Vous souhaitez voir comment la prévision évolue de l'arrivée de nouvelles données?
Vous pouvez consulter la page "Forecast Inputs" du rapport (p11). La plupart des pages du rapport sont en direct.
covid19resources.ca/covid-hazard-i…
Vous pouvez consulter la page "Forecast Inputs" du rapport (p11). La plupart des pages du rapport sont en direct.
covid19resources.ca/covid-hazard-i…
@BIRcovidhealth WHAT’S NEW THIS WEEK?
About 1 in 19 people in Canada are currently infected.
Estimated infections are at/nearing peak of all previous Omicron waves except Dec/21 wave.
5-week averages for waste water for all Canadian sites from @GovCanHealth are increasing 27%/week.
About 1 in 19 people in Canada are currently infected.
Estimated infections are at/nearing peak of all previous Omicron waves except Dec/21 wave.
5-week averages for waste water for all Canadian sites from @GovCanHealth are increasing 27%/week.

@BIRcovidhealth @GovCanHealth We think mortality in Canada from this wave may reach the height of deaths from all previous COVID-19 waves in the pandemic to date, unless those at greatest risk of death from COVID-19 get their boosters ASAP.

@BIRcovidhealth @GovCanHealth Forecast scores before Aug/23 under-predicted mortality.
From @CIHI_ICIS released Sep/23 we know under-reporting of hospital and ICU admissions is greater than we estimated.
Scores from Aug/23 onward are corrected to reflect current under-reporting rates.
From @CIHI_ICIS released Sep/23 we know under-reporting of hospital and ICU admissions is greater than we estimated.
Scores from Aug/23 onward are corrected to reflect current under-reporting rates.

@BIRcovidhealth @GovCanHealth @CIHI_ICIS Due to inconsistent provincial reporting, this week we switched to hospital, ICU and death data from @GovCanHealth and @INSPQ, corrected for under-reporting.
Forecast scores reflect regional differences in population size, waste water and estimated infections.
Forecast scores reflect regional differences in population size, waste water and estimated infections.

@BIRcovidhealth @GovCanHealth @CIHI_ICIS @INSPQ From @CIHI_ICIS we know 35% of hospital and 83% of ICU admissions for Jan-Mar/23 were NOT reported to @GovCanHealth.
Current numbers are likely one third higher than @GovCanHealth report.
health-infobase.canada.ca/covid-19/curre…
Current numbers are likely one third higher than @GovCanHealth report.
health-infobase.canada.ca/covid-19/curre…

@BIRcovidhealth @GovCanHealth @CIHI_ICIS @INSPQ You may also notice scores of 25 for multiple indicators and provinces. This is because we set a max of 25 to stabilize the global (overall) score.
The overall score reflects the % excess mortality we think will result from infections…
The overall score reflects the % excess mortality we think will result from infections…
@BIRcovidhealth @GovCanHealth @CIHI_ICIS @INSPQ In Canada, we have not typically seen excess mortality peaks greater than 25-30% during Omicron.
When we get the next excess mortality report from @statcan_eng in mid-Nov we will revisit whether to set the max higher than 25.
When we get the next excess mortality report from @statcan_eng in mid-Nov we will revisit whether to set the max higher than 25.
@BIRcovidhealth @GovCanHealth @CIHI_ICIS @INSPQ @StatCan_eng Environ 1 personne sur 19 est actuellement infectée au Canada.
Les infections estimées atteignent ou approchent le pic de toutes les vagues Omicron précédentes, à l'exception de la vague du déc/21.
Les infections estimées atteignent ou approchent le pic de toutes les vagues Omicron précédentes, à l'exception de la vague du déc/21.
@BIRcovidhealth @GovCanHealth @CIHI_ICIS @INSPQ @StatCan_eng Les moyennes sur 5 semaines pour les eaux usées de tous les sites canadiens de @GovCanHealth augmentent de 27%/semaine.
@BIRcovidhealth @GovCanHealth @CIHI_ICIS @INSPQ @StatCan_eng Nous pensons que la mortalité due à cette vague pourrait atteindre le niveau des décès de toutes les vagues précédentes, à moins que les personnes les plus au risque de décès dû à COVID-19 ne reçoivent leurs vaccins de rappel dès que possible.
@BIRcovidhealth @GovCanHealth @CIHI_ICIS @INSPQ @StatCan_eng Les résultats des prévisions avant le août/23 sous-estimaient la mortalité.
D'après @CIHI_ICIS données publiées le sep/23, nous savons que la sous-déclaration des admissions…
D'après @CIHI_ICIS données publiées le sep/23, nous savons que la sous-déclaration des admissions…
@BIRcovidhealth @GovCanHealth @CIHI_ICIS @INSPQ @StatCan_eng …dans les hôpitaux et les unités de soins intensifs est plus importante que nous ne l'avions estimé.
Les scores à partir du 23 août sont corrigés pour refléter les taux actuels de sous-déclaration.
Les scores à partir du 23 août sont corrigés pour refléter les taux actuels de sous-déclaration.
@BIRcovidhealth @GovCanHealth @CIHI_ICIS @INSPQ @StatCan_eng En raison de l'incohérence des rapports provinciaux, cette semaine nous avons utilisé les données sur les hôpitaux, les unités de soins intensifs et les décès provenant de @GovCanHealth et @INSPQ, corrigées pour tenir compte de la sous-déclaration.
@BIRcovidhealth @GovCanHealth @CIHI_ICIS @INSPQ @StatCan_eng Les résultats des prévisions reflètent les différences régionales dans la taille de la population, les eaux usées et les infections estimées.
@BIRcovidhealth @GovCanHealth @CIHI_ICIS @INSPQ @StatCan_eng Grâce à @CIHI_ICIS, nous savons que 35 % des admissions à l'hôpital et 83 % des admissions en USI pour janvier-mars-23 n'ont PAS été déclarées à @GovCanHealth.
@BIRcovidhealth @GovCanHealth @CIHI_ICIS @INSPQ @StatCan_eng Les chiffres actuels sont probablement un tiers plus élevés que ceux rapportés par @GovCanHealth.
health-infobase.canada.ca/covid-19/curre…
health-infobase.canada.ca/covid-19/curre…
@BIRcovidhealth @GovCanHealth @CIHI_ICIS @INSPQ @StatCan_eng Vous pouvez également remarquer des scores de 25 pour plusieurs indicateurs et provinces. Cela s'explique par le fait que nous avons fixé un maximum de 25 pour stabiliser le score global.
@BIRcovidhealth @GovCanHealth @CIHI_ICIS @INSPQ @StatCan_eng Le score global reflète le pourcentage de surmortalité que nous pensons résulter des infections.
Au Canada, nous n'avons pas observé de pics de surmortalité supérieurs à 25-30 % pendant Omicron.
Au Canada, nous n'avons pas observé de pics de surmortalité supérieurs à 25-30 % pendant Omicron.
@BIRcovidhealth @GovCanHealth @CIHI_ICIS @INSPQ @StatCan_eng Lorsque nous recevrons le prochain rapport de surmortalité de @statcan_eng à la mi-novembre, nous réexaminerons la possibilité de fixer le maximum à plus de 25.
@BIRcovidhealth @GovCanHealth @CIHI_ICIS @INSPQ @StatCan_eng Canadian COVID Forecast Oct 21-Nov 3, 2023
CANADA
SEVERE (increasing)
About 1 in every 19 people infected
Compared to lowest point of pandemic in Canada:
-Infections ~25X higher
-Long COVID ~16X higher
-Hospitalizations ~15X higher
-Deaths ~24X higher
CANADA
SEVERE (increasing)
About 1 in every 19 people infected
Compared to lowest point of pandemic in Canada:
-Infections ~25X higher
-Long COVID ~16X higher
-Hospitalizations ~15X higher
-Deaths ~24X higher

@BIRcovidhealth @GovCanHealth @CIHI_ICIS @INSPQ @StatCan_eng Prévisions de COVID: 21 oct-3 nov, 2023
CANADA
EXTRÊME (en hausse)
Environ 1 personne sur 19 est infectée
Par rapport au point le plus bas de la pandémie au Canada:
-Infections ~25X supérieur
-COVID longue ~16X supérieur
-Hospitalisations ~15X supérieur
-Décès ~24X supérieur
CANADA
EXTRÊME (en hausse)
Environ 1 personne sur 19 est infectée
Par rapport au point le plus bas de la pandémie au Canada:
-Infections ~25X supérieur
-COVID longue ~16X supérieur
-Hospitalisations ~15X supérieur
-Décès ~24X supérieur

@BIRcovidhealth @GovCanHealth @CIHI_ICIS @INSPQ @StatCan_eng Canadian COVID Forecast Oct 21-Nov 3, 2023
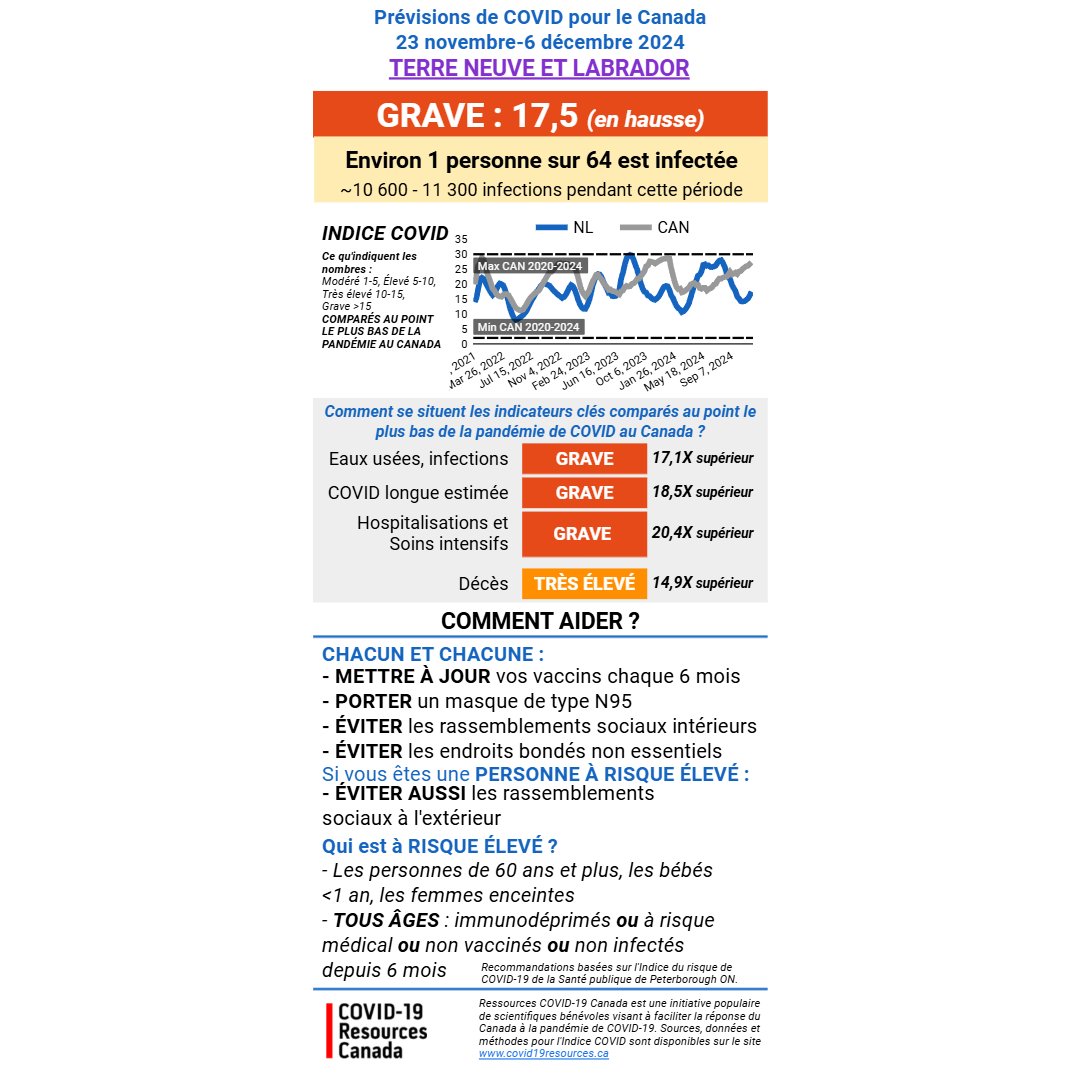
NEWFOUNDLAND AND LABRADOR
SEVERE (no change)
About 1 in every 21 people infected
Compared to lowest point of pandemic in Canada:
-Infections ~18X higher
-Long COVID ~14X higher
-Hospitalizations ~13X higher
-Deaths ~23X higher
NEWFOUNDLAND AND LABRADOR
SEVERE (no change)
About 1 in every 21 people infected
Compared to lowest point of pandemic in Canada:
-Infections ~18X higher
-Long COVID ~14X higher
-Hospitalizations ~13X higher
-Deaths ~23X higher

@BIRcovidhealth @GovCanHealth @CIHI_ICIS @INSPQ @StatCan_eng Prévisions de COVID: 21 oct - 3 nov, 2023
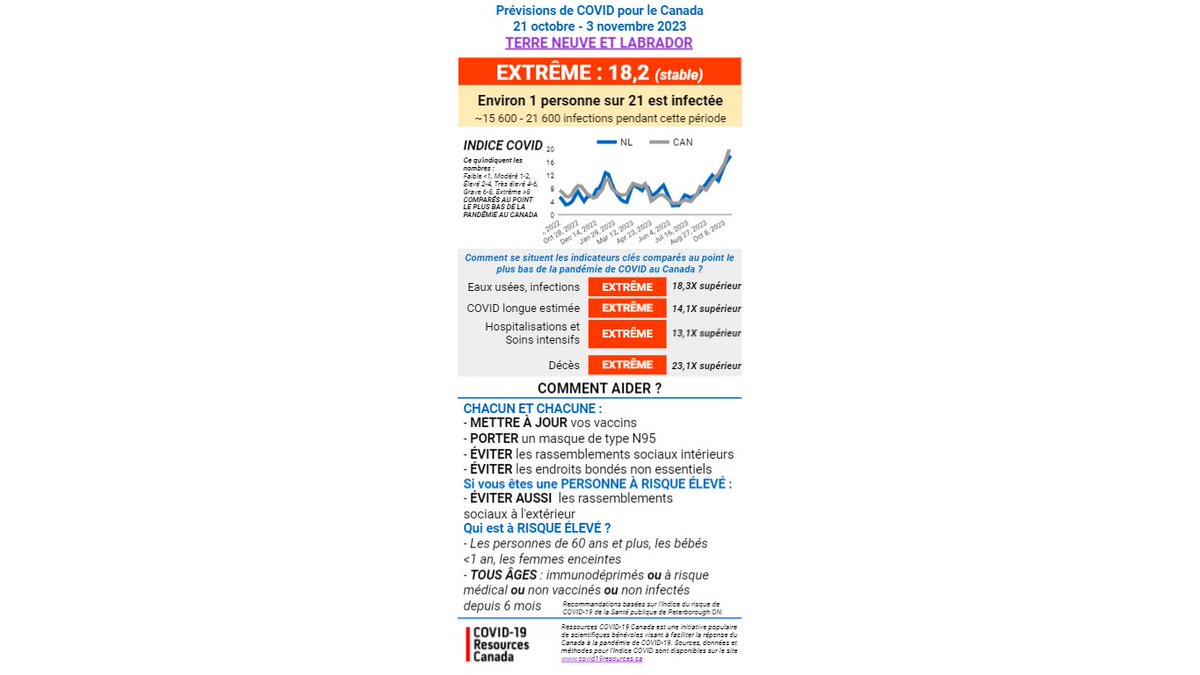
TERRE-NEUVE ET LABRADOR
EXTRÊME (stable)
Environ 1 personne sur 21 est infectée
Par rapport au point le plus bas de la pandémie au Canada:
-Infections ~18X🔺
-COVID longue ~14X🔺
-Hospitalisations ~13X🔺
-Décès ~23X 🔺
TERRE-NEUVE ET LABRADOR
EXTRÊME (stable)
Environ 1 personne sur 21 est infectée
Par rapport au point le plus bas de la pandémie au Canada:
-Infections ~18X🔺
-COVID longue ~14X🔺
-Hospitalisations ~13X🔺
-Décès ~23X 🔺
@BIRcovidhealth @GovCanHealth @CIHI_ICIS @INSPQ @StatCan_eng Canadian COVID Forecast Oct 21-Nov 3, 2023
PRINCE EDWARD ISLAND
SEVERE (increasing)
About 1 in every 17 people infected
Compared to lowest point of pandemic in Canada:
-Infections ~25X higher
-Long COVID ~17X higher
-Hospitalizations ~12X higher
-Deaths ~25X higher
PRINCE EDWARD ISLAND
SEVERE (increasing)
About 1 in every 17 people infected
Compared to lowest point of pandemic in Canada:
-Infections ~25X higher
-Long COVID ~17X higher
-Hospitalizations ~12X higher
-Deaths ~25X higher

@BIRcovidhealth @GovCanHealth @CIHI_ICIS @INSPQ @StatCan_eng Prévisions de COVID pour le Canada: 21 oct - 3 nov, 2023
ÎLE DU PRINCE ÉDOUARD
EXTRÊME (en hausse)
Environ 1 personne sur 17 est infectée
Par rapport au point le plus bas de la pandémie au Canada:
-Infections ~25X🔺
-COVID longue ~17X🔺
-Hospitalisations ~12X🔺
-Décès ~25X🔺
ÎLE DU PRINCE ÉDOUARD
EXTRÊME (en hausse)
Environ 1 personne sur 17 est infectée
Par rapport au point le plus bas de la pandémie au Canada:
-Infections ~25X🔺
-COVID longue ~17X🔺
-Hospitalisations ~12X🔺
-Décès ~25X🔺

@BIRcovidhealth @GovCanHealth @CIHI_ICIS @INSPQ @StatCan_eng Canadian COVID Forecast Oct 21-Nov 3, 2023
NOVA SCOTIA
SEVERE (no change)
About 1 in every 15 people infected
Compared to lowest point of pandemic in Canada:
-Infections ~25X higher
-Long COVID ~19X higher
-Hospitalizations ~16X higher
-Deaths ~25X higher
NOVA SCOTIA
SEVERE (no change)
About 1 in every 15 people infected
Compared to lowest point of pandemic in Canada:
-Infections ~25X higher
-Long COVID ~19X higher
-Hospitalizations ~16X higher
-Deaths ~25X higher

@BIRcovidhealth @GovCanHealth @CIHI_ICIS @INSPQ @StatCan_eng Prévisions de COVID pour le Canada: 21 oct - 3 nov, 2023
NOUVELLE-ÉCOSSE
EXTRÊME (stable)
Environ 1 personne sur 15 est infectée
Par rapport au point le plus bas de la pandémie au Canada :
-Infections ~25X🔺
-COVID longue ~19X🔺
-Hospitalisations ~16X🔺
-Décès ~25X🔺
NOUVELLE-ÉCOSSE
EXTRÊME (stable)
Environ 1 personne sur 15 est infectée
Par rapport au point le plus bas de la pandémie au Canada :
-Infections ~25X🔺
-COVID longue ~19X🔺
-Hospitalisations ~16X🔺
-Décès ~25X🔺

@BIRcovidhealth @GovCanHealth @CIHI_ICIS @INSPQ @StatCan_eng Canadian COVID Forecast Oct 21-Nov 3, 2023
NEW BRUNSWICK
SEVERE (no change)
About 1 in every 10 people infected
Compared to lowest point of pandemic in Canada:
-Infections ~25X higher
-Long COVID ~25X higher
-Hospitalizations ~19X higher
-Deaths ~25X higher
NEW BRUNSWICK
SEVERE (no change)
About 1 in every 10 people infected
Compared to lowest point of pandemic in Canada:
-Infections ~25X higher
-Long COVID ~25X higher
-Hospitalizations ~19X higher
-Deaths ~25X higher

@BIRcovidhealth @GovCanHealth @CIHI_ICIS @INSPQ @StatCan_eng Prévisions de COVID: 21 oct - 3 nov, 2023
NOUVEAU BRUNSWICK
EXTRÊME (stable)
Environ 1 personne sur 10 est infectée
Par rapport au point le plus bas de la pandémie au Canada :
-Infections ~25X🔺
-COVID longue ~25X🔺
-Hospitalisations ~19X🔺
-Décès ~25X🔺
NOUVEAU BRUNSWICK
EXTRÊME (stable)
Environ 1 personne sur 10 est infectée
Par rapport au point le plus bas de la pandémie au Canada :
-Infections ~25X🔺
-COVID longue ~25X🔺
-Hospitalisations ~19X🔺
-Décès ~25X🔺

@BIRcovidhealth @GovCanHealth @CIHI_ICIS @INSPQ @StatCan_eng Canadian COVID Forecast Oct 21-Nov 3, 2023
QUÉBEC
SEVERE (increasing)
About 1 in every 18 people infected
Compared to lowest point of pandemic in Canada:
-Infections ~25X higher
-Long COVID ~16X higher
-Hospitalizations ~12X higher
-Deaths ~24X higher
QUÉBEC
SEVERE (increasing)
About 1 in every 18 people infected
Compared to lowest point of pandemic in Canada:
-Infections ~25X higher
-Long COVID ~16X higher
-Hospitalizations ~12X higher
-Deaths ~24X higher

@BIRcovidhealth @GovCanHealth @CIHI_ICIS @INSPQ @StatCan_eng Prévisions de COVID: 21 oct - 3 nov, 2023
QUÉBEC
EXTRÊME (en hausse)
Environ 1 personne sur 18 est infectée
Par rapport au point le plus bas de la pandémie au Canada :
-Infections ~25X🔺
-COVID longue ~16X🔺
-Hospitalisations ~12X🔺
-Décès ~24X🔺
QUÉBEC
EXTRÊME (en hausse)
Environ 1 personne sur 18 est infectée
Par rapport au point le plus bas de la pandémie au Canada :
-Infections ~25X🔺
-COVID longue ~16X🔺
-Hospitalisations ~12X🔺
-Décès ~24X🔺

@BIRcovidhealth @GovCanHealth @CIHI_ICIS @INSPQ @StatCan_eng Canadian COVID Forecast Oct 21-Nov 3, 2023
ONTARIO
SEVERE (increasing)
About 1 in every 23 people infected
Compared to lowest point of pandemic in Canada:
-Infections ~18X higher
-Long COVID ~13X higher
-Hospitalizations ~11X higher
-Deaths ~20X higher
ONTARIO
SEVERE (increasing)
About 1 in every 23 people infected
Compared to lowest point of pandemic in Canada:
-Infections ~18X higher
-Long COVID ~13X higher
-Hospitalizations ~11X higher
-Deaths ~20X higher

@BIRcovidhealth @GovCanHealth @CIHI_ICIS @INSPQ @StatCan_eng Prévisions de COVID: 21 oct - 3 nov, 2023
ONTARIO
EXTRÊME (en hausse)
Environ 1 personne sur 23 est infectée
Par rapport au point le plus bas de la pandémie au Canada :
-Infections ~18X🔺
-COVID longue ~13X🔺
-Hospitalisations ~11X🔺
-Décès ~20X🔺
ONTARIO
EXTRÊME (en hausse)
Environ 1 personne sur 23 est infectée
Par rapport au point le plus bas de la pandémie au Canada :
-Infections ~18X🔺
-COVID longue ~13X🔺
-Hospitalisations ~11X🔺
-Décès ~20X🔺

@BIRcovidhealth @GovCanHealth @CIHI_ICIS @INSPQ @StatCan_eng Canadian COVID Forecast Oct 21-Nov 3, 2023
MANITOBA
SEVERE (increasing)
About 1 in every 16 people infected
Compared to lowest point of pandemic in Canada:
-Infections ~25X higher
-Long COVID ~19X higher
-Hospitalizations ~16X higher
-Deaths ~25X higher
MANITOBA
SEVERE (increasing)
About 1 in every 16 people infected
Compared to lowest point of pandemic in Canada:
-Infections ~25X higher
-Long COVID ~19X higher
-Hospitalizations ~16X higher
-Deaths ~25X higher

@BIRcovidhealth @GovCanHealth @CIHI_ICIS @INSPQ @StatCan_eng Prévisions de COVID: 21 oct - 3 nov, 2023
MANITOBA
EXTRÊME (en hausse)
Environ 1 personne sur 16 est infectée
Par rapport au point le plus bas de la pandémie au Canada :
-Infections ~25X🔺
-COVID longue ~19X🔺
-Hospitalisations ~16X🔺
-Décès ~25X🔺
MANITOBA
EXTRÊME (en hausse)
Environ 1 personne sur 16 est infectée
Par rapport au point le plus bas de la pandémie au Canada :
-Infections ~25X🔺
-COVID longue ~19X🔺
-Hospitalisations ~16X🔺
-Décès ~25X🔺

@BIRcovidhealth @GovCanHealth @CIHI_ICIS @INSPQ @StatCan_eng Canadian COVID Forecast Oct 21-Nov 3, 2023
SASKATCHEWAN
SEVERE (increasing)
About 1 in every 16 people infected
Compared to lowest point of pandemic in Canada:
-Infections ~25X higher
-Long COVID ~19X higher
-Hospitalizations ~12X higher
-Deaths ~25X higher
SASKATCHEWAN
SEVERE (increasing)
About 1 in every 16 people infected
Compared to lowest point of pandemic in Canada:
-Infections ~25X higher
-Long COVID ~19X higher
-Hospitalizations ~12X higher
-Deaths ~25X higher

@BIRcovidhealth @GovCanHealth @CIHI_ICIS @INSPQ @StatCan_eng Prévisions de COVID: 21 oct - 3 nov, 2023
SASKATCHEWAN
EXTRÊME (en hausse)
Environ 1 personne sur 16 est infectée
Par rapport au point le plus bas de la pandémie au Canada :
-Infections ~25X🔺
-COVID longue ~19X🔺
-Hospitalisations ~12X🔺
-Décès ~25X🔺
SASKATCHEWAN
EXTRÊME (en hausse)
Environ 1 personne sur 16 est infectée
Par rapport au point le plus bas de la pandémie au Canada :
-Infections ~25X🔺
-COVID longue ~19X🔺
-Hospitalisations ~12X🔺
-Décès ~25X🔺

@BIRcovidhealth @GovCanHealth @CIHI_ICIS @INSPQ @StatCan_eng Canadian COVID Forecast Oct 21-Nov 3, 2023
ALBERTA
SEVERE (increasing)
About 1 in every 15 people infected
Compared to lowest point of pandemic in Canada:
-Infections ~25X higher
-Long COVID ~20X higher
-Hospitalizations ~17X higher
-Deaths ~25X higher
ALBERTA
SEVERE (increasing)
About 1 in every 15 people infected
Compared to lowest point of pandemic in Canada:
-Infections ~25X higher
-Long COVID ~20X higher
-Hospitalizations ~17X higher
-Deaths ~25X higher

@BIRcovidhealth @GovCanHealth @CIHI_ICIS @INSPQ @StatCan_eng Prévisions de COVID: 21 oct - 3 nov, 2023
ALBERTA
EXTRÊME (en hausse)
Environ 1 personne sur 15 est infectée
Par rapport au point le plus bas de la pandémie au Canada :
-Infections ~25X🔺
-COVID longue ~20X🔺
-Hospitalisations ~17X🔺
-Décès ~25X🔺
ALBERTA
EXTRÊME (en hausse)
Environ 1 personne sur 15 est infectée
Par rapport au point le plus bas de la pandémie au Canada :
-Infections ~25X🔺
-COVID longue ~20X🔺
-Hospitalisations ~17X🔺
-Décès ~25X🔺

@BIRcovidhealth @GovCanHealth @CIHI_ICIS @INSPQ @StatCan_eng Canadian COVID Forecast Oct 21-Nov 3, 2023
BRITISH COLUMBIA
SEVERE (no change)
About 1 in every 14 people infected
Compared to lowest point of pandemic in Canada:
-Infections ~25X higher
-Long COVID ~20X higher
-Hospitalizations ~16X higher
-Deaths ~25X higher
BRITISH COLUMBIA
SEVERE (no change)
About 1 in every 14 people infected
Compared to lowest point of pandemic in Canada:
-Infections ~25X higher
-Long COVID ~20X higher
-Hospitalizations ~16X higher
-Deaths ~25X higher

@BIRcovidhealth @GovCanHealth @CIHI_ICIS @INSPQ @StatCan_eng Prévisions de COVID: 21 oct - 3 nov, 2023
COLOMBIE BRITANNIQUE
EXTRÊME (stable)
Environ 1 personne sur 14 est infectée
Par rapport au point le plus bas de la pandémie au Canada :
-Infections ~25X🔺
-COVID longue ~20X🔺
-Hospitalisations ~16X🔺
-Décès ~25X🔺
COLOMBIE BRITANNIQUE
EXTRÊME (stable)
Environ 1 personne sur 14 est infectée
Par rapport au point le plus bas de la pandémie au Canada :
-Infections ~25X🔺
-COVID longue ~20X🔺
-Hospitalisations ~16X🔺
-Décès ~25X🔺

@BIRcovidhealth @GovCanHealth @CIHI_ICIS @INSPQ @StatCan_eng Canadian COVID Forecast Oct 21-Nov 3, 2023
NUNAVUT, NWT, YUKON
SEVERE (increasing)
About 1 in every 20 people infected
Compared to lowest point of pandemic in Canada:
-Infections ~18X higher
-Long COVID ~19X higher
-Hospitalizations ~16X higher
-Deaths ~23X higher
NUNAVUT, NWT, YUKON
SEVERE (increasing)
About 1 in every 20 people infected
Compared to lowest point of pandemic in Canada:
-Infections ~18X higher
-Long COVID ~19X higher
-Hospitalizations ~16X higher
-Deaths ~23X higher

@BIRcovidhealth @GovCanHealth @CIHI_ICIS @INSPQ @StatCan_eng Prévisions de COVID: 21 oct - 3 nov, 2023
NUNAVUT, TNO, YUKON
EXTRÊME (en hausse)
Environ 1 personne sur 20 est infectée
Par rapport au point le plus bas de la pandémie au Canada :
-Infections ~18X🔺
-COVID longue ~19X🔺
-Hospitalisations ~16X🔺
-Décès ~22X🔺
NUNAVUT, TNO, YUKON
EXTRÊME (en hausse)
Environ 1 personne sur 20 est infectée
Par rapport au point le plus bas de la pandémie au Canada :
-Infections ~18X🔺
-COVID longue ~19X🔺
-Hospitalisations ~16X🔺
-Décès ~22X🔺

@BIRcovidhealth @GovCanHealth @CIHI_ICIS @INSPQ @StatCan_eng Remember, the forecast reflects not only recent input data, but also numbers expected for the next 2 weeks, based on 5-week average trends.
The next forecast will be November 4, 2023.
The next forecast will be November 4, 2023.
@BIRcovidhealth @GovCanHealth @CIHI_ICIS @INSPQ @StatCan_eng N'oubliez pas que les prévisions reflètent non seulement les données récentes, mais aussi les chiffres attendus pour les deux semaines à venir, sur la base des tendances moyennes sur cinq semaines.
La prochaine prévision sera disponible le 4 novembre 2023.
La prochaine prévision sera disponible le 4 novembre 2023.
@BIRcovidhealth @GovCanHealth @CIHI_ICIS @INSPQ @StatCan_eng Thanks to @netgaines @CircaLiz @BattlingBeaver @lamarche_denise for data input, graphics and translation.
Thanks to the whole @covid_19_canada team for weekly feedback and for keeping all our work going. #TogetherWeCan
Thanks to the whole @covid_19_canada team for weekly feedback and for keeping all our work going. #TogetherWeCan
Merci à @netgaines @CircaLiz @BattlingBeaver @lamarche_denise pour la saisie des données, les graphiques et la traduction.
Merci à toute l'équipe de @covid_19_canada pour les commentaires hebdomadaires et pour la poursuite de notre travail.
#EnsembleNousPouvons
Merci à toute l'équipe de @covid_19_canada pour les commentaires hebdomadaires et pour la poursuite de notre travail.
#EnsembleNousPouvons
• • •
Missing some Tweet in this thread? You can try to
force a refresh