Day1⃣ of #Statistics Series⚡️
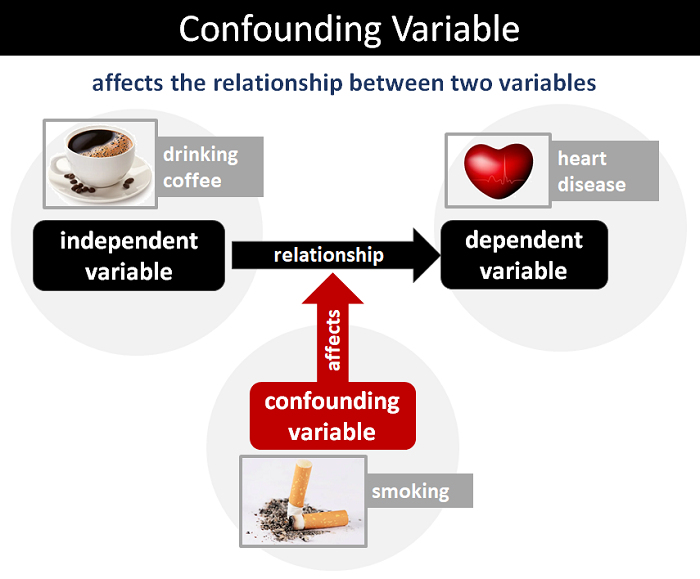
Today Topic - Confounding Variable
✅#Confoundingvariable in Statistics is a variable that is related to both independent variable ( variable you're studying) & dependent variable ( outcome you're measuring)
🧵
Today Topic - Confounding Variable
✅#Confoundingvariable in Statistics is a variable that is related to both independent variable ( variable you're studying) & dependent variable ( outcome you're measuring)
🧵
A Confounding variable can influence the outcome of an experiment in many ways, such as:
Invalid correlations.
Increasing variance.
Introducing a bias.
Invalid correlations.
Increasing variance.
Introducing a bias.
Confounding variables are important in the data domain for several reasons:
Causality and Inference
Validity of Results
Bias Reduction
Statistical Control
Causality and Inference
Validity of Results
Bias Reduction
Statistical Control
To address confounding variables, researchers often use techniques like randomization in experiments, matching in observational studies, or statistical control methods in #dataanalysis
The importance of recognizing and dealing with confounding variables is underscored by the need for accurate, unbiased, and reliable results in the #data domain, especially in research and decision-making processes
Blog - statology.org/confounding-va…
Blog - statology.org/confounding-va…
✅#Randomization is a technique used in experimental design to give control over confounding variables that cannot (should not) be held constant
Randomization is simple tool in experimental #design that allows confounding variables to have their effect across a sample.
It shifts experiment from looking at an individual case to a collection of observations, where #statistical tools are used to interpret the finding
It shifts experiment from looking at an individual case to a collection of observations, where #statistical tools are used to interpret the finding
Randomization is used in evaluation of #machinelearning models to manage uncontrollable confounding variable
It is key to standard ways described for evaluating ML model & rationale for using methods such as data resampling & repeating experiment
Blog - machinelearningmastery.com/confounding-va…
It is key to standard ways described for evaluating ML model & rationale for using methods such as data resampling & repeating experiment
Blog - machinelearningmastery.com/confounding-va…
✅If this thread was helpful to you
1. Follow me @Sachintukumar
for daily content like this
2. Connect with me on Linkedin :
3. Connect with me on Instagram :
4. RT the tweet below to share it with your friendlinkedin.com/in/sachintukum…
instagram.com/datawithsachin/
1. Follow me @Sachintukumar
for daily content like this
2. Connect with me on Linkedin :
3. Connect with me on Instagram :
4. RT the tweet below to share it with your friendlinkedin.com/in/sachintukum…
instagram.com/datawithsachin/
• • •
Missing some Tweet in this thread? You can try to
force a refresh