
Data Analyst || SQL || PowerBI || Excel || Python || Statistics
|| Ex-UPSC Aspirant ||
📩 for Collaboration
 Think of it like this:
 Q) @Oracle SQL Question:
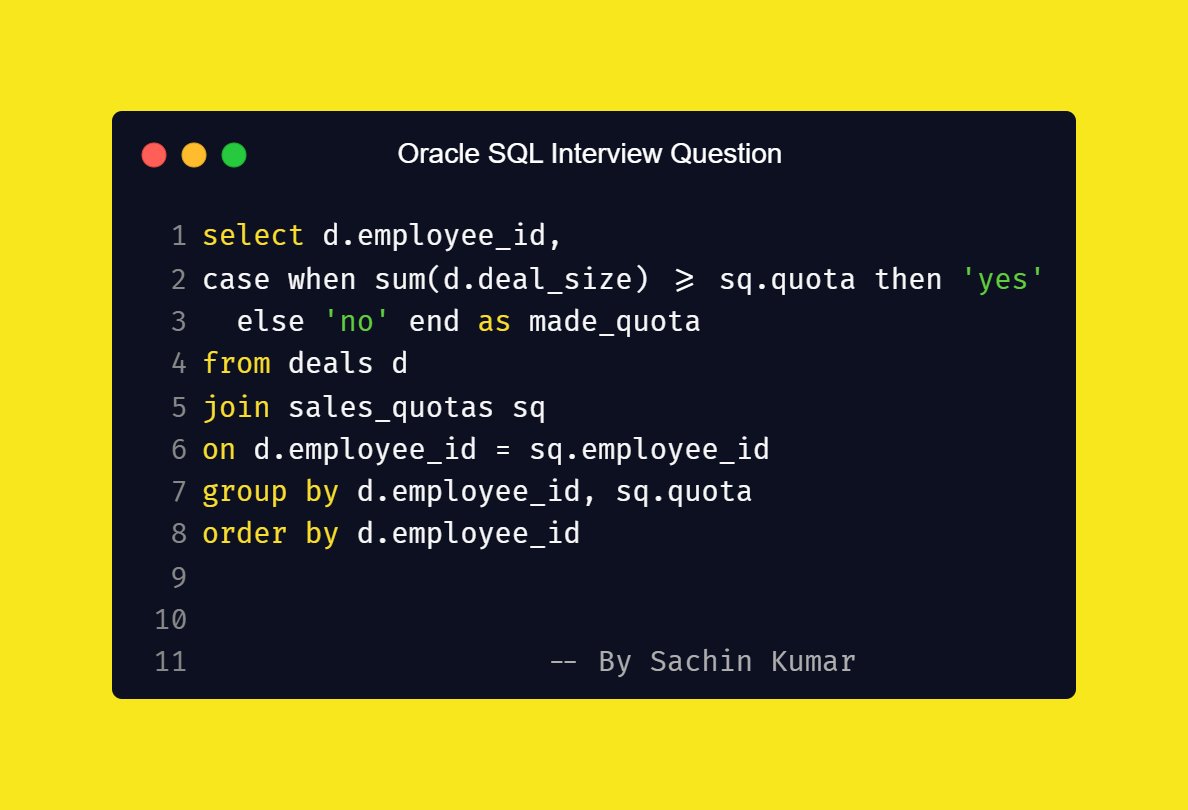 Q) As a data analyst on @Oracle Sales Operations team, you are given a list of salespeople’s deals, & annual quota they need to hit.
 Even though we write SQL like this:
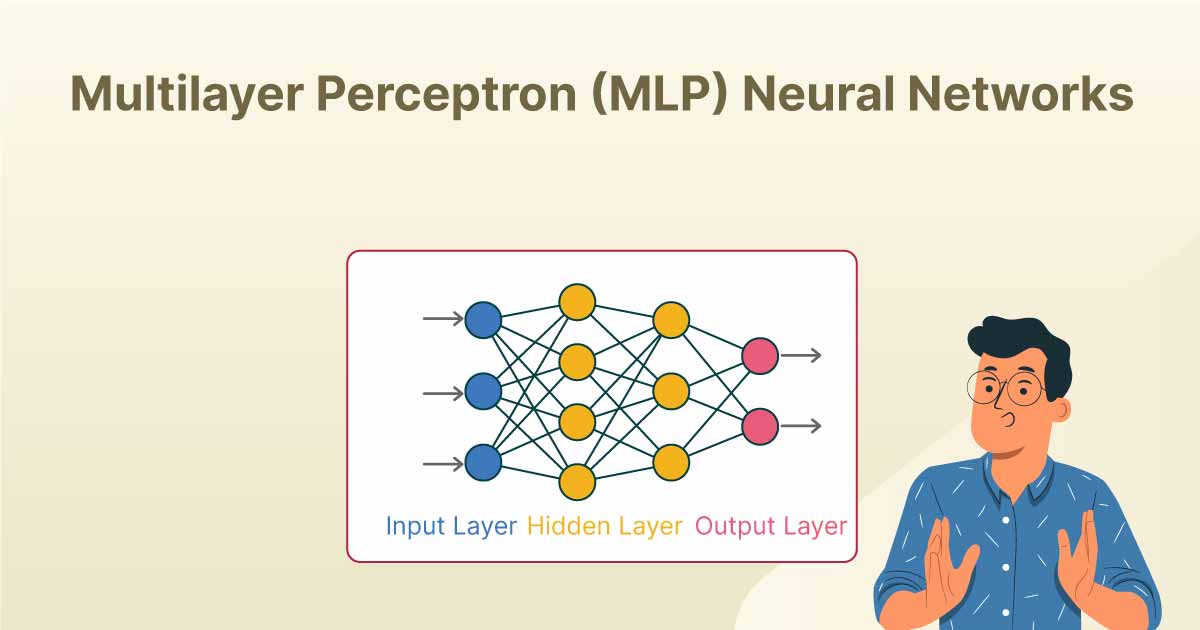
 ✅Backpropagation is an algorithm for supervised learning of artificial neural networks using #gradientdescent

 A ML model has two types of parameters:
 ✅Some of its key concepts
 DL is essentially a type of sophisticated, multi-layered filter
 - Optimization & Improvement
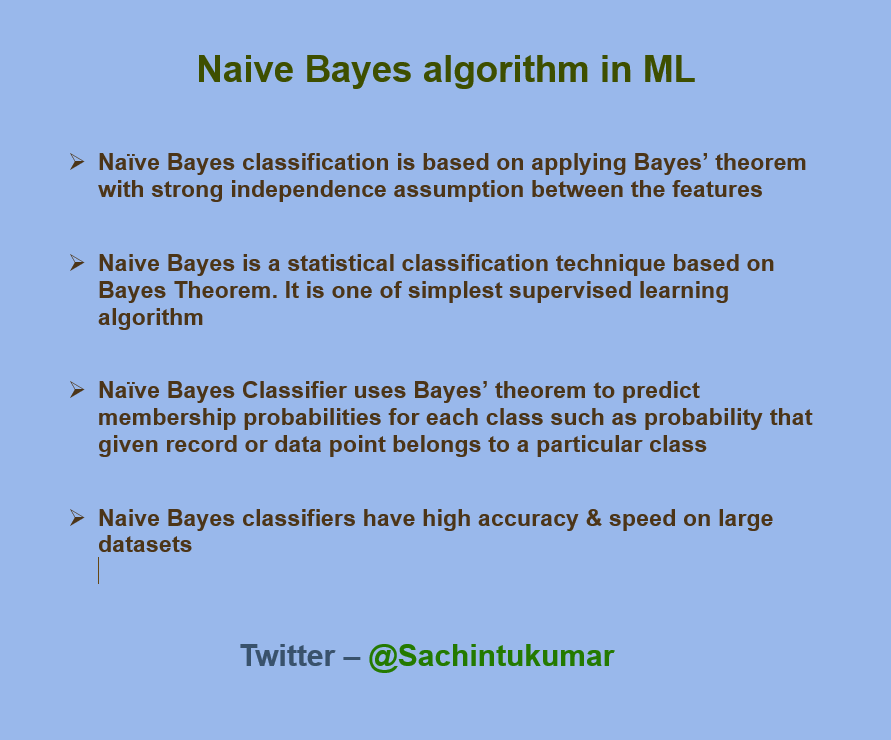 ✅Naïve Bayes Classifier uses Bayes’ theorem to predict membership probabilities for each class such as probability that given record or data point belong to particular class
 ▫️ Sets are unordered collections of unique elements, meaning that each element can only appear once in set
 ✅Lambda functions consist of 3 parts:
 1) apply() -
 Regular expressions (RE) in Python are represented as strings & combine normal characters & special symbols called metacharacters
 1⃣Module -
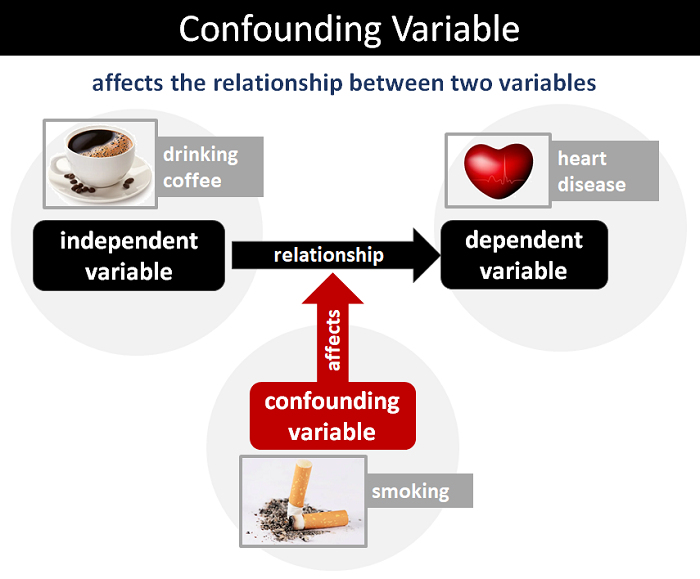 A Confounding variable can influence the outcome of an experiment in many ways, such as:
 ✅Devastating Consequences of #SQL
 ✅The purpose of #Normalization in SQL is to eliminate redundant (repetitive) #data & ensure data is stored logically