PMC C0VID-19 Tracker, Oct 30, 2023
We're at the onset of an 8th U.S. pandemic wave.
Today's Numbers:
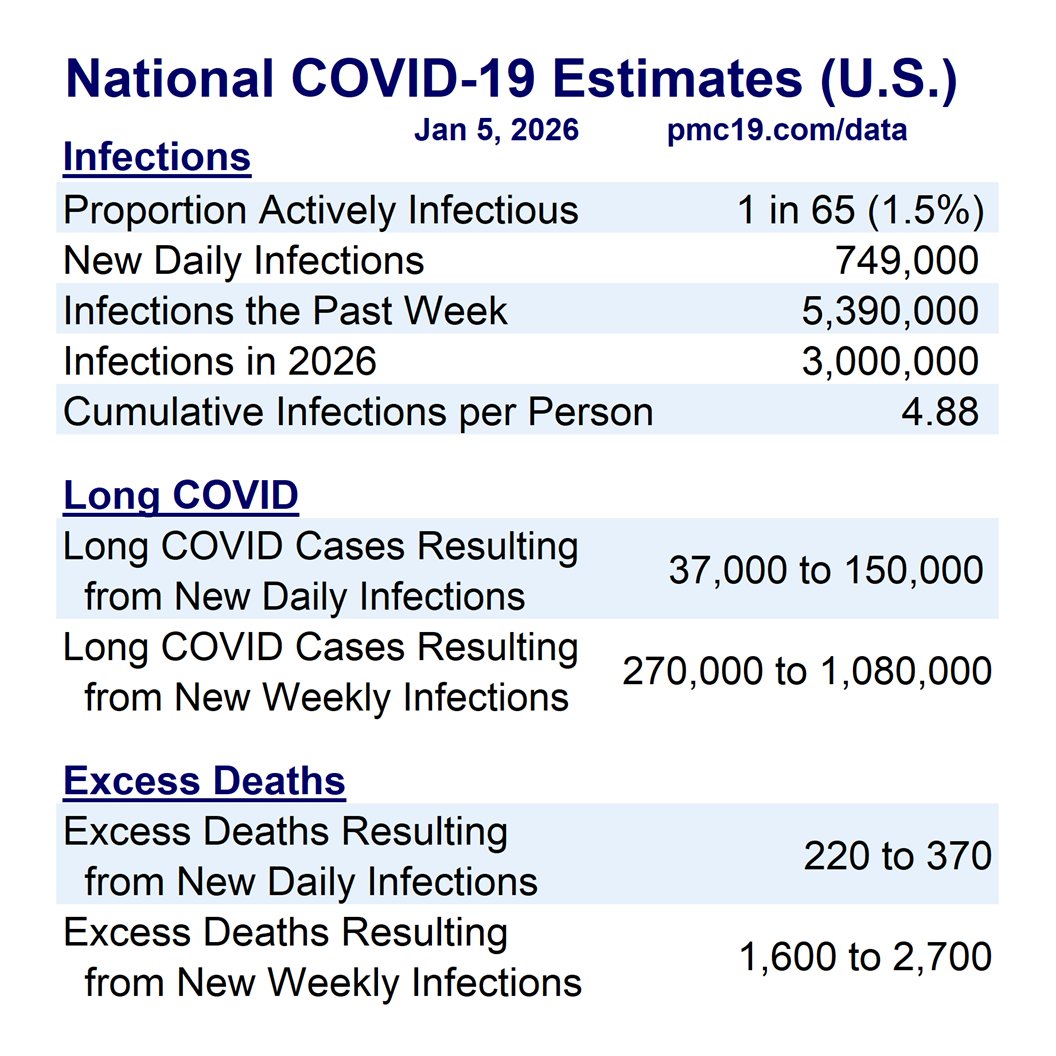
🔹 1.27% (1 in 78) are infectious
🔹 >600,000 C0VID cases/day
🔹>30,000 #LongCovid cases/day
We will pass the late-summer wave's peak in just over a month.
1/

We're at the onset of an 8th U.S. pandemic wave.
Today's Numbers:
🔹 1.27% (1 in 78) are infectious
🔹 >600,000 C0VID cases/day
🔹>30,000 #LongCovid cases/day
We will pass the late-summer wave's peak in just over a month.
1/

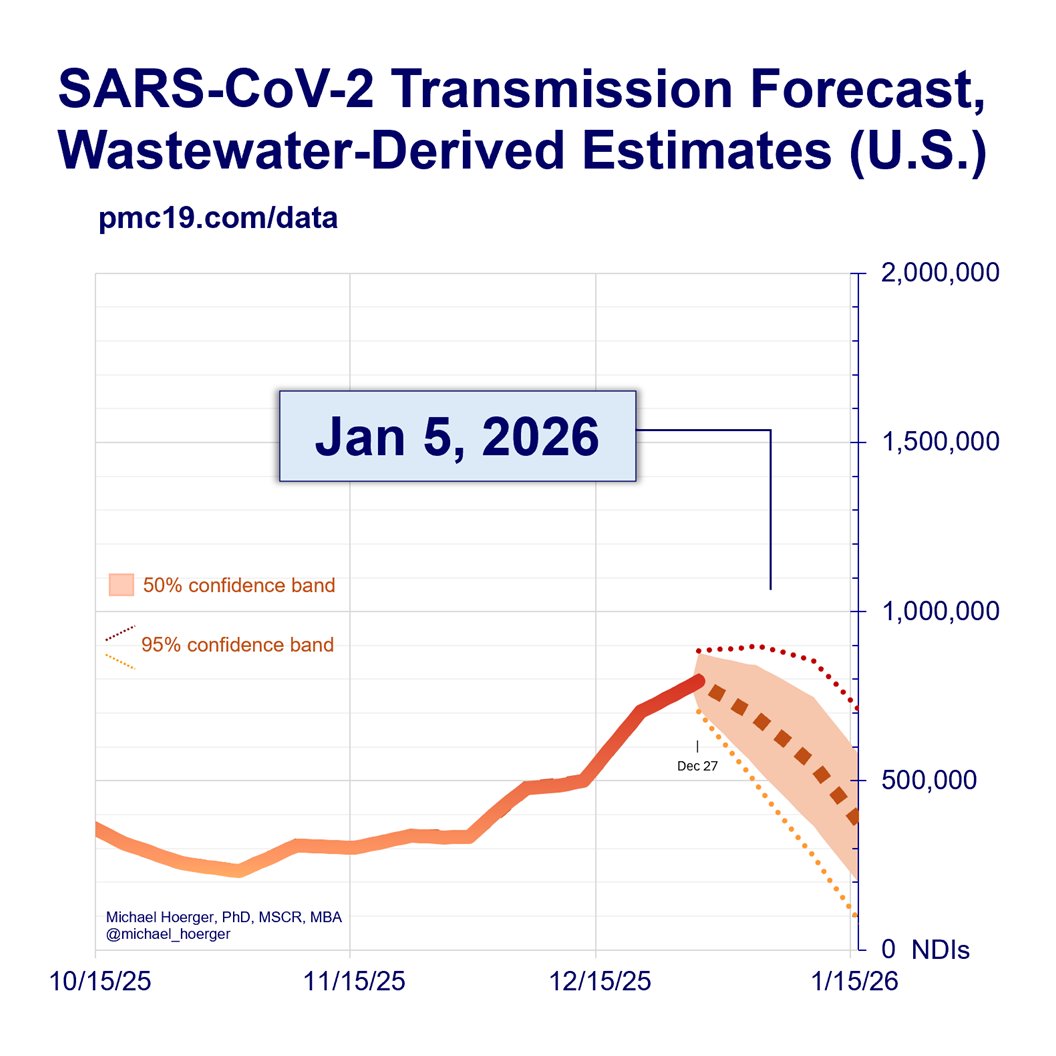
The different forecasting models reach a strikingly similar conclusion about where we'll be in a month: very bad.
November 27 by the Numbers:
🔹 1.76% (1 in 57) are infectious
🔹 >800,000 C0VID cases/day
🔹>40,000 #LongCovid cases/day
2/
Forecasting nuance:
Alt Model #1 (turtle) thinks the current real-time numbers are an underestimate, and it ignores the most recent week's data. Alt Model #2 (cheetah) accounts for recent errors in the real-time numbers; with low error, it maps on very closely to the real-time (red) line. The black line shows the composite used for reporting estimates. Note, everything converges in 4 weeks.

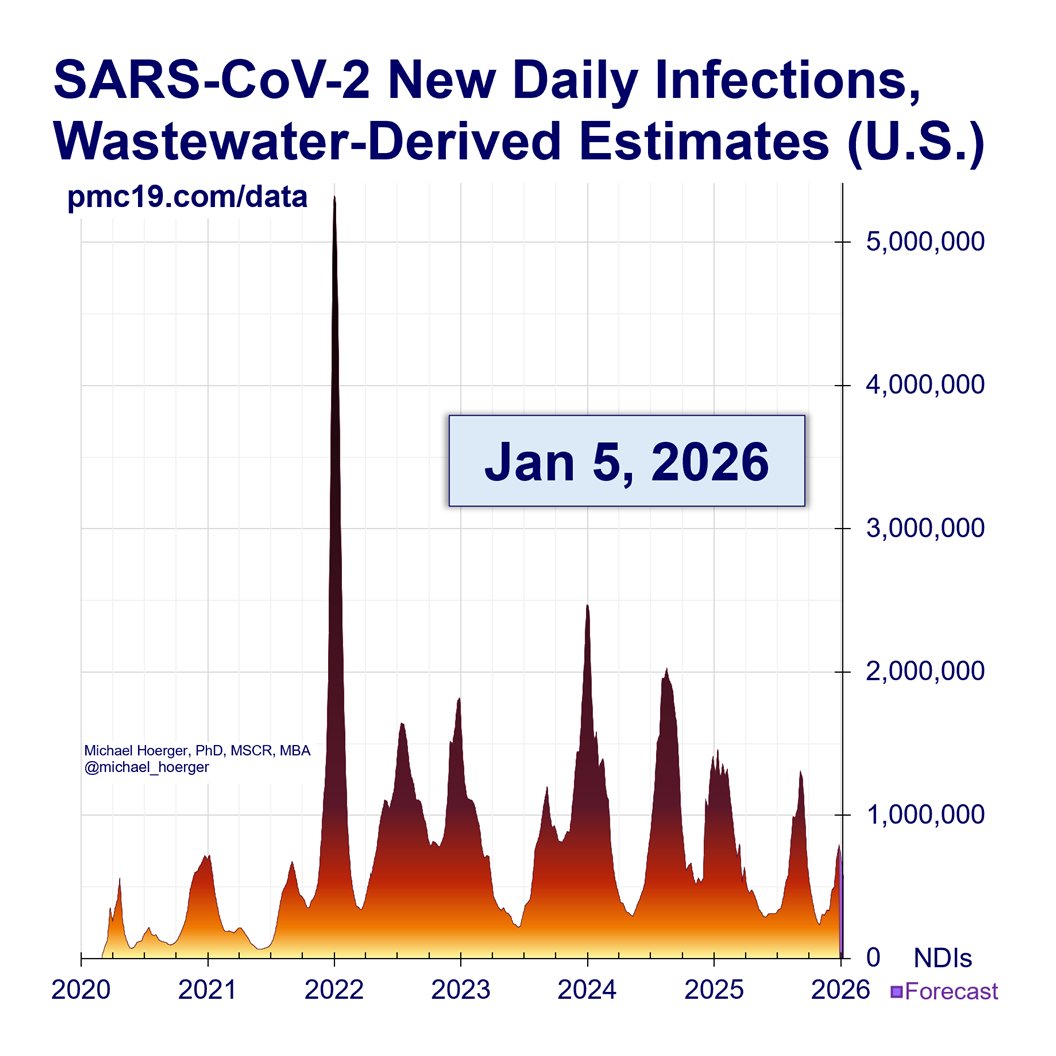
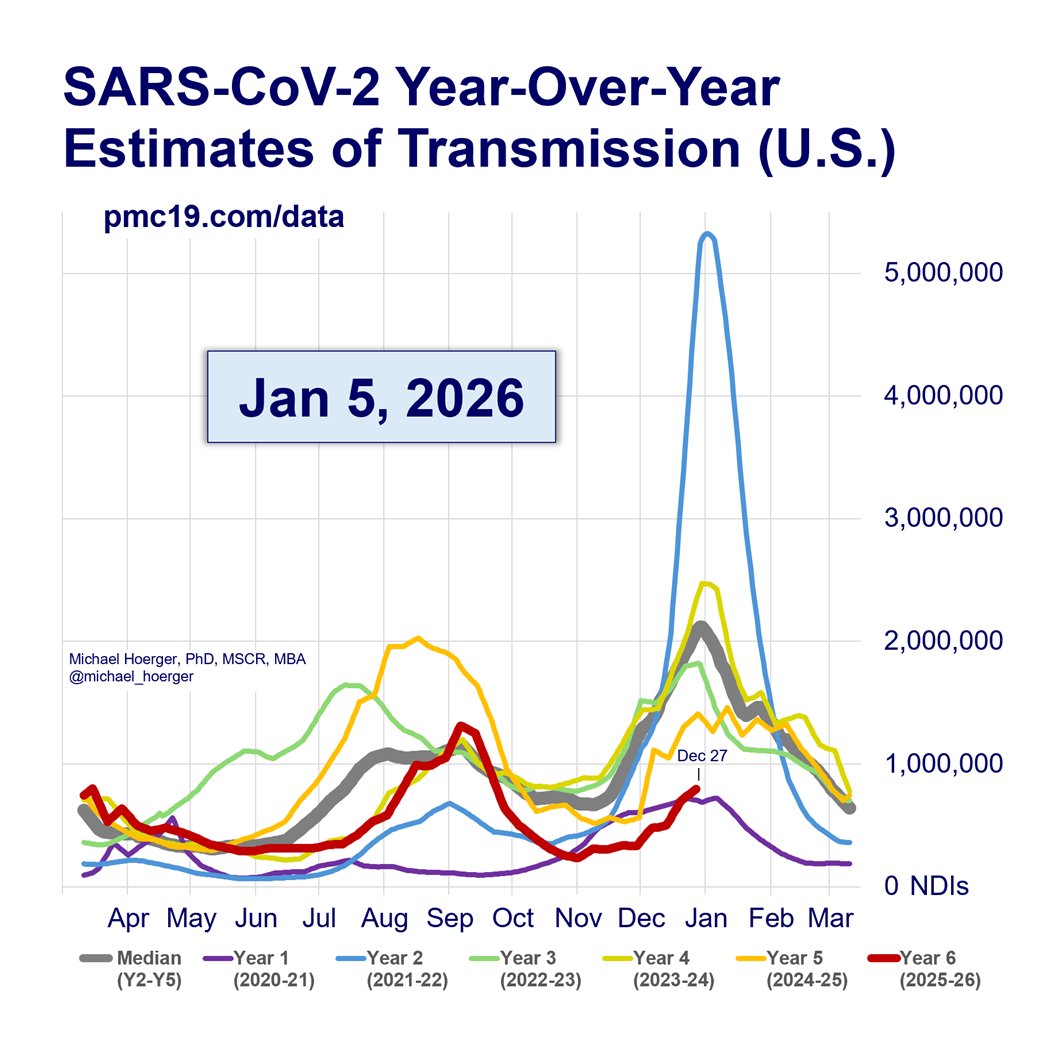
Zooming out to the full pandemic, you can see that we are entering the 8th wave.
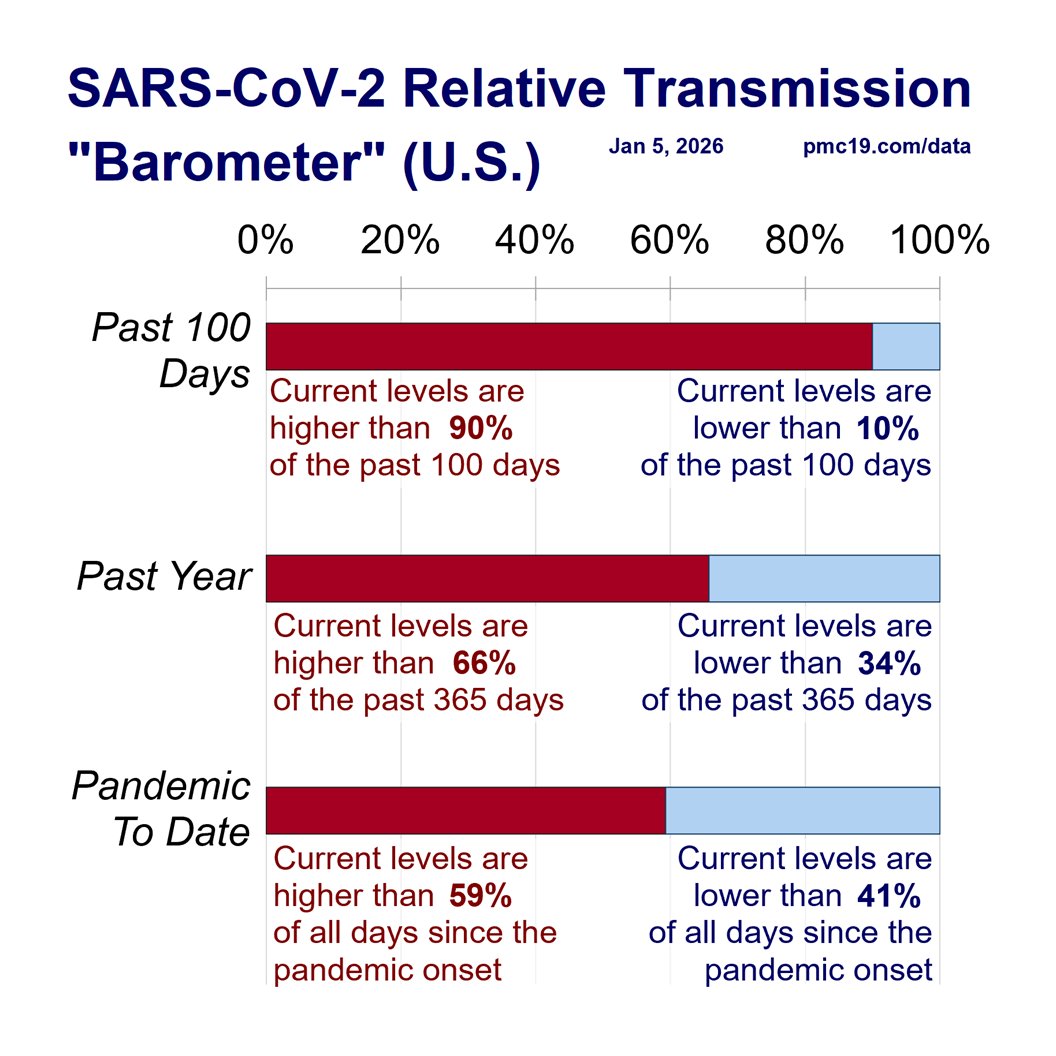
Today, there is more transmission than during 50.6% of pandemic days. It's a coin toss as to whether any particular day of the pandemic has had more or less transmission than today. 😷💉
3/
Today, there is more transmission than during 50.6% of pandemic days. It's a coin toss as to whether any particular day of the pandemic has had more or less transmission than today. 😷💉
3/

Although we're about to exit the valley between the 7th & 8th waves, transmission is still very high. Large groups amplify transmission.
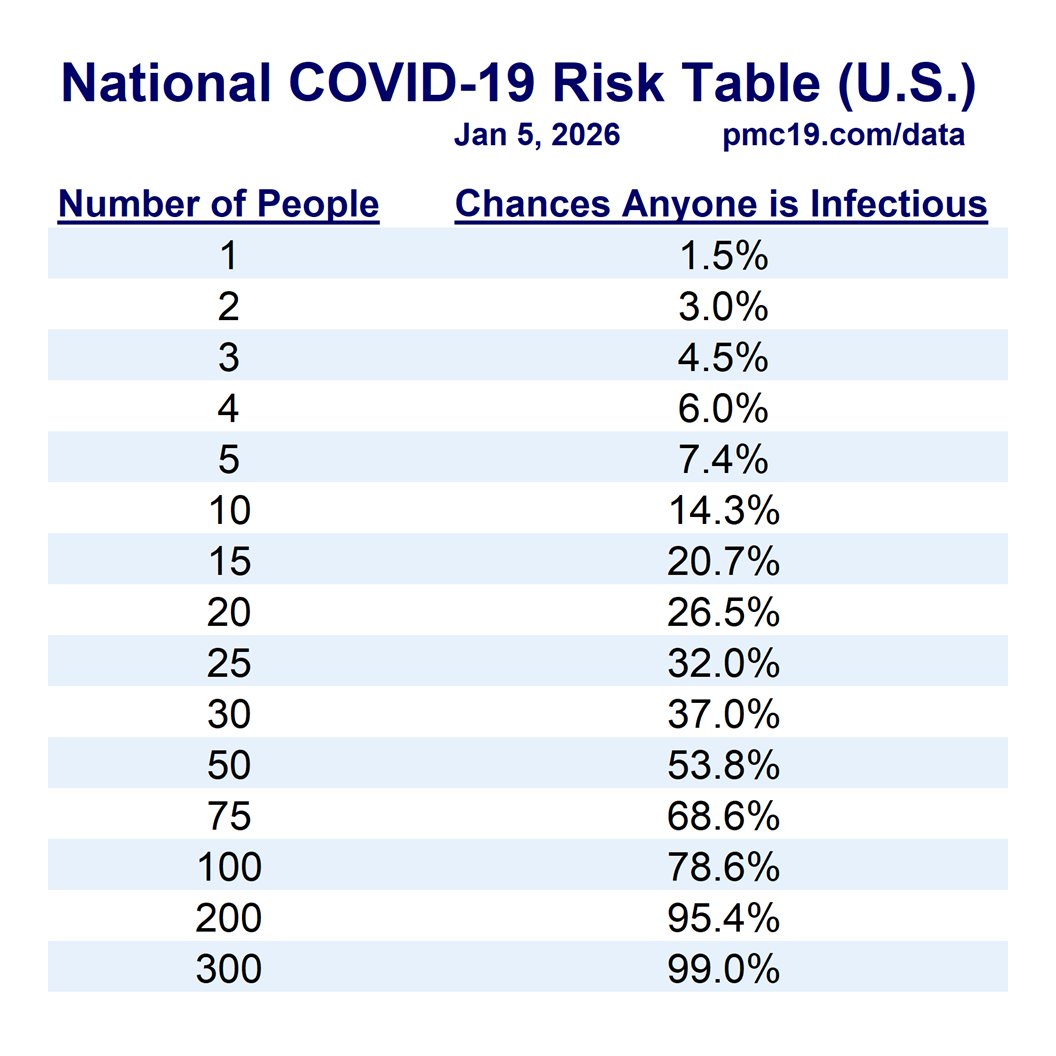
For example, in a group of 20-25, there's about a 25% chance someone would have infectious C19. In a large lecture hall, it's assumed.
4/
For example, in a group of 20-25, there's about a 25% chance someone would have infectious C19. In a large lecture hall, it's assumed.
4/

Here's the danger of a Thanksgiving gathering in the U.S. (Nov 23). Many people are finalizing holiday plans now.
In a large family gathering of 15-20 people, there's about a 25% chance someone would be infectious.
I am quite confident in these numbers.
5/
In a large family gathering of 15-20 people, there's about a 25% chance someone would be infectious.
I am quite confident in these numbers.
5/

Here's the possible danger of a Christmas gathering in the U.S. (Dec 25).
I am exceedingly cautious on posting long-range forecasts. They are speculative and do not account for the highly-valuable near-term fluctuations that can occur, particularly if there's an immune-evasive variant. Take these as my best point estimates nearly two months out, for illustrative purposes just so people get an idea of how bad things may be. Many people are booking trips now, so these rough estimates may be useful.
In a small gathering of 9-10 people, there's about a 25% chance someone is infectious. Once you start looking at large family or multi-family gatherings that span 20-25 people, you basically begin to assume someone has infectious C19.
6/

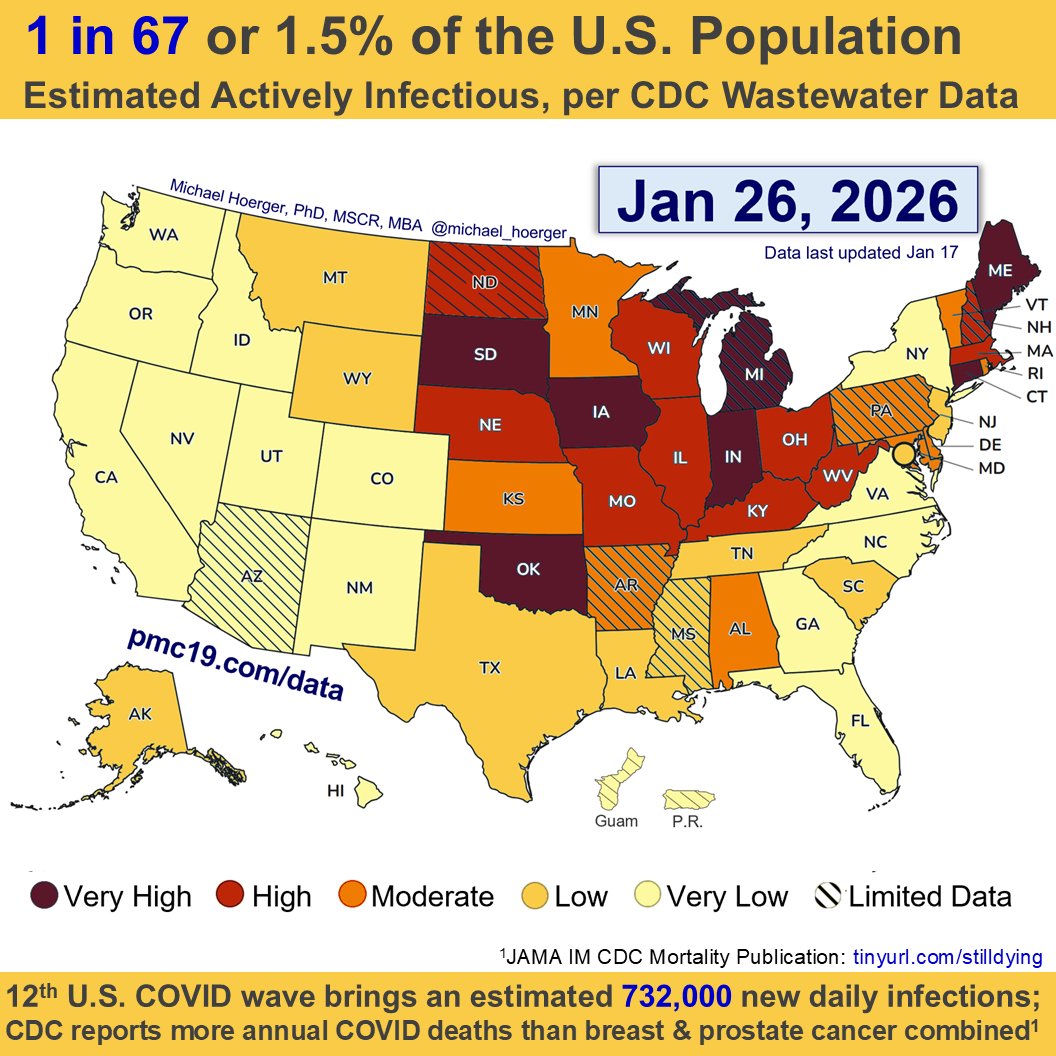
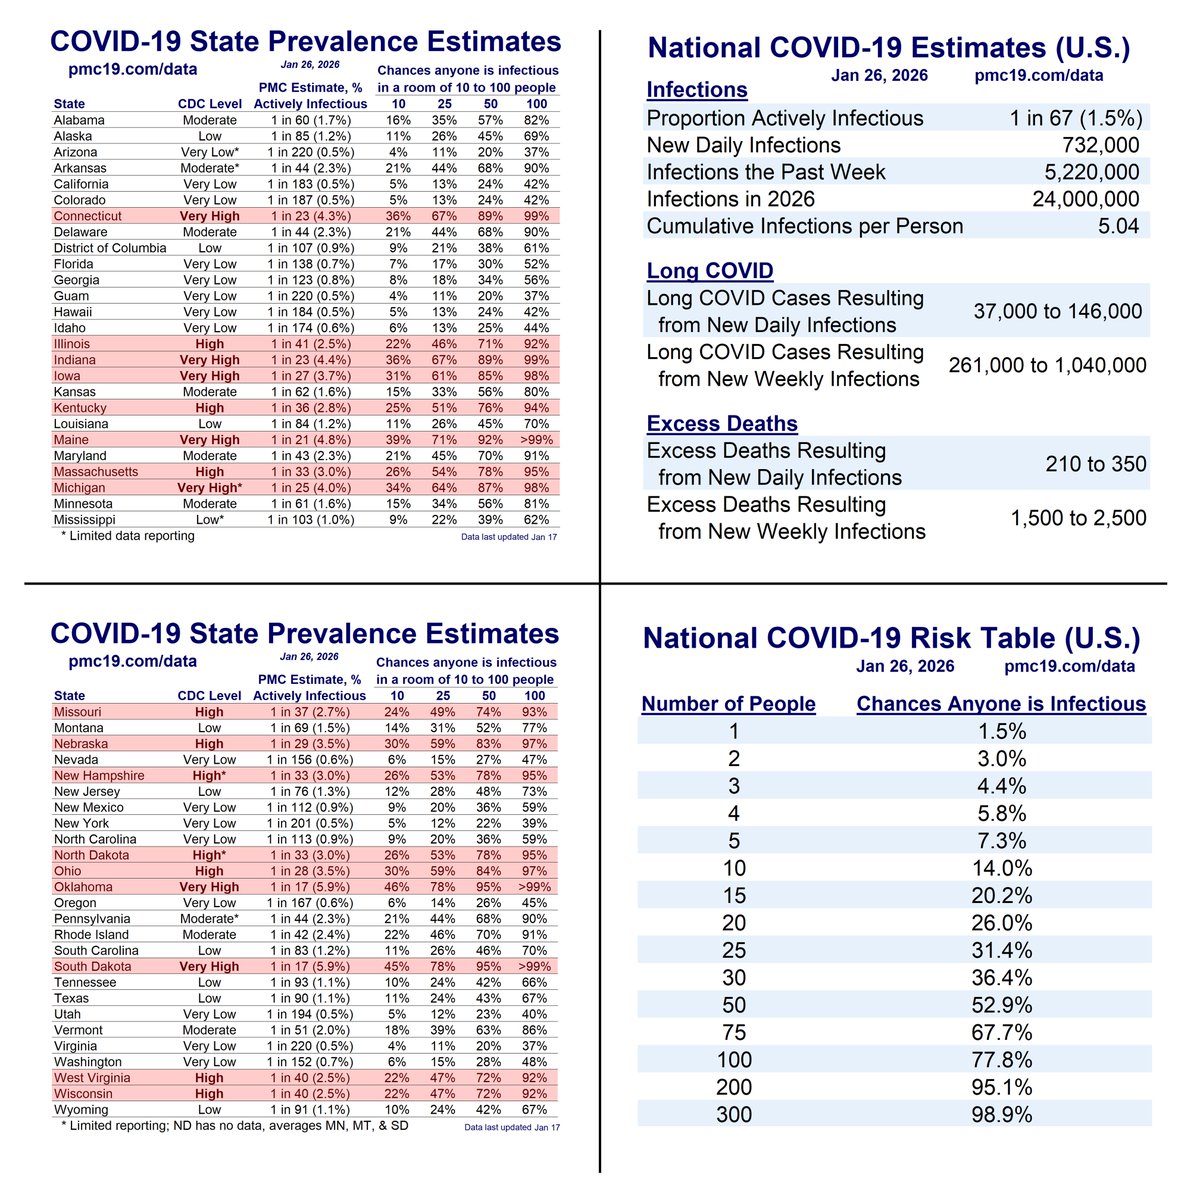
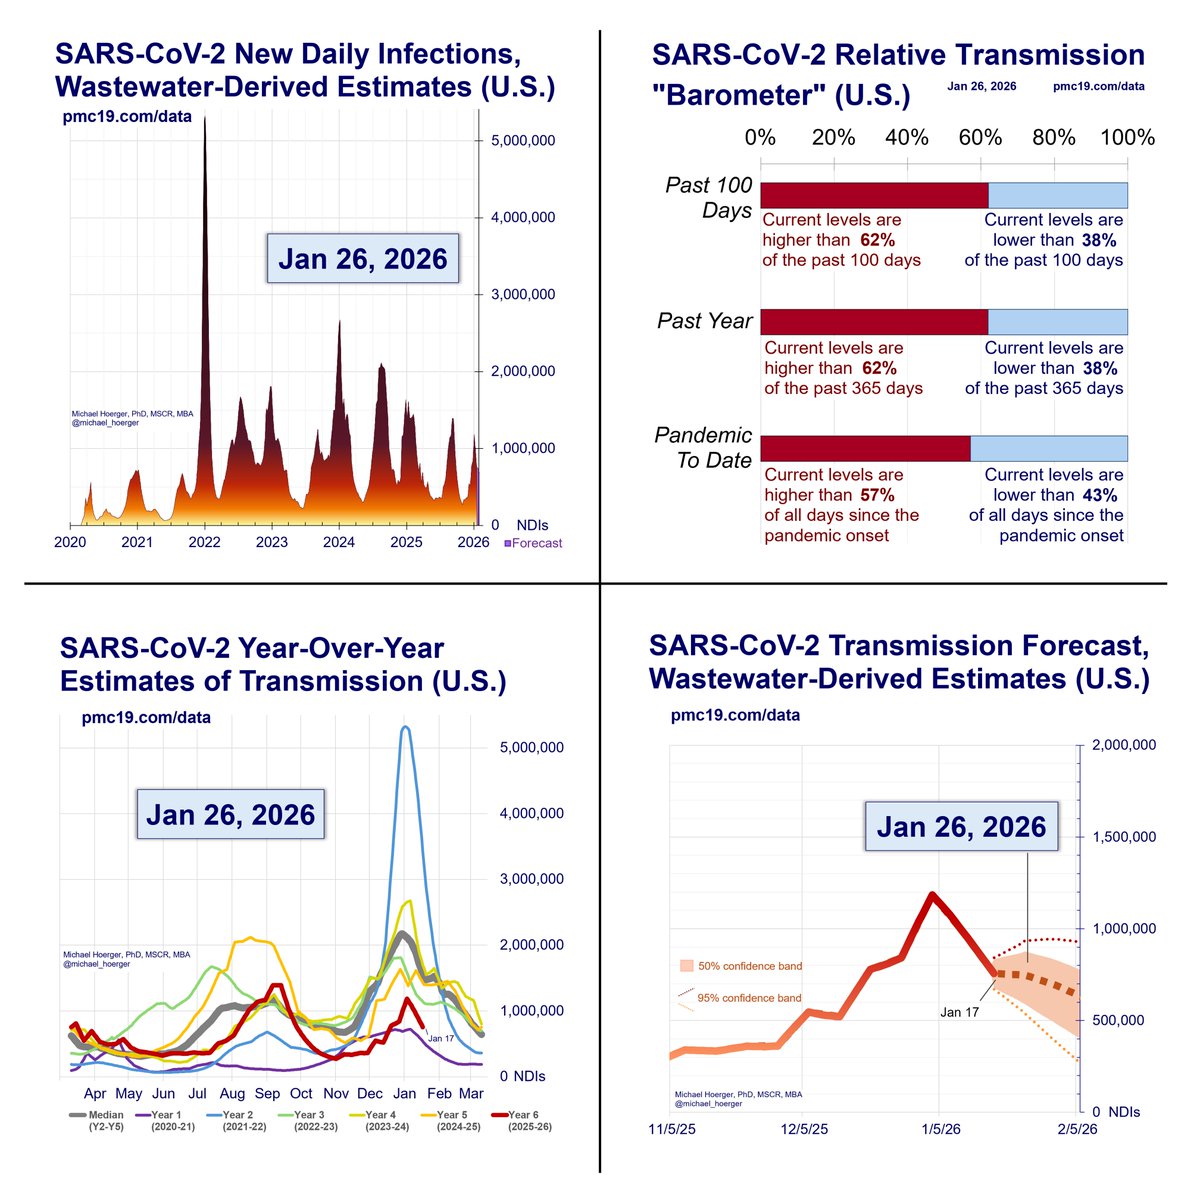
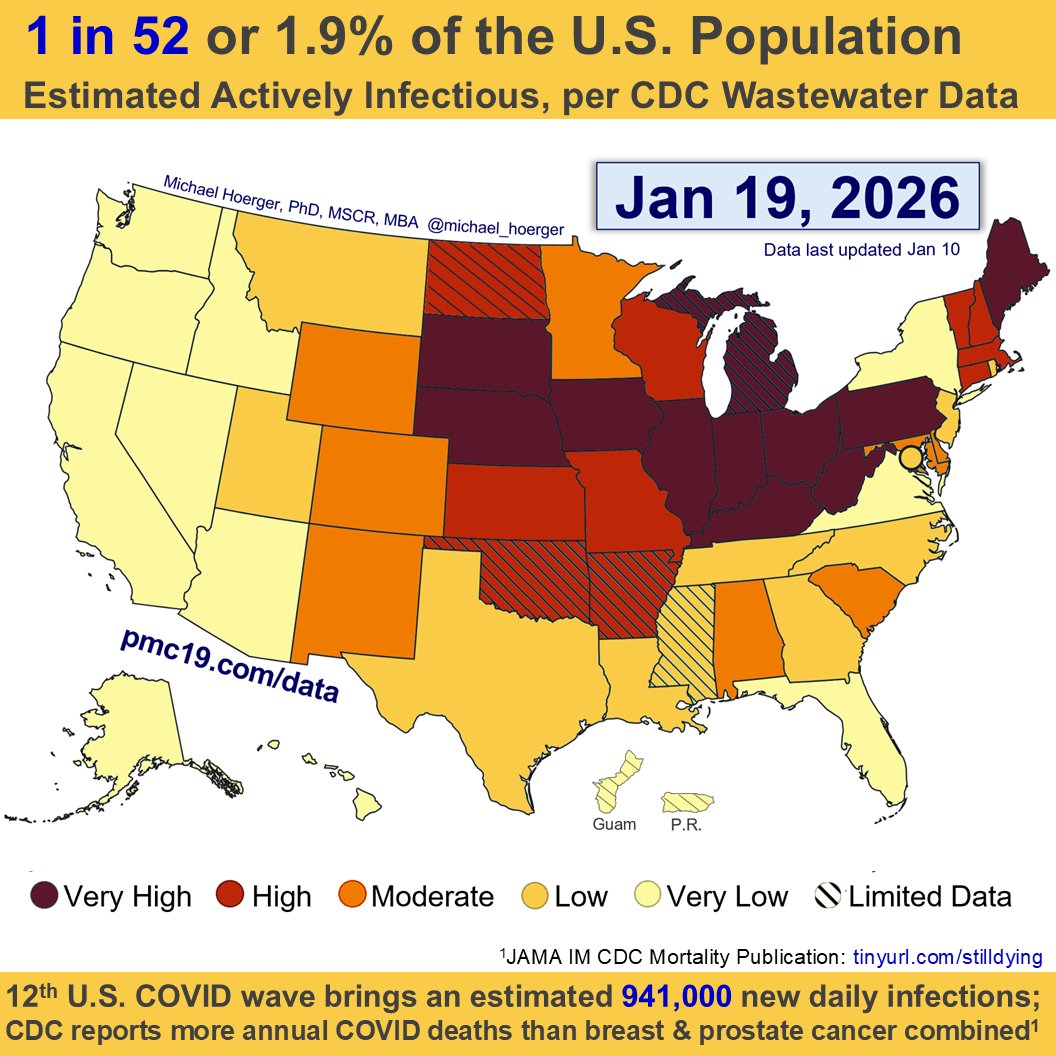
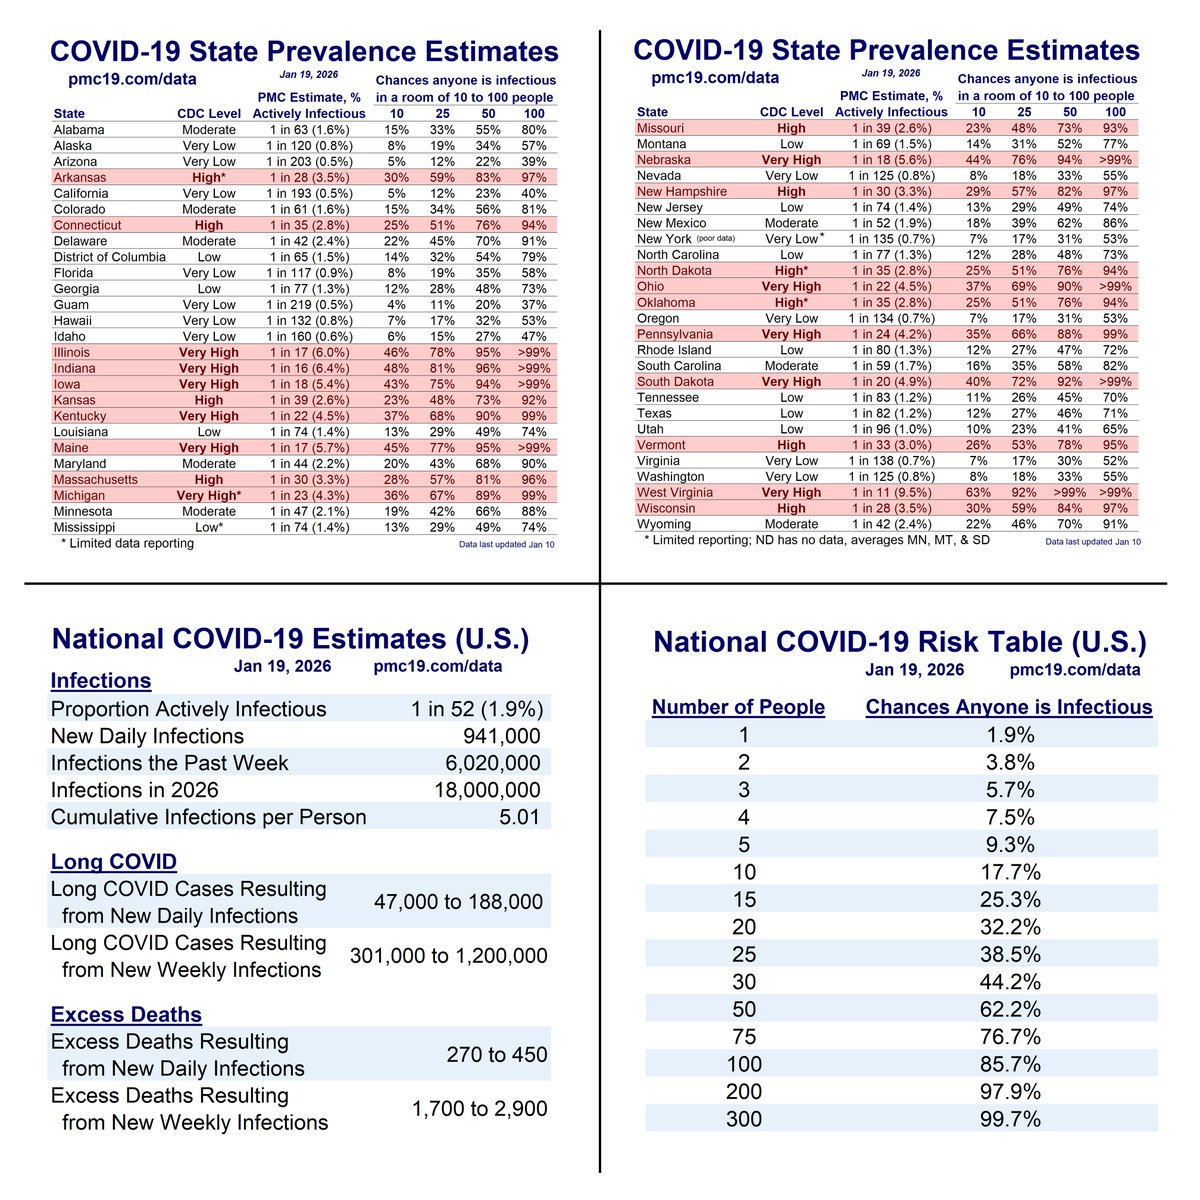
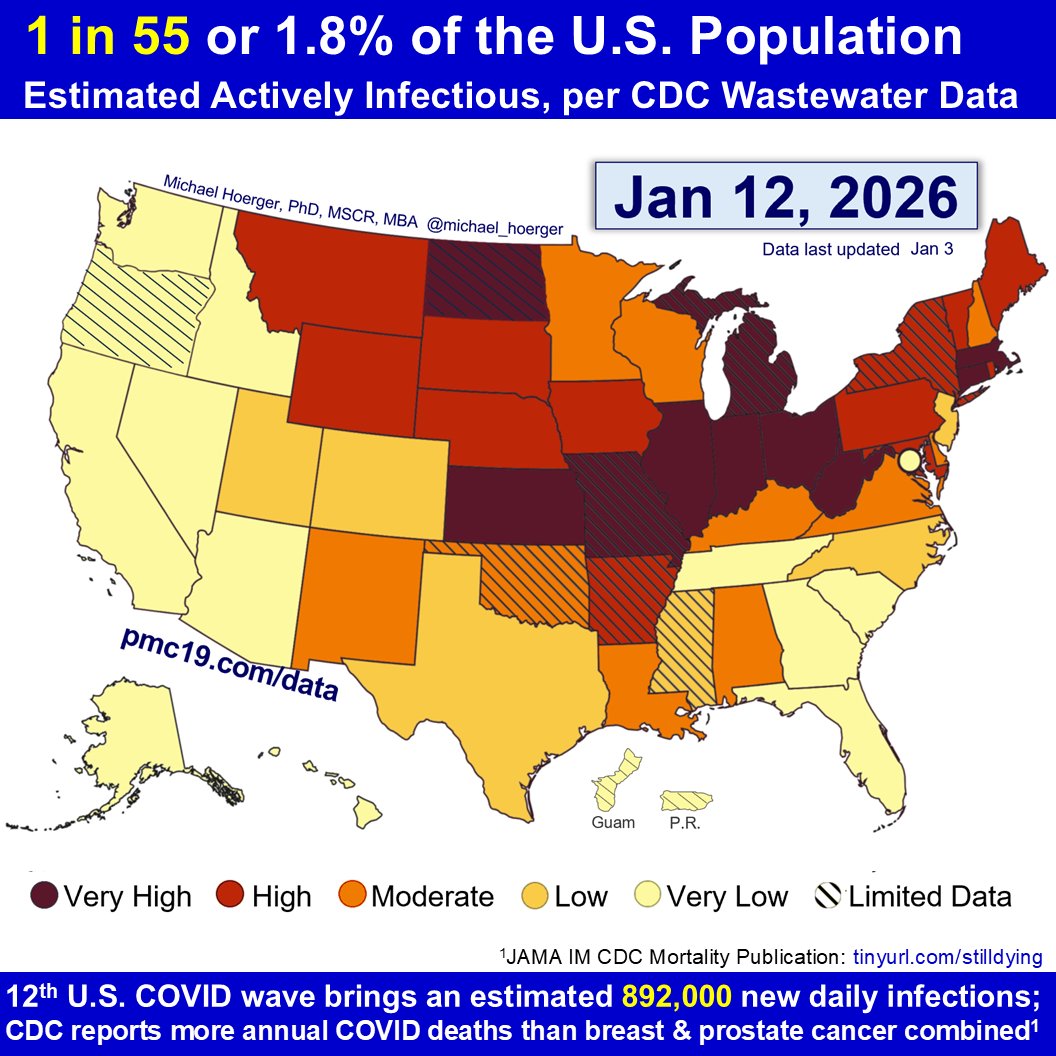
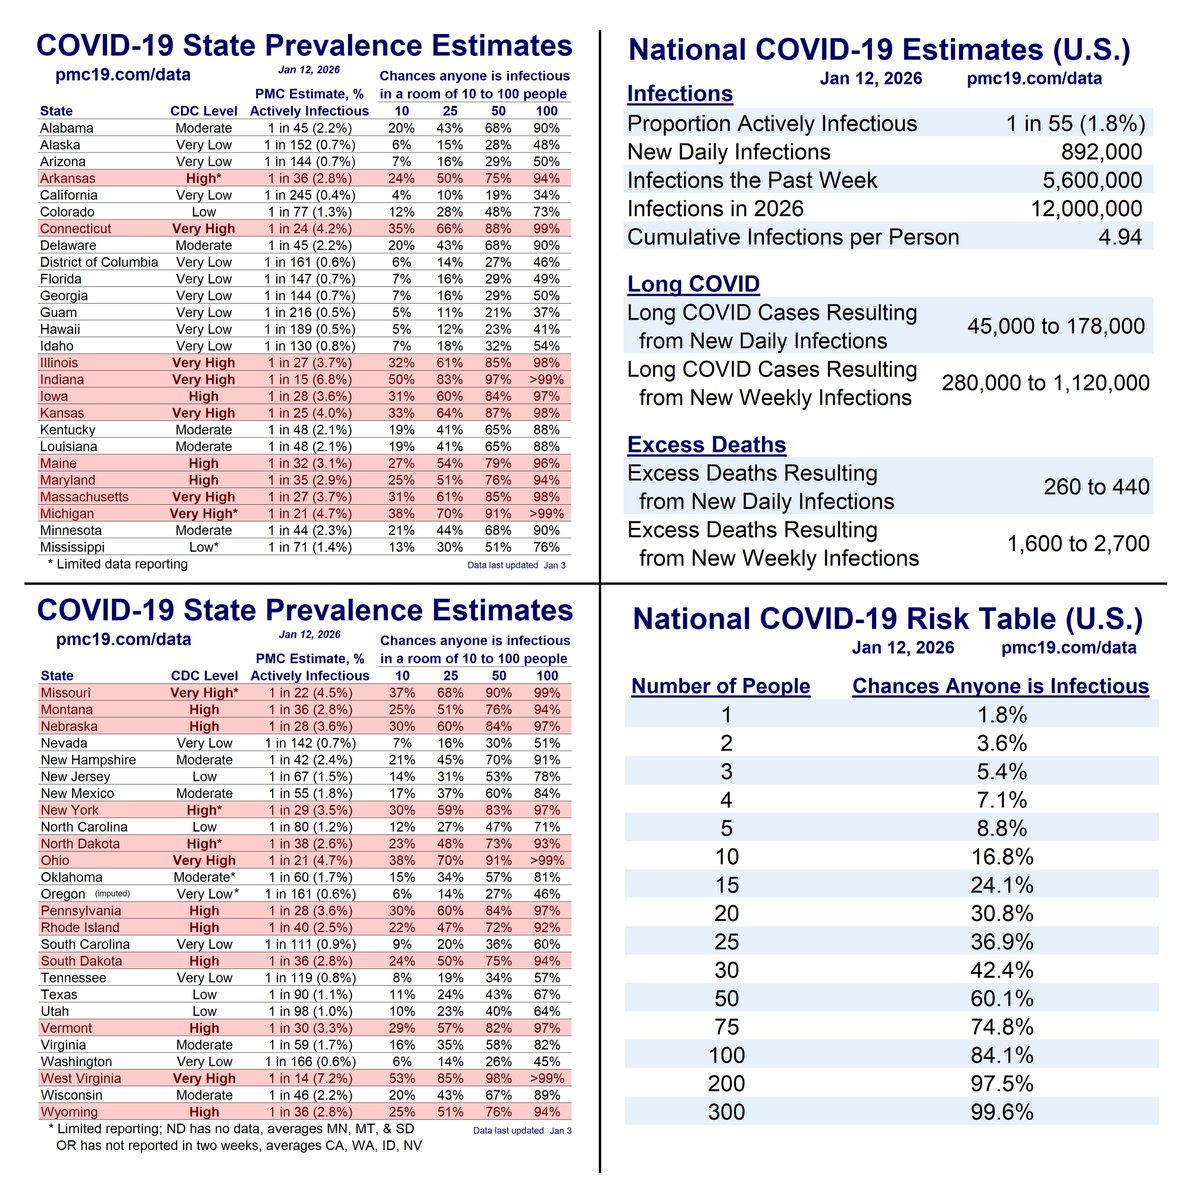
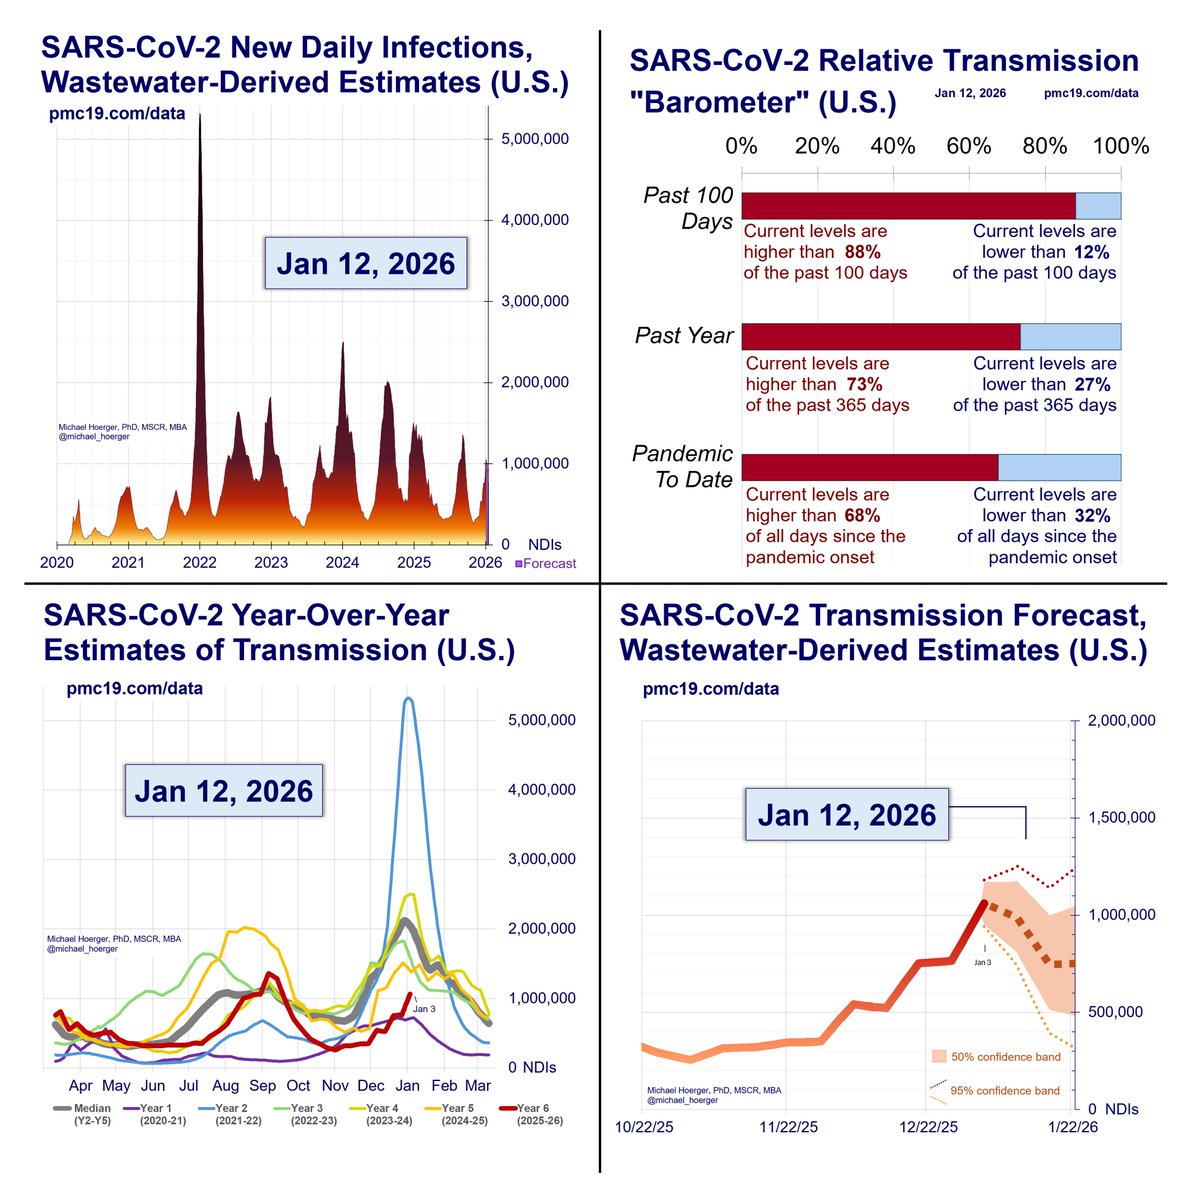
Here's the full PMC Dashboard for Oct 30.
You can read the full report at
Please share across other social media platforms. Much appreciated. 🙏
7/pmc19.com/data

You can read the full report at
Please share across other social media platforms. Much appreciated. 🙏
7/pmc19.com/data

• • •
Missing some Tweet in this thread? You can try to
force a refresh


