I started making this just to help figure out some things, but I might as well share it...
Do you want to hear the story of the pandemic in the UK?
Waves, Variants, Lockdowns, Vaccines, and Stuff
🌊🦠🔐💉
🗺️And where we're going in the next three months.
Do you want to hear the story of the pandemic in the UK?
Waves, Variants, Lockdowns, Vaccines, and Stuff
🌊🦠🔐💉
🗺️And where we're going in the next three months.
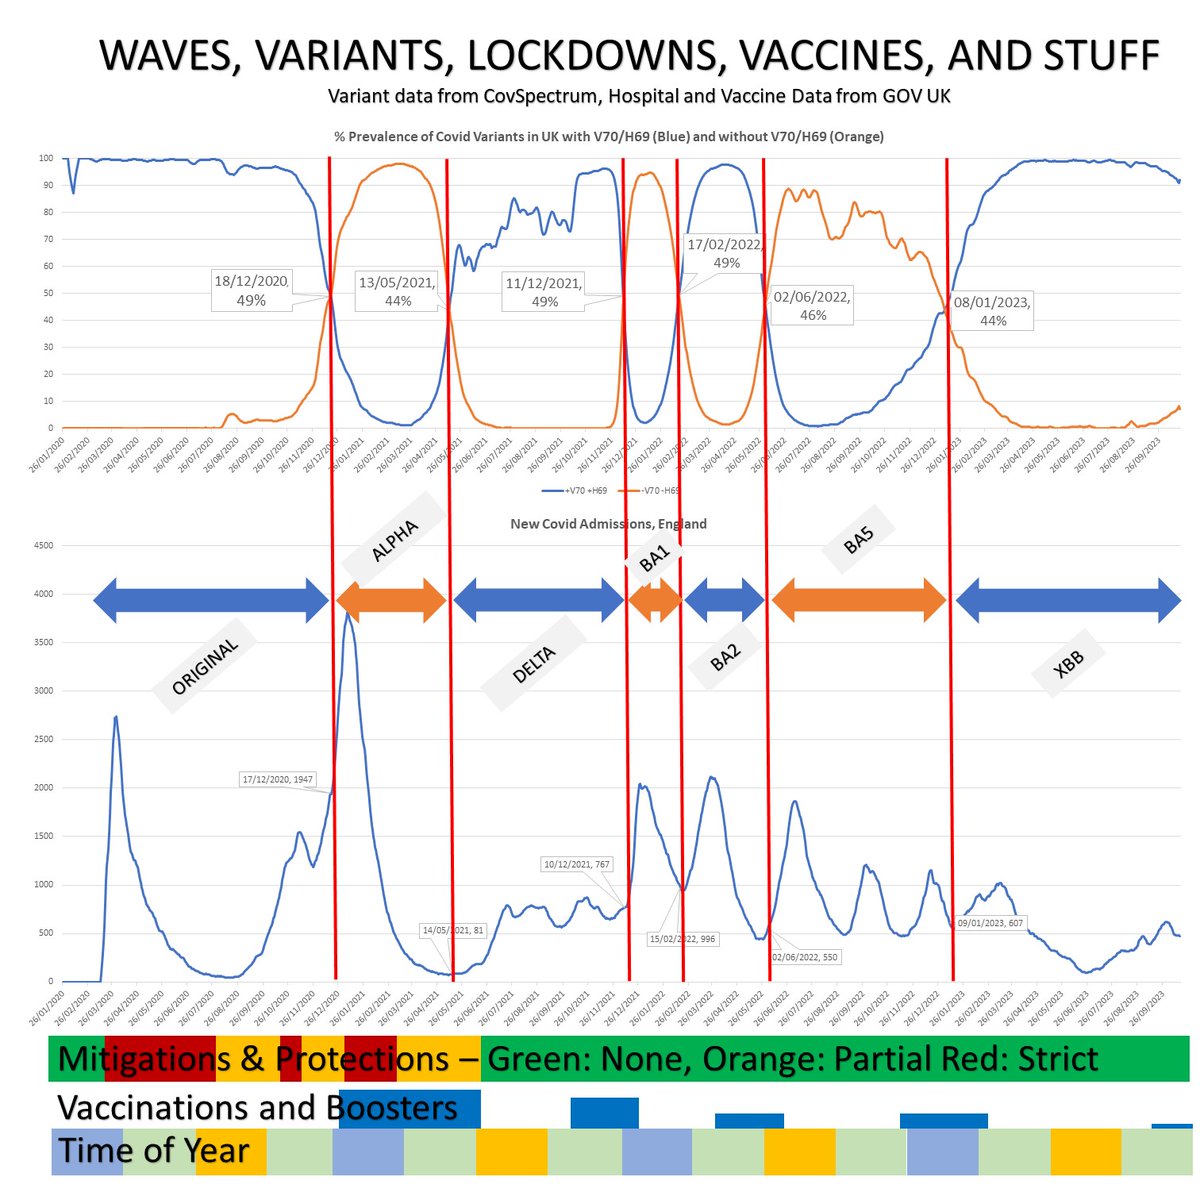
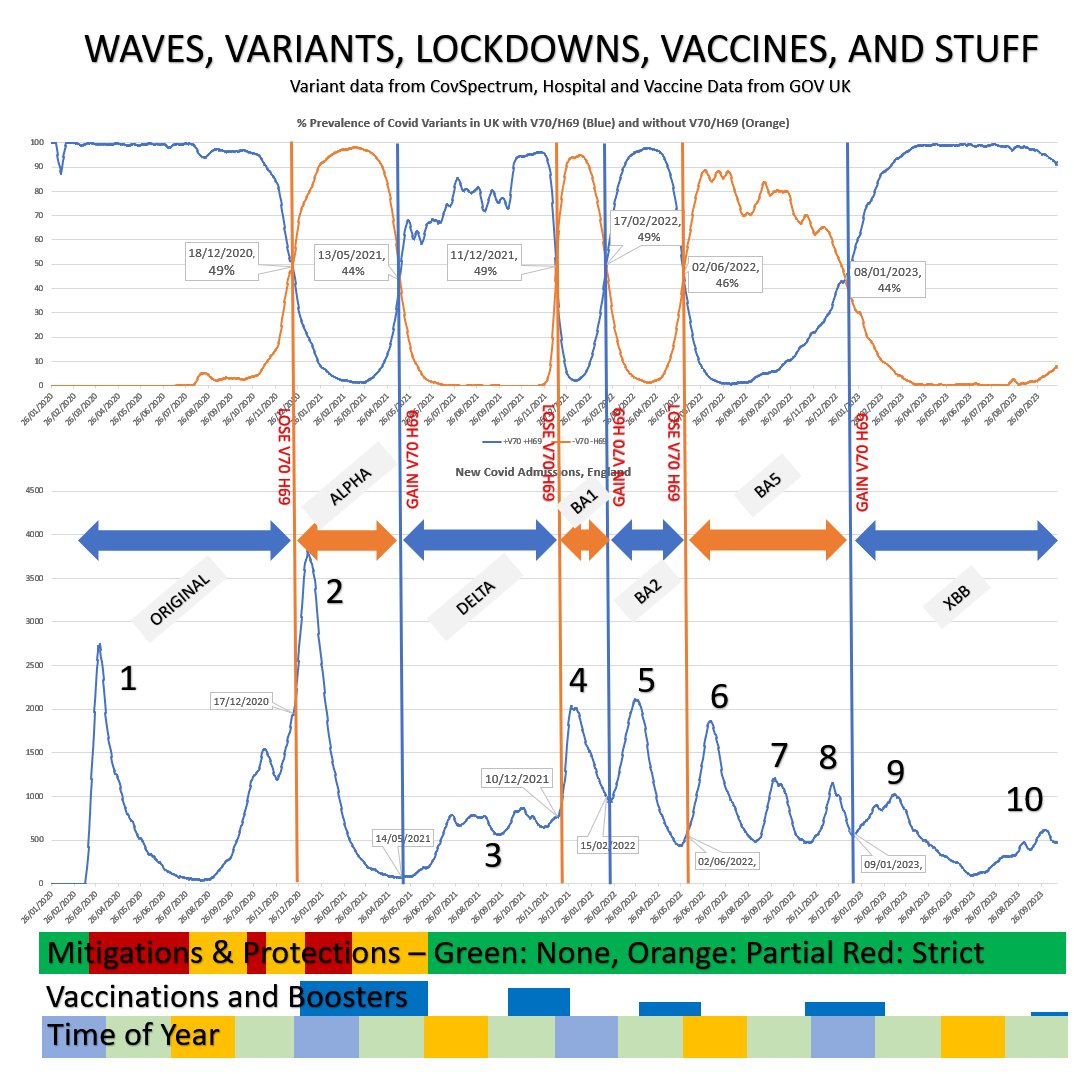
Starting with that first wave, that's nice and easy.
It started with the introduction of the original strain to the UK.
Hospitalisations began to go through the roof, in came a load of strict measures (red at the bottom) to clamp things down, cases fell.
It started with the introduction of the original strain to the UK.
Hospitalisations began to go through the roof, in came a load of strict measures (red at the bottom) to clamp things down, cases fell.

So... Wave 1:
Cause: Original strain
Ended by: Mitigations and Protections
Cause: Original strain
Ended by: Mitigations and Protections
Wave 2 starts with a relaxing of restrictions.
There's not enough infection based immunity around to stop a big surge as things relax.
There's not enough infection based immunity around to stop a big surge as things relax.

A tiny dent is put in hospitalisations by a few temporary local and national restrictions, but Boris wants to pile the bodies high and save Christmas, so... 

There's loads happening now.
It's coming towards Winter, so folk are inside more with windows and doors shut.
There's a new variant called Alpha - you can actually see the point where the gradient changes as it takes over if you look carefully.
It's coming towards Winter, so folk are inside more with windows and doors shut.
There's a new variant called Alpha - you can actually see the point where the gradient changes as it takes over if you look carefully.
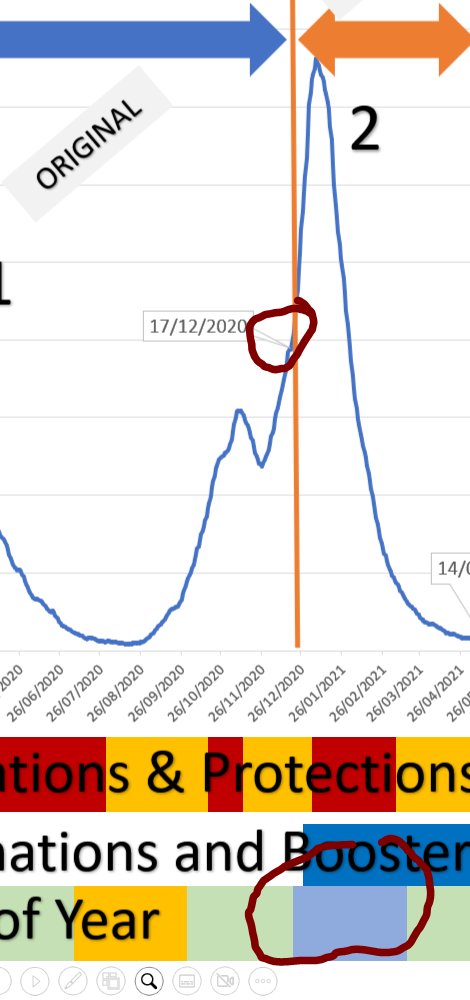
But then you have vaccines introduced, some strict lockdown measures, and a load of infection based immunity. Kids especially. Schools were hammered by Covid that Christmas, and then they were locked down after, and they're one of the principle drivers of Covid transmission. 

Meanwhile, Covid started one of its tricks - repeatedly losing and gaining a part of the protein spike that seems to help evade existing immunity. 

So this bit at the top tracks those changes.
It's the percentage of total sequences in the UK that have V70 and H69 (blue line) and the total of sequences that have lost V70 and H69 (orange)
Covid lost it in Alpha, then gained it again in Delta
It's the percentage of total sequences in the UK that have V70 and H69 (blue line) and the total of sequences that have lost V70 and H69 (orange)
Covid lost it in Alpha, then gained it again in Delta

So Delta gains V70 and H69, and as soon as it starts to dominate, the cases and hospitalisations start to rise again.
Note that this is in the summer.
It's not seasonal.
Note that this is in the summer.
It's not seasonal.

At this point, the only thing holding back Delta is the recent huge vaccination drive and infections based immunity.
There are no protections in place other than vaccinations, and the result is a low messy plateau.
There are no protections in place other than vaccinations, and the result is a low messy plateau.

But guess what.
Here comes the switch.
Covid loses V70 and H69, and the pedal goes to the floor.
Here come the twins, first BA.1 without V70 and H69, and then BA.2 with them.
Look when the waves start.
Here comes the switch.
Covid loses V70 and H69, and the pedal goes to the floor.
Here come the twins, first BA.1 without V70 and H69, and then BA.2 with them.
Look when the waves start.

Is Covid becoming seasonal at this point?
That was a long hard winter, that lasted most of the year.
That was a long hard winter, that lasted most of the year.

The third wave of the year, as BA5 arrives having lost V70 and H69 again.
It's there right in the middle of the summer.
It's there right in the middle of the summer.

We then have a long messy triple wave autumn 2022 as BA5 tries out some new formulations including BQ*, but throughout the end of the year, it remains mostly without V70 and H69. 

Meanwhile, a smaller and smaller proportion of the population are getting vaccinated or boostered in each new campaign. 

Guess what Covid does next...
Yep.
The switch up, and there's V70 and H69 back, and a new wave at precisely the point XBB dominates.
Neat, isn't it?
Yep.
The switch up, and there's V70 and H69 back, and a new wave at precisely the point XBB dominates.
Neat, isn't it?

There are a lot of antibodies and experienced immune systems around at this point, so as XBB sticks around and tries out some neat new combinations, it doesn't cause massive waves... but the government don't help us with knowing exactly what's going on, because they wind down testing and reporting, so I don't think hospitalisations actually dropped as far as they claimed.
I may be wrong on that, but I keep seeing people in hospital with Covid who don't have Covid on their chart, so I'm sceptical.
I reckon hospitalisations may be nearer my shonky green line below.

I may be wrong on that, but I keep seeing people in hospital with Covid who don't have Covid on their chart, so I'm sceptical.
I reckon hospitalisations may be nearer my shonky green line below.

And that's where we are now.
Wave 10, by my count, if you don't include the little ripples.
Covid has been dominating with V70 and H69 for about ten months so... guess what's going to happen next...
Wave 10, by my count, if you don't include the little ripples.
Covid has been dominating with V70 and H69 for about ten months so... guess what's going to happen next...

Yep.
BA.2.86* Pirola, and a couple of other unrelated variants have discovered that they have an advantage without V70 and H69.
Our bodies are forgetting how to recognise it without them, so it's spreading faster.
BA.2.86* Pirola, and a couple of other unrelated variants have discovered that they have an advantage without V70 and H69.
Our bodies are forgetting how to recognise it without them, so it's spreading faster.

Here in the UK, Covid without V70 and H69 is "currently" on about 10% of sequences, but you shouldn't need me to circle the other parts of the chart where it has done this before. It takes between ten and forty days to get from 10% to dominance. 

It's winter.
There are no protections or mitigations in place.
Hardly anyone's getting vaccinated.
Immunity via infection is ineffective and waning.
And the switch up is coming some time in the next month.
There are no protections or mitigations in place.
Hardly anyone's getting vaccinated.
Immunity via infection is ineffective and waning.
And the switch up is coming some time in the next month.

Oh yeah.
One more thing.
You spotted me putting the word "currently" in speech marks, didn't you?
One more thing.
You spotted me putting the word "currently" in speech marks, didn't you?
I say that BA.2.86* is "currently" on about 10%.
That's from the latest available data.
That's from the latest available data.
And the latest available data is more than a couple of weeks old.
So that switcheroo may be hitting any day.
Or maybe it'll all just go away... 🦄🌈🏳️🌈🎇
And, of course, you'll notice that I used hospitalisations for the graph.
But they're probably just mild hospitalisations, right?
But they're probably just mild hospitalisations, right?
I've got a few more notes and observations to add in the morning.
If you have any thoughts, comments, or questions, fire away!
If you have any thoughts, comments, or questions, fire away!
So here's a new version, with an extra little snippet in there... positivity.
This is the proportion of all covid PCR tests that come out positive.
This is the proportion of all covid PCR tests that come out positive.

You can see that the shape of the red positivity line generally tracks with the blue hospitalisations line in terms of the timing of the peaks. 
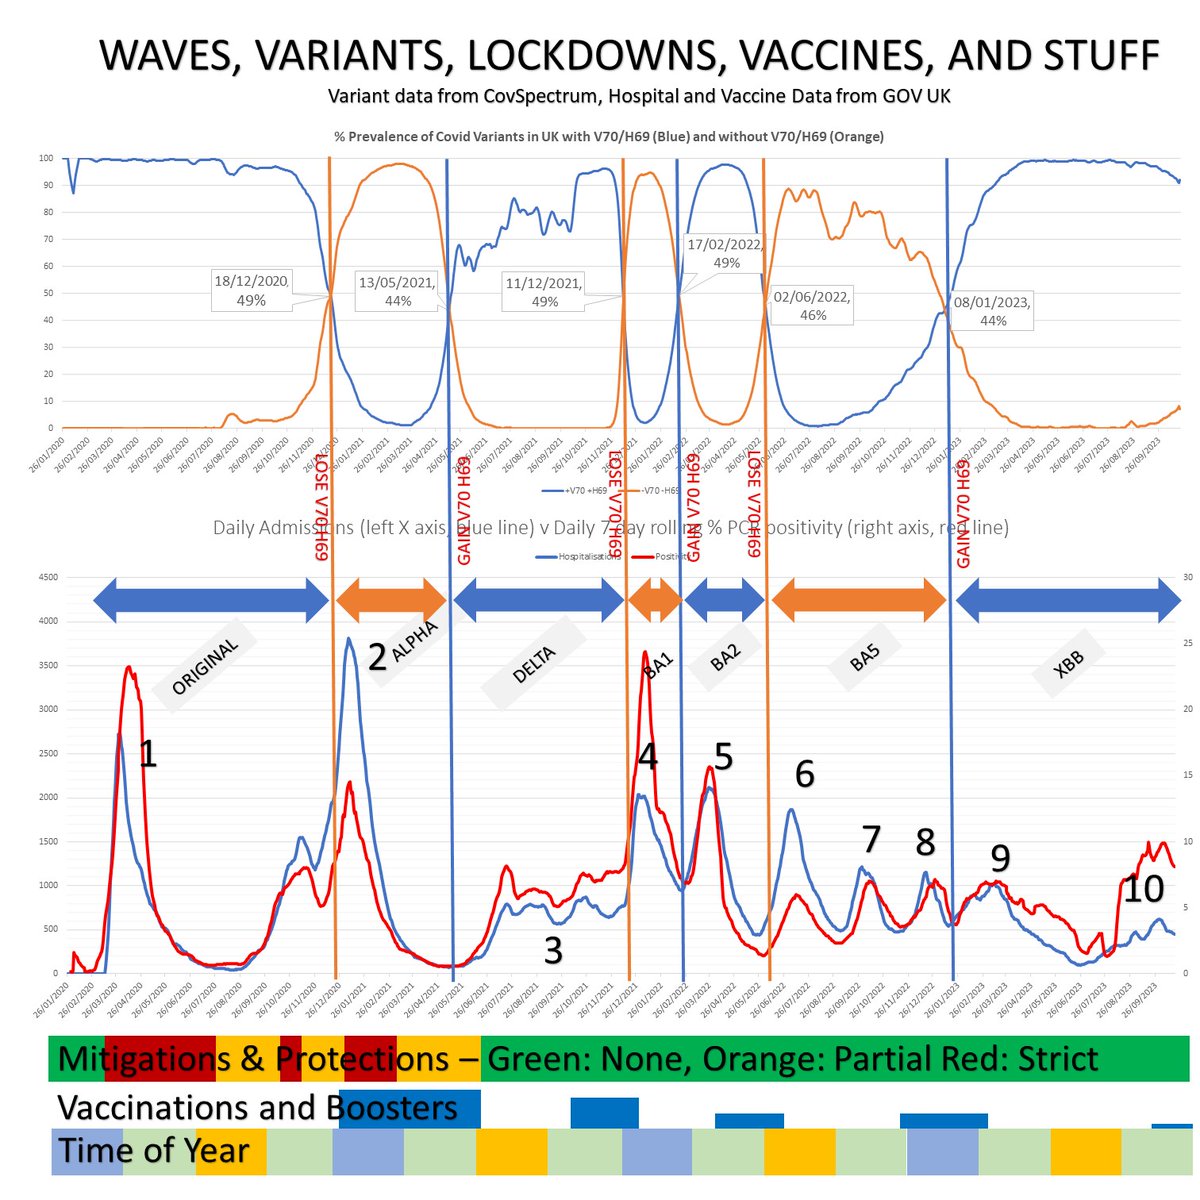
I didn't add it to the first edition because I was mostly looking at the timings of the waves, and this doesn't add any detail to help understand the timings.
But it does give a small bit of extra perspective on the effect of reduced testing over the last 18 months.
Imagine the difference between testing everyone in a town to see if they have naturally blonde hair, and testing only the people who have blonde hair.
If you test everyone, you might get 2 out of 10 positive for being naturally blonde.
If you test only the people who look blonde, it might be 5 out of 10 natural, and the rest out of a bottle.
If you test only the people who look blonde, it might be 5 out of 10 natural, and the rest out of a bottle.
That's what's happening with testing.
Formerly, hospitals were testing lots of people who came in, even if they didn't look like they had classic covid symptoms.
Formerly, hospitals were testing lots of people who came in, even if they didn't look like they had classic covid symptoms.
Now, they're testing fewer people, primarily people who might benefit from covid treatments.
If you can't help them, why test them?
And they're testing in relation to fewer symptoms - the classic 'respiratory virus' symptoms, not all the symptoms covid can actually cause.
If you can't help them, why test them?
And they're testing in relation to fewer symptoms - the classic 'respiratory virus' symptoms, not all the symptoms covid can actually cause.
So the relationship between people being admitted to hospital and the proportion of people who are testing positive is changing. 

But that wasn't really relevant to my original thread, because that's about timings.
Here's part of the original thread...
What makes the different waves go up and down?
What determines how high they go?
What determines their starting point and ending point?
What makes the different waves go up and down?
What determines how high they go?
What determines their starting point and ending point?
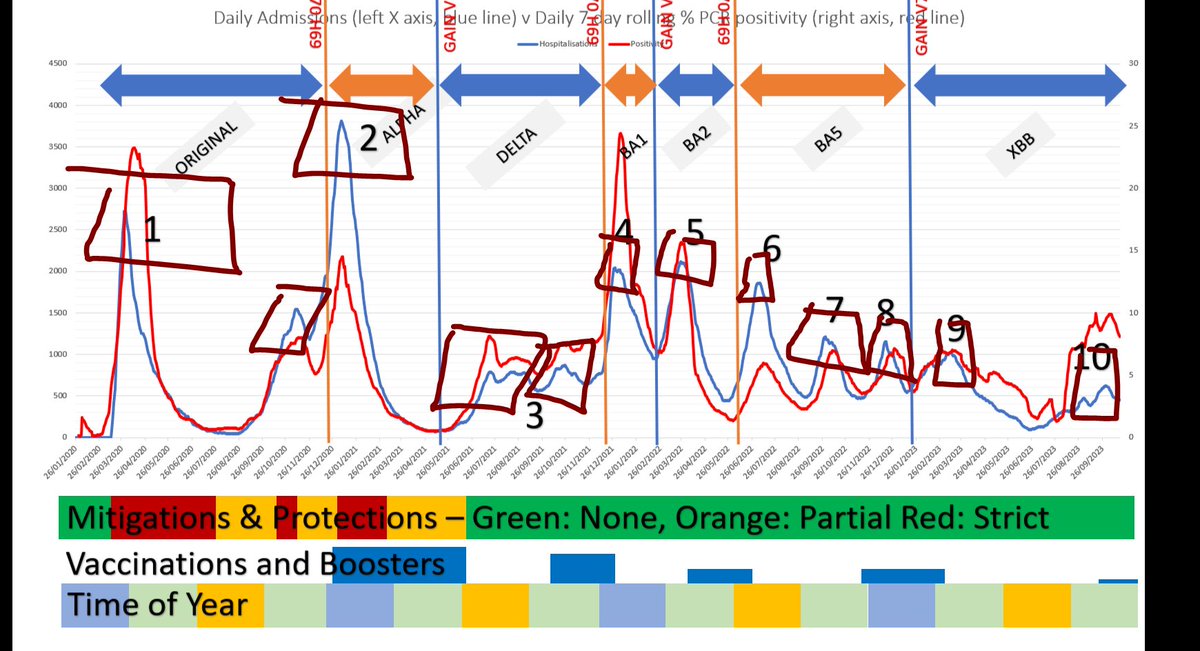
We only had two waves (and a wavelet) that were stopped by mitigations, waves 1 and 2, original and alpha.
Vaccines may have also had a hand in bringing down admissions too.
Vaccines may have also had a hand in bringing down admissions too.

They were both *stopped*.
They didn't reach a limit of susceptible people, they were stopped by mitigations.
But that's the point at which everything changes.
They didn't reach a limit of susceptible people, they were stopped by mitigations.
But that's the point at which everything changes.

From here on out, we're into the green zone of no mitigations, and we're relying on the blue bursts of boosters, and infection-based-immunity, which is like concussion-based-clarity. 
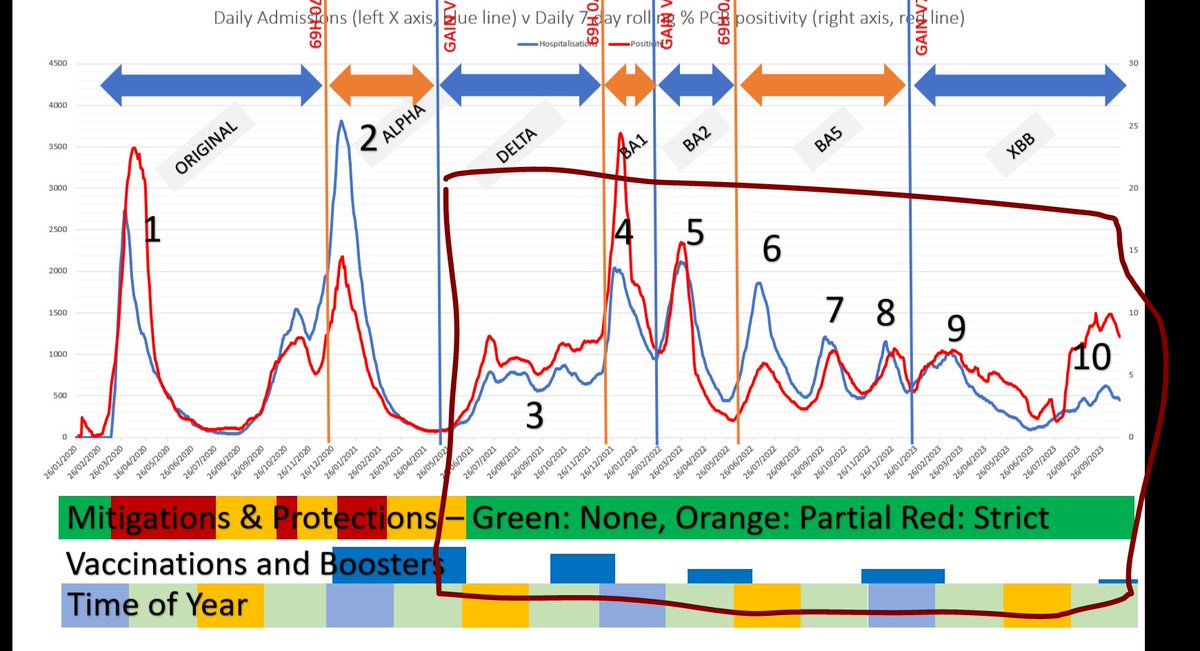
This section is entirely a fight between the evolving virus and your immune system.
How good is your immune system at spotting new variants?
How good is your immune system at not over-reacting?
How good is the virus at evading your immunity?
How good is your immune system at spotting new variants?
How good is your immune system at not over-reacting?
How good is the virus at evading your immunity?

But don't think that those repeat infections are beneficial because they'll help you recognise it.
It's like going blindfold into a boxing ring, and getting punched in the face to recognise the difference between a haymaker and a left jab.
It's like going blindfold into a boxing ring, and getting punched in the face to recognise the difference between a haymaker and a left jab.
You might learn how to distinguish between the different punches, but each new punch makes you more concussed.
And while the hospitalisations for acute covid infections might appear to go down (I think there was a slight lull this summer, that has risen again since) because testing is reduced, we know that there is massive overwhelming demand for healthcare in the UK now.
Each month is now the busiest of that month ever for a&e attendances.
Countries around the world are starting to count the astonishing rise in autoimmune disorders that I think are caused by Covid infections.
Countries around the world are starting to count the astonishing rise in autoimmune disorders that I think are caused by Covid infections.
So are things getting better?
While people keep getting reinfected, I think the answer is no.
While people keep getting reinfected, I think the answer is no.
I guess we're going to find out how well that's working with the next switch up and BA.2.86* Pirola and its variant kids.
Two more things from the chart...
A period of variant dominance caused by a V70/H69 gain or loss, doesn't lead to a sustained wave for the whole of the dominance.
The peak comes soon after the switch.
A period of variant dominance caused by a V70/H69 gain or loss, doesn't lead to a sustained wave for the whole of the dominance.
The peak comes soon after the switch.

In fact, the peak often comes very soon after the switch, most of the time within a month of the crossover. 

There are a couple of exceptions there, but I'm guessing the next peak will come within a month or so of the next crossover here.
And another thing here... there are a couple of summer lulls, and that's great, but this is not 'becoming a seasonal virus' as the monkeys like to say.
Weather may have a slight effect on the situation, but it's mostly to do with existing immunity, waning immunity, immunity evasion, and possibly immunity damage now.
Have a look at a 20 month section of the pandemic.
At any point, the line shows how many people had been admitted in the previous 90 days.
I've not put the dates along the bottom on purpose.
At any point, the line shows how many people had been admitted in the previous 90 days.
I've not put the dates along the bottom on purpose.
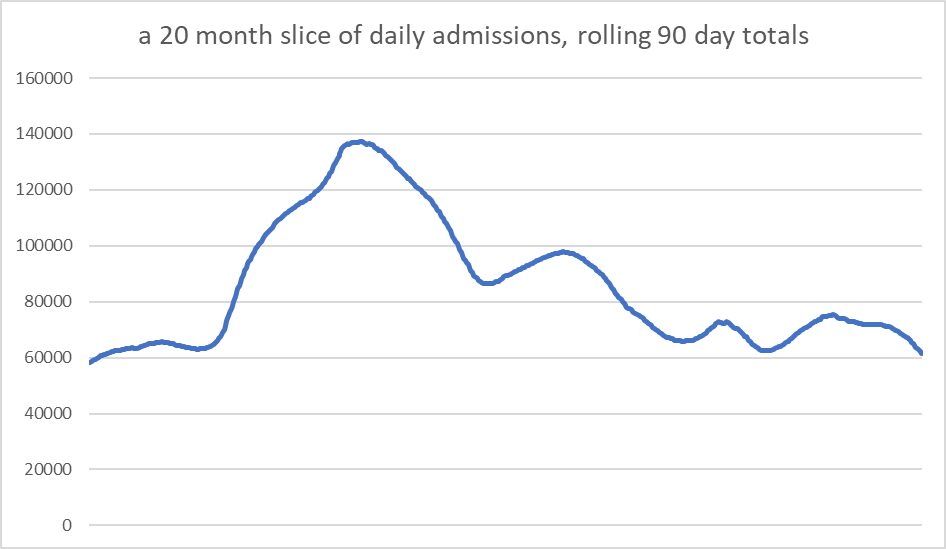
You can't, can you?
Here are the rolling 90 day admissions totals for the whole pandemic, bearing in mind that the section in the box is suffering from the aforementioned reduced testing.
Remember, those first two waves were stopped by mitigations.
Remember, those first two waves were stopped by mitigations.

It's almost all about the virus vs your immune system now.
And honestly, I think that if you're backing your immune system, then you're backing the wrong horse.
And honestly, I think that if you're backing your immune system, then you're backing the wrong horse.
• • •
Missing some Tweet in this thread? You can try to
force a refresh


