Weekly deaths in Alberta are still trending higher than statistically expected. Here's data up to Sept 2, 2023. (updated Nov 9, 2023). The orange line is the number of weekly expected deaths. This fluctuates, and usually goes down in the summer months. The blue line is the actual number of weekly deaths. Between 60-85 Albertans more than normal are dying every week. That's a 10-12% increase since the COVID vaccine roll out.
1/
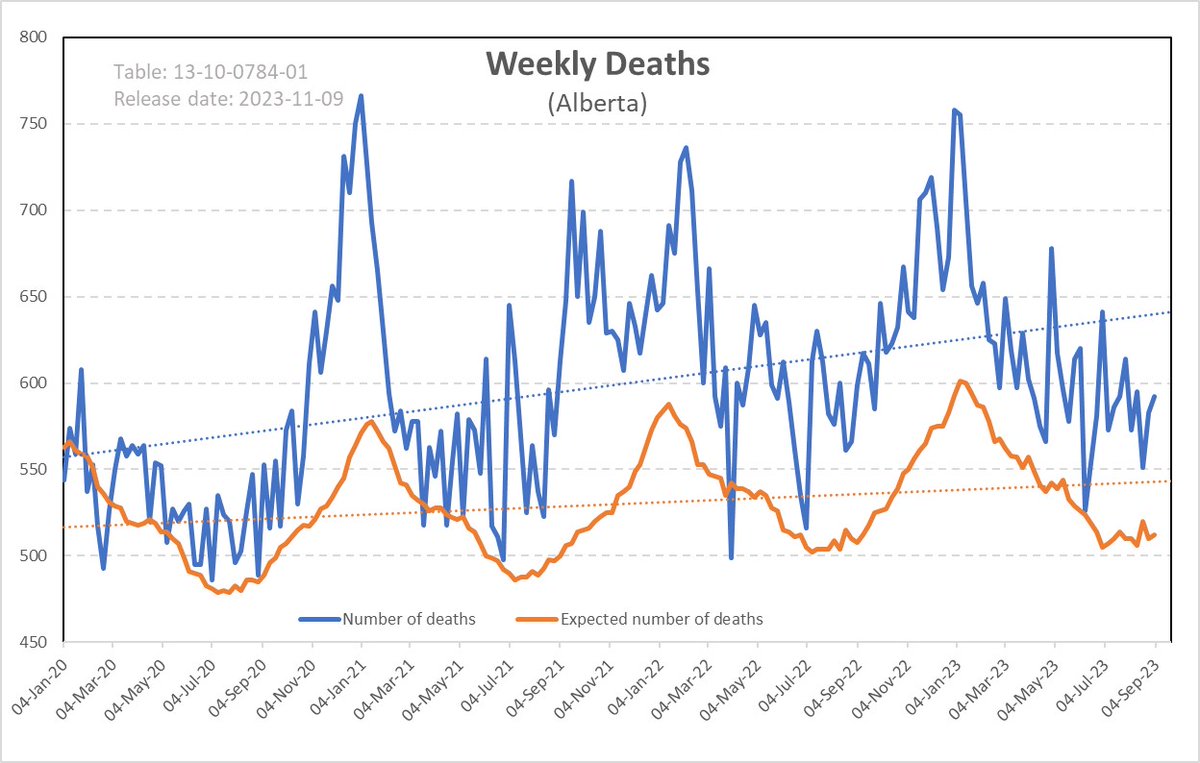
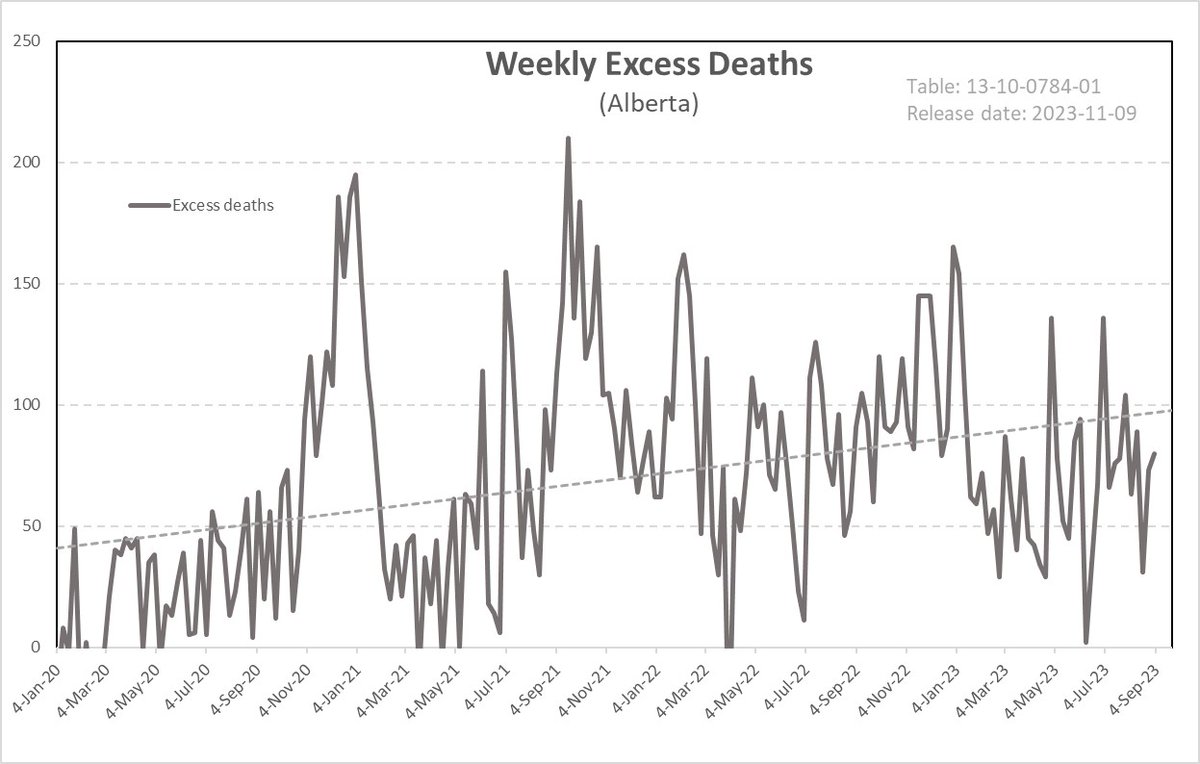
Here's the same data, but I plotted "actual" minus "expected", which is excess deaths. The trend has been going up for 2 years. That's after we rolled out the vaccine. What's causing an extra 80 people to die every week in Alberta? Draw your own conclusions.
P.S. It's not COVID, long-COVID or heat pumps.
2/
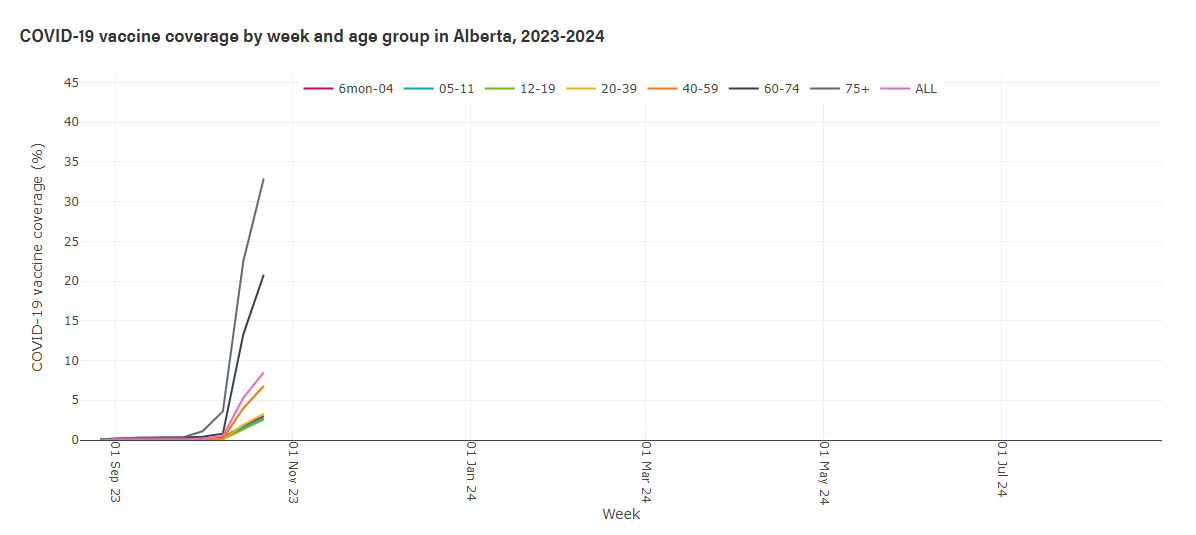
COVID vaccine uptake this campaign is much lower than previous campaigns. Less than 35% of those over the age of 70 have received a COVID booster. It falls off dramatically for younger Albertans. It's less than 10% for everyone under the age of 40.
COVID remains relatively harmless for otherwise healthy people under the age of 60.
Reminder: The best way to protect yourself from COVID, or any other diseases, is to eat well, avoid processed foods, exercise regularly, don't smoke, only drink alcohol in moderation and sleep more than 7 hours per night.
Don't let anyone guilt you into taking the vaccine. Our healthcare system is not overwhelmed with unvaccinated Albertans, our healthcare system is overwhelmed by Albertans who make back lifestyle decisions.
• • •
Missing some Tweet in this thread? You can try to
force a refresh
Primarily from France (e.g., for New France in Quebec and Acadia); some from Britain (e.g., Newfoundland, Nova Scotia).
Colonization to secure territorial claims, fur trade, resource exploitation, and missionary work; competition between European powers. Limited appeal due to harsh conditions, lack of infrastructure, and fears of the unknown.
~70,000 in New France by 1760; overall small, with ~6,000 French arrivals in the 17th century.
Established French-Canadian culture, language, and Catholic institutions; trading alliances with Indigenous peoples but also devastating diseases and conflicts (e.g., with Iroquois); foundation for bilingual Canada after British Conquest in 1763.
This is when my ancestor came here. It's hard to imagine just how hard it would have been to simply survive.
1/
British and Loyalist Wave (1760s–1815)
From British Isles (England, Scotland, Ireland); United States (Loyalists from American colonies).
Post-Conquest British administration encouraged settlement; American Revolution displaced Loyalists fleeing persecution or refusing U.S. citizenship; land grants and supplies provided as incentives.
Tens of thousands of Loyalists (e.g., ~40,000–50,000 to British North America); overall British migration modest.
Reinforced British influence, leading to provinces like Upper Canada (Ontario); included Black Loyalists who built communities despite racism (e.g., in Nova Scotia); shaped early English-speaking Canada and tensions with French Canadians.
2/
Great Migration (1815–1850)
British Isles (Scotland, Ireland, England); some from the U.S. and Western Europe.
Post-Napoleonic Wars economic hardship, Industrial Revolution job displacement, Highland Clearances, and Irish Potato Famine; opportunities in Canadian agriculture, canals, railways, and lumber.
Over 800,000 immigrants, peaking in the 1830s–1840s.
Boosted population growth in eastern Canada; introduced Irish Catholic minorities, leading to urban neighborhoods and religious diversity; provided labor for infrastructure like Rideau Canal; contributed to pre-Confederation identity.
The reason I create my own spreadheads, is because it allows me to have a historical record.
You see, our government never provides historical data, just forward-looking forecasts, which makes it hard to visualize trends. To me, trends are everything.
Here is the core economic data used by the PBO for all his calculations and forecasts.
He's basically predicting some very agressive growth in the coming years, with a GDP climbing by roughly 1.5% annually, inflation below 2% and the Bank of Canada's interest rate below 3%. (note: maybe wait a year before buying that house).
What's really interesting is that a super important input in all the calculations is the price of oil (WTI in $US). Now why would that be? Don't answer, I'm being sarcastic. Oil is the #1 commodity that we produce, and it's a cornerstone of our economy.
2/
Here is the meat of the report. This table shows all the important measures. It shows how Canada is doing today (2025-2026), as well as how it did last year. It also shows 5 years of predictions.
What I do, is I keep copies of this table every year, so that I can look at long term trends. It also allows me to determine how good the PBO has been with his prediction.
Here's a few important reminders.
Ottawa's fiscal year runs from April 1–March 31. Last year's spending (called the 2024/25 budget) is finished, but the Public Accounts for is not finalized, and audited results are expected to be tabled this fall. So the numbers in the first column are not "official" yet.
The second column is this year's spending. We don't even have a budget for this year, but we're already 7 months into the fiscal year.
3/
This chart shows the federal governments total expenses, going back to 2018-2019.
The dark blue bars are all program expenses (i.e. military, coast guard, diplomatic service, transfers to provinces, EI payments, OAS, foreign aid, border security, civil service, etc).
Prior to COVID, the annual spending was under $400 billion/year.
That number almost doubled in 2020/21.
In the years since COVID, the Trudeau Liberals have never returned spending to the pre-pandemic trend.
The dark orange part of the bars is "public debt " charges) or more simply, interest on our debt. I'll talk about this in detail in the next slides.
Light blue and light orange are future predictions. Our government's spending is out-of-control, and outpacing both population growth, and inflation.
This is the PBO's estimate of future spending, based on what he's heard in the House of Commons. Historically, the PBO is always low. Carney is on track to outspend even Trudeau
🧵Albertans contribute disproportionately to Ottawa. This happens with taxes, but also with CPP contributions and EI premiums.
Unfortunately most Canadians don't have a clue about the difference between federal and provincial taxes, transfer payments, equalization payments and the complex relationship between Ottawa and the provinces.
So I put together the following table, based on 2023 data to explain why Alberta subsidizes the other provinces.
I had to compile information from half a dozen places.
This is a summary of the federal taxes collected by Ottawa vs. the expenditures, sorted by province. (I excluded the 3 territories because they're so small).
I'll go into detail in the following posts.
1/
The left side of the chart is the amount of federal taxes collected from every province.
Ottawa, through the Canada Revenue Agency (CRA), collects provincial and federal taxes on behalf of all the provinces & territories, except Quebec, which has it's own tax collection agency called Revenu Québec.
The column marked "Federal Personal Income Taxes Collected" is simply that. I did not include corporate taxes, provincial taxes, royalties or other fees.
Ontario has 14.2 million citizens, so it sends the most tax money to Ottawa. Followed by Quebec, AB and BC. Then it drops off quickly.
2/
On a per capita basis, Albertans pay the most federal taxes. That's simply because we have better paying jobs (and work harder & smarter) than everyone else.
At the bottom is New Brunswick.
The disparity is actually wider than I expected, and explains why equalization payments are a thing in this country.
The trail were were on is basically abandoned and overgrown.
We had to deal with stuff like this every day. I consider myself to be an expert backcountry navigator / route finder, and I was struggling.
1/
The willows were as tall as a man. Their branches were intertwined together, forming a net that we had to push through. We took turns "breaking" trail because it is exhausting work. My shins and knees are all bruised and scratched.
We had at least 3 dozen fords. Some were thigh high.
This is the Rocky River. It got very deep by day 6, and we had to walk up and down its banks to find safe spots to ford.
🧵The Liberal platform is a total disaster. If Carney wins, the next 3 generations of Canadians are royally screwed.
Let's break it down quickly.
1/
The starting point of the Liberal platform is the deficit forecast published by the Parliamentary Budget Officer in the fall 2024 economic update.
The Liberals have never run a balanced budget.
The deficit for the fiscal year that just ended is $50.3 billion. I'm sure that will be closer to $75 billion by the time all the year-end accounting is done.
Freeland & Trudeau never even had plans to run a balanced budget. They also never had provisions to pay down any of our debt.
Ottawa's interest on debt is $1 billion/week.
2/
Carney is showing a modest increase in revenues during the next 4 years.
$20 billion in tariffs collected this fiscal year. Interestingly he shows no tariff revenues after that.
The increased revenues in the following three years is from what he calls "increasing penalties and fees" as well as "savings from increased government productivity"
The only gains in government productivity are if we layoff a bunch of civil servants. According to his numbers, he's only considering reducing the civil service by about 10,000 bureaucrats.
The more I think about the 2025 Liberal leadership race results, the more I suspect the outcome.
They're trying too hard to make it look like it was a fair and democratic process.
85.9% for an "Outsider" who doesn't have a seat in the House of Commons. I mean, I don't like Freeland and Gould, but certainly they should have grabbed 10-15% of the first round votes. Carney is in despot territory with that result.
Here's some recent international examples of other dictators for comparison.
Vladimir Putin (Russia, 2024): Putin won the Russian presidential election with 88.48% of the vote on March 15-17, 2024.
Paul Kagame (Rwanda, 2024): Kagame secured 99.18% of the vote in the July 15, 2024, presidential election, extending his rule since 2000
Ilham Aliyev (Azerbaijan, 2024): Aliyev took 92.12% of the vote in the February 7, 2024, presidential election, called early after Azerbaijan’s military success in Nagorno-Karabakh.
Emmerson Mnangagwa (Zimbabwe, 2023): Mnangagwa won the August 23–24, 2023, presidential election with 76.8% of the vote
Politicians in western democracies rarely win with more than 50% of the popular vote, that's just the result of, fair, open, competitive elections.
1/
I find this part equally bizarre.
Registering for the Liberal party was free, which is why 400,000 people did it (including me).
Obtaining a ballot was very complicated. Voters had to prove their age, nationality and place of residence, either in person at a Canada Post outlet or online using a new App.
Some people were legitimately disqualified, but thousands also gave up out of frustration. Eventually 163,836 people qualified for a ballot.
Voting was open for a week, and 151,899 (92.7%) of eligible voters cast a ballot. That means that 11,937 people who went through the complicated registration process didn't bother voting.
2/
This is the most suspicious part for me.
According to the "official" results, Carney won in all 338 ridings. He even won in the ridings of his opponents, including Freeland and Gould's who are currently sitting MPs.
He won every single riding with 75% or more of the votes.
That's statistically impossible. There should have been a few ridings where Freeland and Gould had strong showings.