Malignant neoplasms (tumors, cancers and lymphomas) (C00-D48)
1/x
1/x

Syövät, kasvaimet ja lymfoomat (C00-D48)
2/x
2/x

In 2023e, there is a notable surge in patient population growth, increasing by 3.5 times, from 5.6 percent in 2022 to 20.0 percent in 2023e. This growth is seen predominantly in private and occupational outpatient healthcare. Malignant neoplasms (B00-C48).
3/x
3/x

Potilasmäärän kasvuvauhti on vuonna 2023e kiihtynyt 3.5-kertaiseksi: kun vuonna 2022 potilasmäärän kasvu oli 5.6 prosenttia, vuonna 2023e se on nousemassa 20.0 prosenttiin. Kasvu tulee etupäässä yksityisestä avoterveydenhuollosta ja työterveyshuollosta.
4/x
4/x

Source: THL's Avohilmo open database. THL = Finland's National Institute for Health and Welfare. Anyone can create the same graphs using this information. (The links may change at the turn of the year, I will provide updates.)
5/x
5/x
https://twitter.com/jukka235/status/1723130551870050426
However, if we annualise from most recent monthly data (9/2023), y/y patient population growth rate increases to 25 percent. This compares with a 20.0 percent y/y growth rate if using data for 1-9/2023.
6/x
6/x

Jos annualisoidaan viimeisimmän kuukauden tietojen perusteella (9/2023), potilasmäärän kasvuvauhti nousee 25 prosenttiin. Kun annualisoitiin 1-9/2023 datasta, kasvuvauhti oli 20 prosenttia.
7/x
7/x

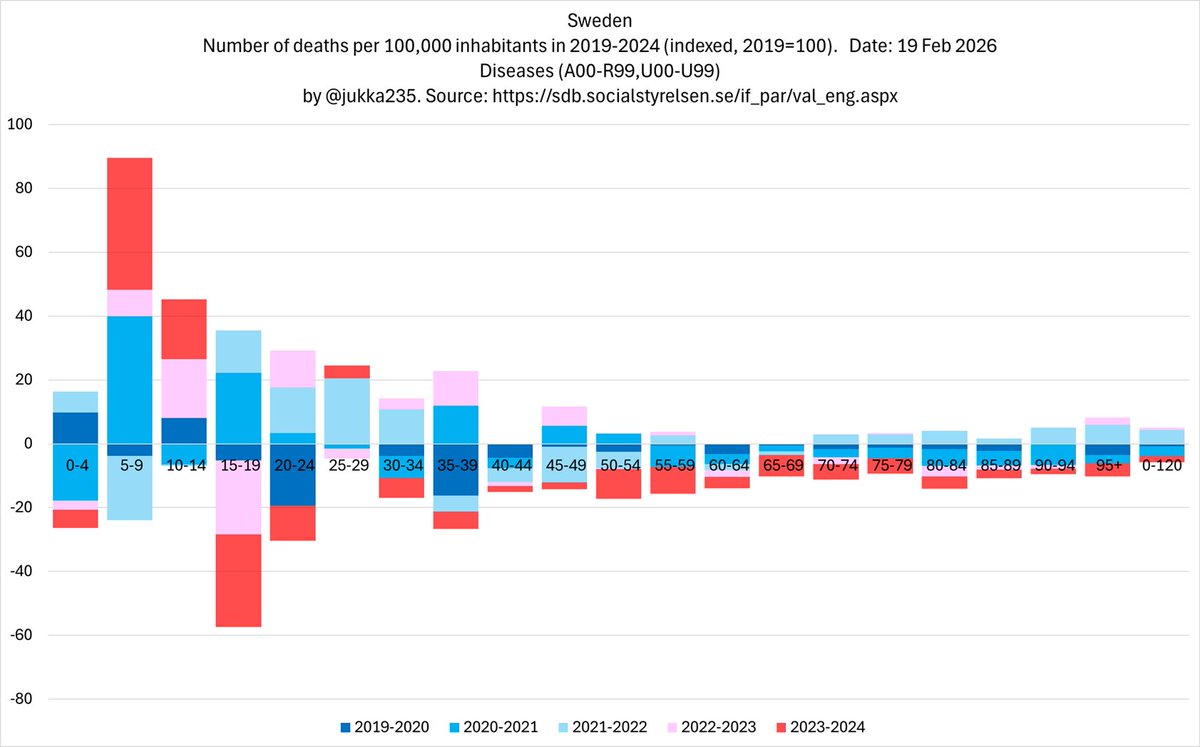
In public outpatient healthcare, all <65 year old patient populations are showing clear growth. Note that between 2019 and 2023e, total number of diagnoses (disease codes A...T) for 65-74 yo, 75-84 and >85 yo is down 24%, 38% and 66%, respectively.
8/x
8/x

Julkisessa avoterveydenhuollossa kaikissa alle 65-vuotiaiden ikäryhmissä näkyy selvää kasvua. Tässä on otettava huomioon, että julkisessa avoterveydenhoidossa vanhempien ikäryhmien saamien diagnoosien eli hoidon määrä (kaikki sairaudet, koodit A-T) on rajusti vähentynyt vuosien 2019 ja 2023e välillä:
- 65-74 -vuotiaat -24 prosenttia
- 75-84 -vuotiaat -38 prosenttia
- yli 85-vuotiaat -66 prosenttia
9/x
- 65-74 -vuotiaat -24 prosenttia
- 75-84 -vuotiaat -38 prosenttia
- yli 85-vuotiaat -66 prosenttia
9/x

In public outpatient healthcare, y/y patient population growth rates have clearly accelerated during 2023e, notably in the 0-14 year old age groups.
10/x
10/x
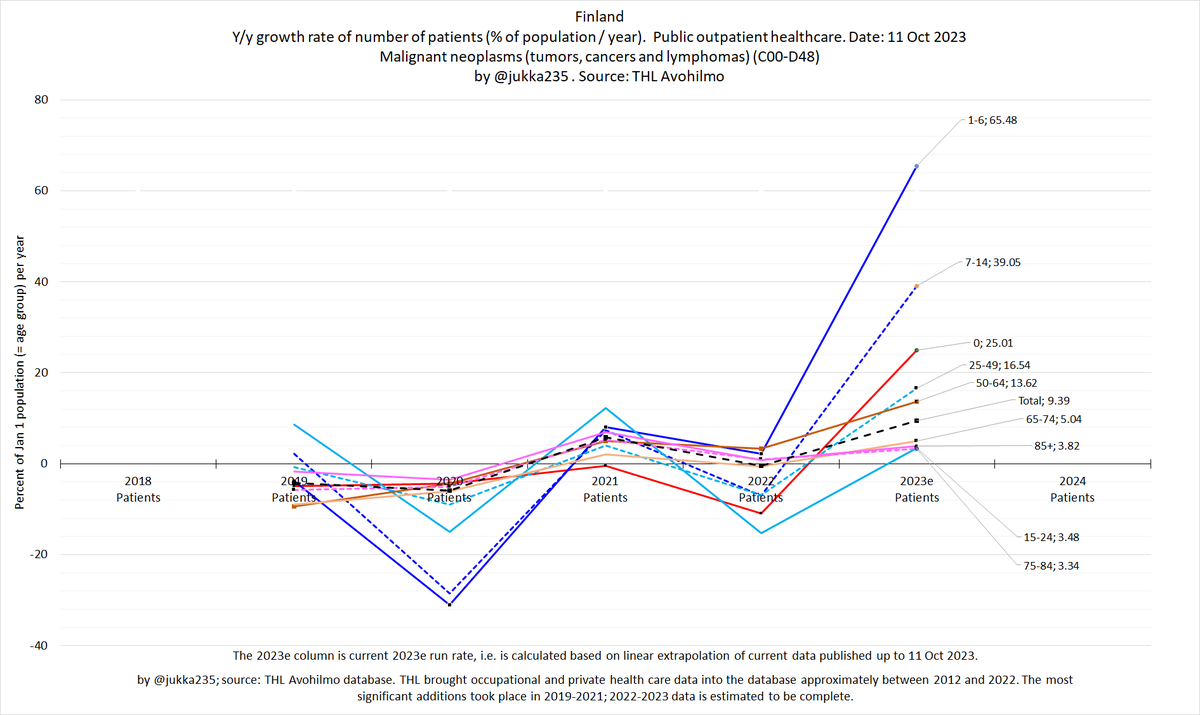
Julkisessa avoterveydenhuollossa potilasmäärän kasvuvauhti on selvästi kiihtynyt vuonna 2023e, erityisesti kaikissa alle 15-vuotiaiden ikäryhmissä. Syövät, kasvaimet ja lymfoomat (C00-D48).
11/x
11/x

In private healthcare, patient population y/y growth rates are
- decreasing for 1-6 and 7-14 year olds (same groups that are growing strongly in public healthcare)
- growing strongly for <1 year olds (growing in public healthcare, too)
- growing for all other age groups
12/x
- decreasing for 1-6 and 7-14 year olds (same groups that are growing strongly in public healthcare)
- growing strongly for <1 year olds (growing in public healthcare, too)
- growing for all other age groups
12/x

Yksityisessä avoterveydenhuollossa potilasmäärän kasvuvauhti
- pienenee 1-6 ja 7-14 -vuotiailla (samat ikäryhmät joiden kasvuvauhti kiihtyy julkisella puolella)
- nousee alle 1-vuotiailla (samoin kuin julkisella puolella)
- nousee kaikissa muissa ikäryhmissä
13/x
- pienenee 1-6 ja 7-14 -vuotiailla (samat ikäryhmät joiden kasvuvauhti kiihtyy julkisella puolella)
- nousee alle 1-vuotiailla (samoin kuin julkisella puolella)
- nousee kaikissa muissa ikäryhmissä
13/x

When the sectors are combined, we get this graph. In total outpatient healthcare, y/y patient population growth rates for malignant neoplasms are clearly increasing in all age groups. The acceleration of y/y growth is fastest in the youngest age groups.
14/x
14/x

Kun sektorit yhdistetään, saadaan tämä kuva. Koko avoterveydenhuollossa potilasmäärän kasvuvauhti kiihtyy kaikissa ikäryhmissä. Kasvuvauhti kiihtyy nopeimmin nuorimmissa ikäryhmissä. Syövät, kasvaimet ja lymfoomat (C00-D48).
15/x
15/x

In public healthcare, y/y patient population growth rate for 2023e has risen from 9.1 percent (Jan-Aug) to 9.9 percent (Jan-Sep). Y/y growth rises to 15 percent when annualising from September data alone.
16/x
16/x

Potilasmäärän kasvuvauhti on julkisessa avoterveydenhuollossa noussut 9.1 prosentista (1-8/2023) 9.9 prosenttiin (1-9/2023). Syyskuun luvuista annualisoitu potilasmäärän kasvuvauhti on 15 prosenttia.
17/x
17/x

This is how the number of both diagnoses and patients have evolved. THL added private and occupational outpatient healthcare from 2020-2021. Notice how the number of diagnoses (i.e., care) is falling in public outpatient healthcare (operating at close to capacity).
18/x
18/x

Tässä kuva siitä, miten diagnoosien ja potilaiden määrät ovat kehittyneet. THL lisäsi yksityisen ja työterveyden vuosista 2020-2021 alkaen. Huomaa, miten diagnoosien määrä putoaa julkisessa avoterveydenhuollossa, joka toimii lähes täydellä kapasiteetilla.
19/x
19/x

Patient populations of top 1-20 malignant neoplasms (C00-D48) in total population. Public outpatient healthcare.
20/x
20/x

Top 1-20 syövät, kasvaimet ja lymfoomat (C00-D48). Potilasmäärät julkisessa avoterveydenhuollossa suhteessa väestöön.
21/x
21/x

Patient population y/ygrowth rates of top 1-20 malignant neoplasms (C00-D48) in total population. Total for the 1-20 is 10.3 percent.
22/x
22/x

Potilasmäärän kasvuvauhdit / top 1-20 syövät, kasvaimet ja lymfoomat (C00-D48). Näiden keskimääräinen kasvuvauhti on 10.3 prosenttia (2023e vs. 2022).
23/x
23/x

Patient populations of top 21-40 malignant neoplasms (C00-D48) in total population. Public outpatient healthcare.
24/x
24/x

Top 21-40 syövät, kasvaimet ja lymfoomat (C00-D48). Potilasmäärät julkisessa avoterveydenhuollossa suhteessa väestöön.
25/x
25/x

Patient population y/y growth rates of top 21-40 malignant neoplasms (C00-D48) in total population. Total for 21-40 is -0.1 percent (9.5 percent in total outpatient healthcare). Notice the strong growth in benign neoplasm of eye and adnexa (D31), up 4.4 times vs. 2022.
26/x
26/x

Potilasmäärän kasvuvauhdit / top 21-40 syövät, kasvaimet ja lymfoomat (C00-D48). Näiden keskimääräinen kasvuvauhti on -0.1 prosenttia (2023e vs. 2022). Huomaa silmän ja silmän seudun hyvänlaatuisten kasvainten (D31) voimakas kasvu (4.4-kertaistumassa).
27/x
27/x

Patient populations of top 41-60 malignant neoplasms (C00-D48) in total population. Public outpatient healthcare.
28/x
28/x

Koko väestön top 41-60 syövät, kasvaimet ja lymfoomat (C00-D48). Potilasmäärät julkisessa avoterveydenhuollossa suhteessa väestöön.
29/x
29/x

Patient population y/y growth rates of top 41-60 malignant neoplasms (C00-D48) in total population. Total y/y growth rate for 41-60 is 14.1 percent (1-10/2023), up from 13.6 percent (1-9/2023) and 13.1 percent (1-8/2023).
30/x
30/x

Potilasmäärän kasvuvauhdit koko väestössä / top 41-60 syövät, kasvaimet ja lymfoomat (C00-D48). Näiden keskimääräinen kasvuvauhti on 14.1 prosenttia (1-10/2023), vs. 13.6 prosenttia (1-9/2023) ja 13.1 prosenttia (1-8/2023).
31/x
31/x

These 20 fastest growing malignant neoplasms represent 5.2 percent of all patients in public outpatient healthcare. Their patient population is growing at a weighted average rate of 80 percent annually (when annualised from 1-10/2023 data).
32/x
32/x

Nämä 20 syöpää, kasvainta ja lymfoomaa, joiden potilasmäärä kasvaa nopeimmin, vastaavat 5.2 prosenttia kaikista julkisen avoterveydenhoidon syöpäpotilaista (C00-D48). Potilasmäärä kasvaa 80 prosentin vauhtia (1-10/2023).
33/x
33/x

The top 20 fastest growing cancers, tumors, and lymphomas appear to be concentrated in part in the same areas as malformations and deformations in <1 year old children (face and oral area, and genitals). These 20 showed almost no growth until 2023.
34/x
34/x

Nopeimmin kasvavat syövät, kasvaimet ja lymfoomat näyttävät keskittyvän osaksi samoihin alueisiin kuin alle 1-vuotiaiden epämuodostumat ja epämuotoisuudet (kasvojen ja suun alue sekä sukupuolielimet). Näillä 20:lla ei ollut juuri lainkaan kasvua ennen vuotta 2023.
35/x
35/x

The most rapidly growing category is benign tumors of the eye and orbit (D31), with the number of patients increasing 4.4-fold this year. Number of patient decreased 54 percent in 2019 and 35 percent in 2020, but started to grow in 2021.
36/x
36/x

Ylivoimaisesti nopeinta vauhtia kasvaa silmän ja silmän seudun hyvänlaatuiset kasvaimet (D31), jonka potilasmäärä on 4.4-kertaistumassa tänä vuonna. Tämän taudin potilasmäärä väheni 54 prosenttia vuonna 2019 ja 35 prosenttia vuonna 2020, mutta alkoi kasvaa vuonna 2021.
37/x
37/x

As this graph shows, weighted average y/y growth rate of the 20 fastest growing cancers, tumors, and lymphomas was negative on balance until 2022. Very strong y/y growth has started in 2023.
38/x
38/x

20 nopeimmin kasvavan syövän, kasvaimen ja lymfooman painotettu potilasmäärän kasvuvauhti oli keskimäärin negatiivinen vuoteen 2022 asti. Voimakas kasvu on alkanut tämän vuoden aikana.
39/x
39/x

Here is the data on malformations and deformations for <1 year olds that I referred to.
40/x
40/x
https://twitter.com/jukka235/status/1720211747896799696
Viittasin näihin tietoihin alle 1-vuotiaiden epämuodostumista ja epämuotoisuuksista.
41/x
41/x
https://twitter.com/jukka235/status/1720212589274091537
These are fastest growing malignant neoplasms (ranks 21-40) among total population in public outpatient healthcare.
42/x
42/x

Tässä on sijat 21-40, potilasmäärältään nopeimmin kasvavat syövät, kasvaimet ja lymfoomat julkisessa avohoidossa. Ikäryhmä = koko väestö.
43/x
43/x

Here is the growth rate of the fastest-growing cancers, tumors, and lymphomas (ranks 21-40). Notice how they all started growing in 2023. In 2022, the growth was almost universally negative, with the exception of those whose patient numbers have been continuously increasing throughout the pandemic:
- C60 Penile cancer
- C49 Other connective and soft tissue cancer
Public outpatient care / total population.
44/x
- C60 Penile cancer
- C49 Other connective and soft tissue cancer
Public outpatient care / total population.
44/x

Tässä on nopeimmin kasvavien syöpien, kasvainten ja lymfoomien (sijat 21-40) kasvuvauhti. Huomaa miten ne kaikki rupesivat kasvamaan vuonna 2023. Vuonna 2022 kasvu oli lähes kaikilla negatiivinen; poikkeuksena ne joiden potilasmäärä on kasvanut pandemian aikana koko ajan:
- C60 Siittimen syöpä
- C49 Muun sidekudoksen ja muun pehmytkudoksen syöpä
Julkinen avohoito / koko väestö.
45/x
- C60 Siittimen syöpä
- C49 Muun sidekudoksen ja muun pehmytkudoksen syöpä
Julkinen avohoito / koko väestö.
45/x

• • •
Missing some Tweet in this thread? You can try to
force a refresh