1/7
How to Read a CEO’s Comments
---
The deflationistas have been working themselves into a tizzy since Walmart Inc. Chief Executive Officer Doug McMillon warned of a period of declining prices at the big-box retailer in the months to come.
bloomberg.com/opinion/articl…
How to Read a CEO’s Comments
---
The deflationistas have been working themselves into a tizzy since Walmart Inc. Chief Executive Officer Doug McMillon warned of a period of declining prices at the big-box retailer in the months to come.
bloomberg.com/opinion/articl…
2/7
We’ve long warned of relying too much on CEO forecasts, as most are not forecasting at all. They are nowcasting, simply stating what has already happened and treating it as a forecast.
The following chart suggests this is precisely what McMillon is doing.
We’ve long warned of relying too much on CEO forecasts, as most are not forecasting at all. They are nowcasting, simply stating what has already happened and treating it as a forecast.
The following chart suggests this is precisely what McMillon is doing.
3/7
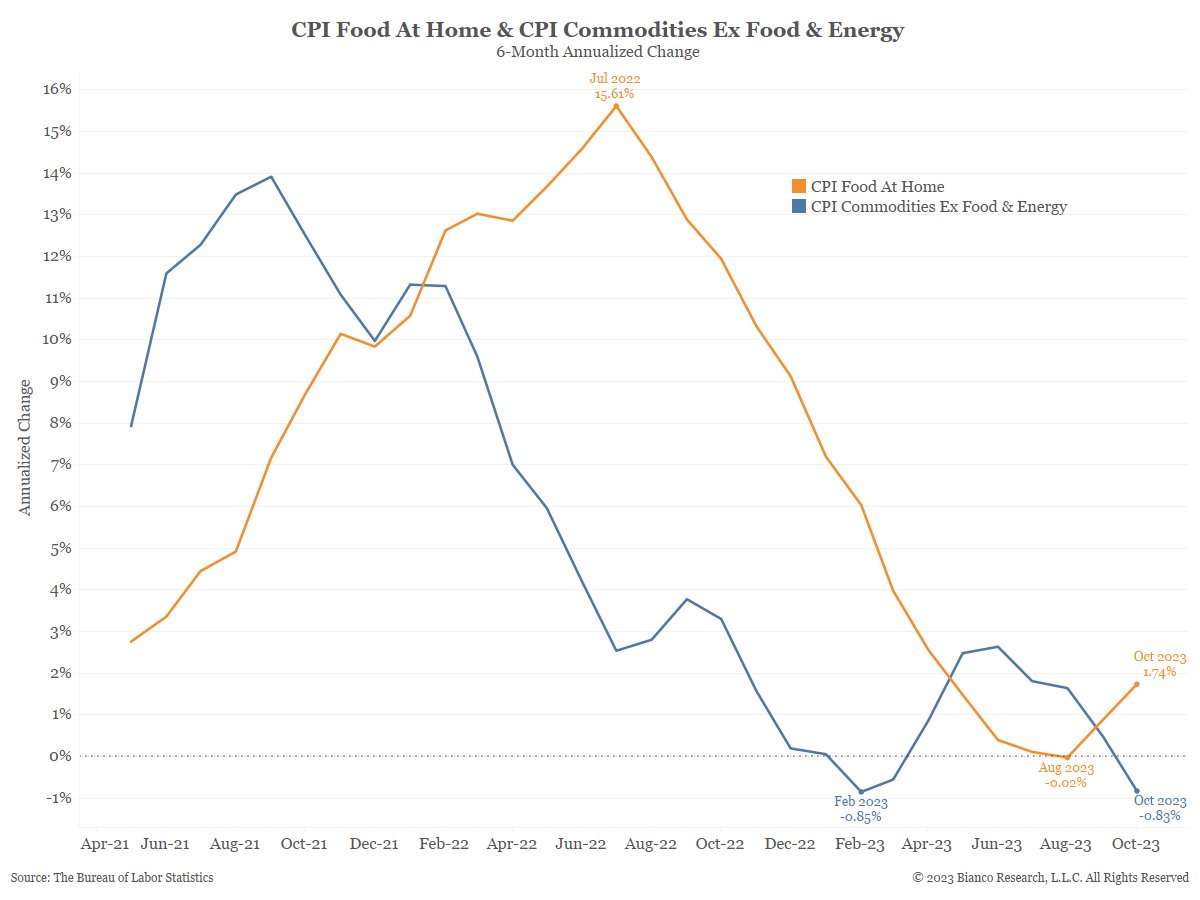
The CPI report calls “general merchandise” CPI Commodities Less Food and Energy.
The blue line above shows its 6-month annualized change is currently in deflationary territory. And it has been in and out of deflation by this metric for almost a year.
The CPI report calls “general merchandise” CPI Commodities Less Food and Energy.
The blue line above shows its 6-month annualized change is currently in deflationary territory. And it has been in and out of deflation by this metric for almost a year.
4/7
McMillon also said he expects some stickier higher prices, such as the ones for “pantry staples.” The orange line above shows the six-month annualized change for CPI Food at Home prices. The recent uptick in this change is his “stickier higher prices.”
McMillon also said he expects some stickier higher prices, such as the ones for “pantry staples.” The orange line above shows the six-month annualized change for CPI Food at Home prices. The recent uptick in this change is his “stickier higher prices.”
5/7
So far, McMillon’s forecast is nothing more than a description of the chart above. He is telling us what just happened.
But McMillon did offer a forecast when he said he expects pantry staples to, “start to deflate in the coming weeks and months.”
So far, McMillon’s forecast is nothing more than a description of the chart above. He is telling us what just happened.
But McMillon did offer a forecast when he said he expects pantry staples to, “start to deflate in the coming weeks and months.”
6/7
McMillon concluded about this forecast, “And while that would put more unit pressure on us, we welcome it, because it’s better for our customers.”
The cumulative price increase is ~20% since the Covid/lockdown recession ended in April 2020.
McMillon concluded about this forecast, “And while that would put more unit pressure on us, we welcome it, because it’s better for our customers.”
The cumulative price increase is ~20% since the Covid/lockdown recession ended in April 2020.

7/7
McMillon needs deflation so his customers can buy more “stuff.” And that is what he is forecasting.
Maybe McMillon is correct. But, in Wall Street parlance, he is "talking his book." And, as investors know, following those who talk their book is often a costly strategy.
McMillon needs deflation so his customers can buy more “stuff.” And that is what he is forecasting.
Maybe McMillon is correct. But, in Wall Street parlance, he is "talking his book." And, as investors know, following those who talk their book is often a costly strategy.
• • •
Missing some Tweet in this thread? You can try to
force a refresh