In this THREAD I will explain PO3 and how to trade it:
1. Accumulation, Distribution and Manipulation
2. Bearish PO3
3. Bullish PO3
🧵(1/7)
1. Accumulation, Distribution and Manipulation
2. Bearish PO3
3. Bullish PO3
🧵(1/7)

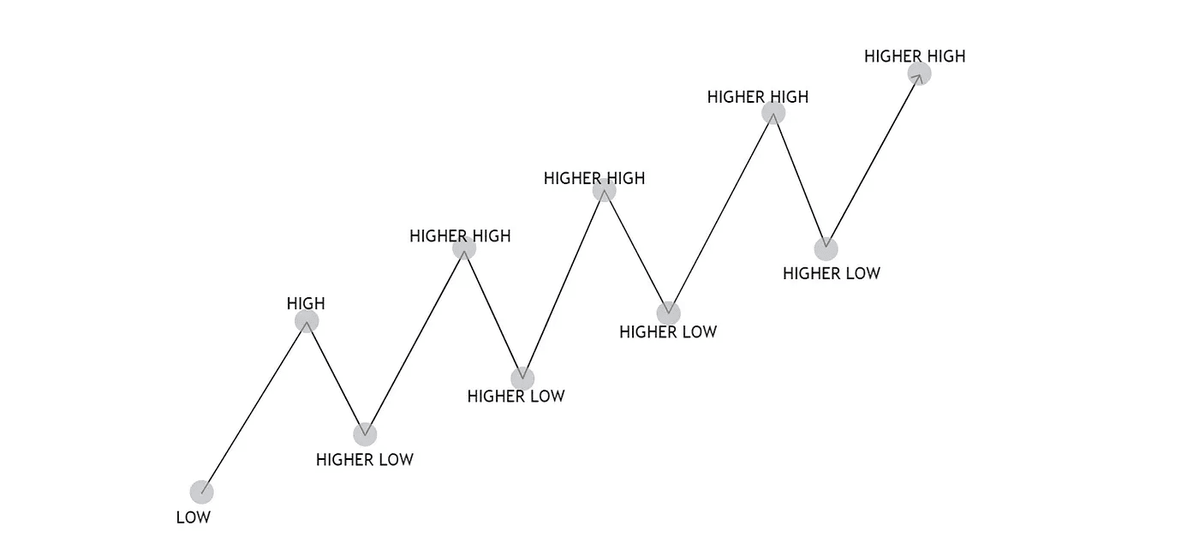
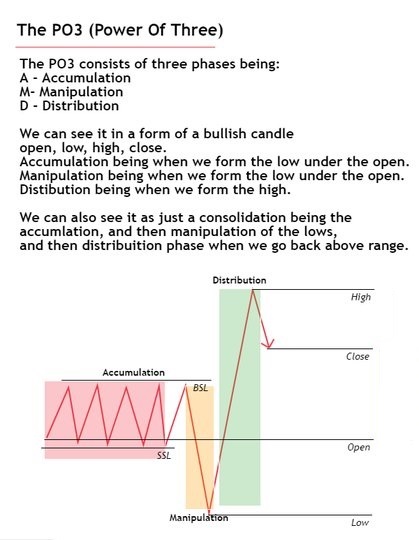
1. Accumulation:
Accumulation is a phase in the market where smart money or institutional investor are buying
During accumulation, the price is relatively stable, creating an impression of little activity. Behind the scenes, investors are accumulating.
High bullish volume.
Accumulation is a phase in the market where smart money or institutional investor are buying
During accumulation, the price is relatively stable, creating an impression of little activity. Behind the scenes, investors are accumulating.
High bullish volume.


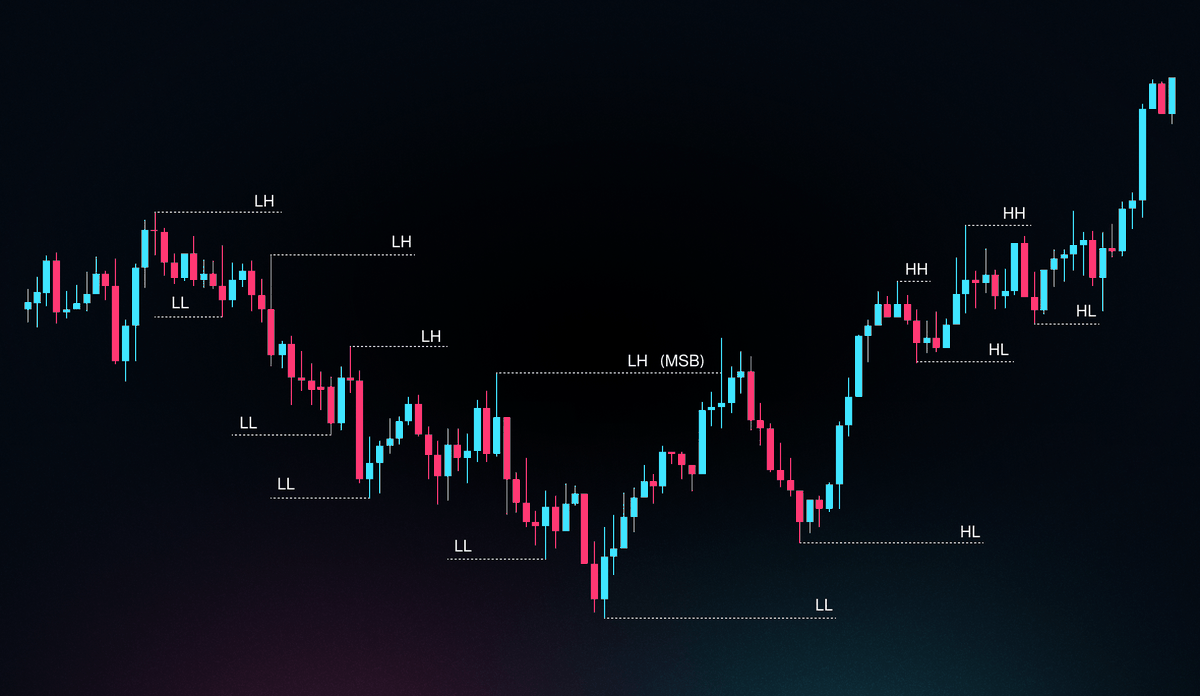
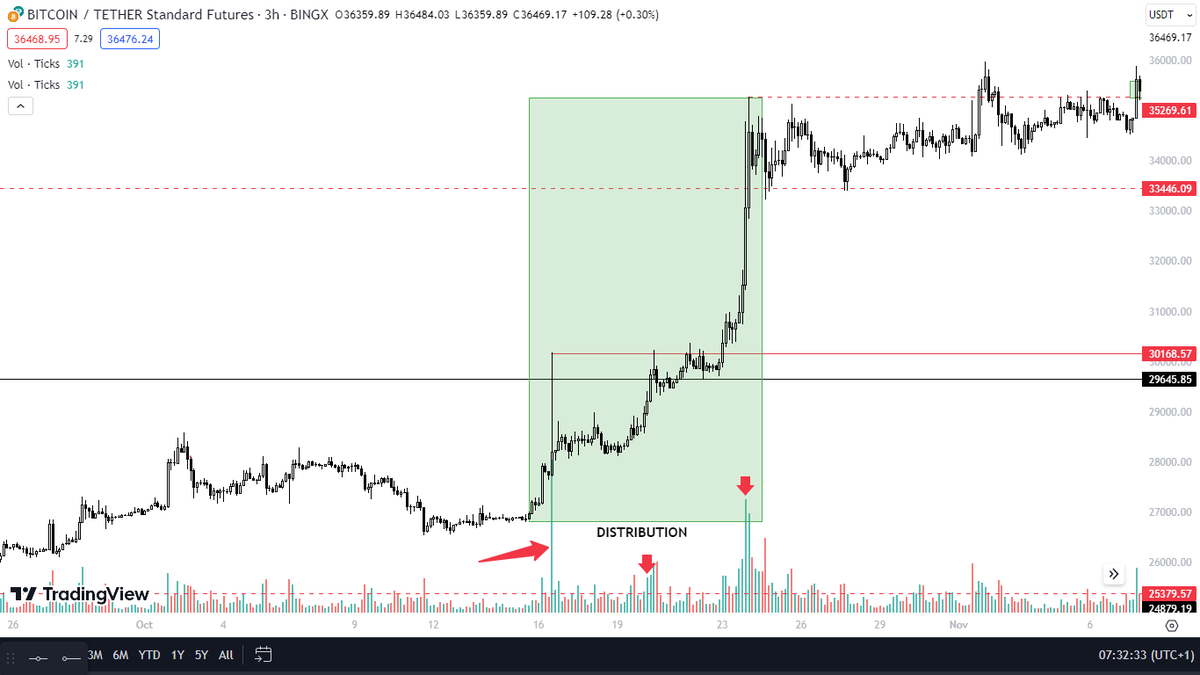
1.2 Distribution:
Smart money start selling their accumulated positions, after making new highs.
During distribution, the price may exhibit weakness or struggle to move higher, after a big uptrend. Volume might increase, but price progress is limited or declining within time.
Smart money start selling their accumulated positions, after making new highs.
During distribution, the price may exhibit weakness or struggle to move higher, after a big uptrend. Volume might increase, but price progress is limited or declining within time.

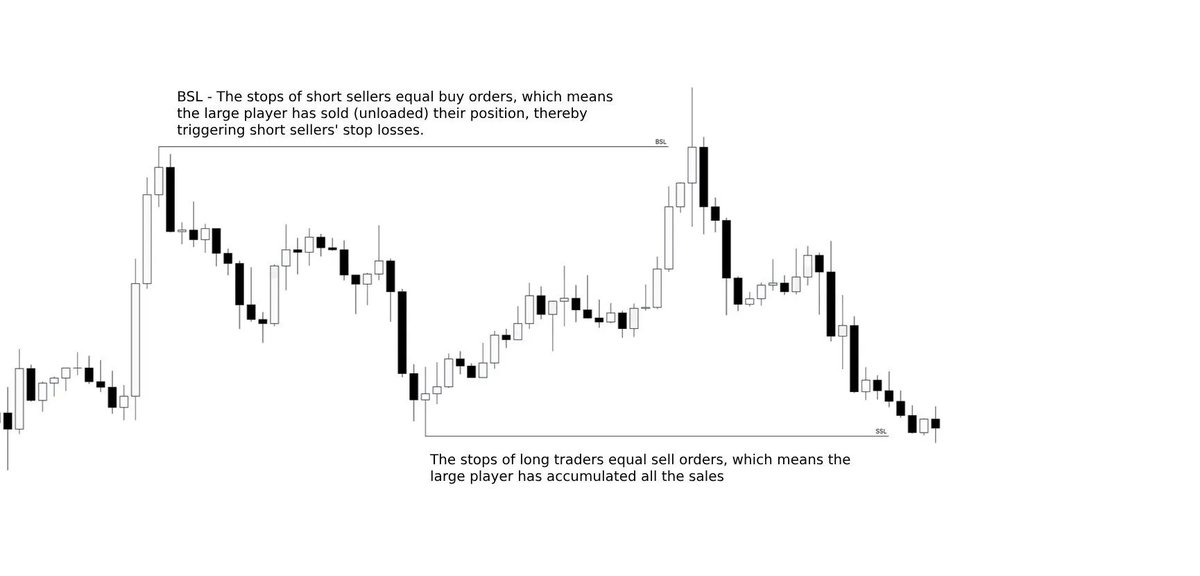
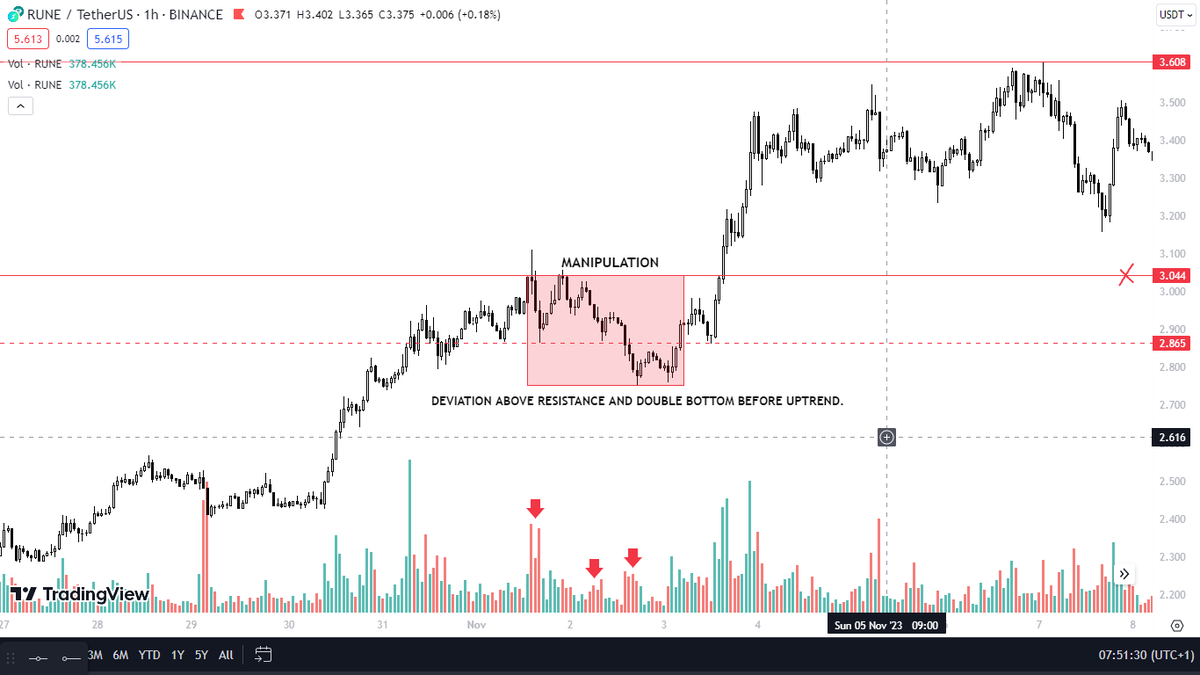
1.3 Manipulation:
Manipulation refers to intentional actions taken by smart money to control/influence the price for their benefit
Unusual price spikes/drops that don't align with fundamentals, may suggest manipulation. As deviations below supports with a big buying pressure.
Manipulation refers to intentional actions taken by smart money to control/influence the price for their benefit
Unusual price spikes/drops that don't align with fundamentals, may suggest manipulation. As deviations below supports with a big buying pressure.
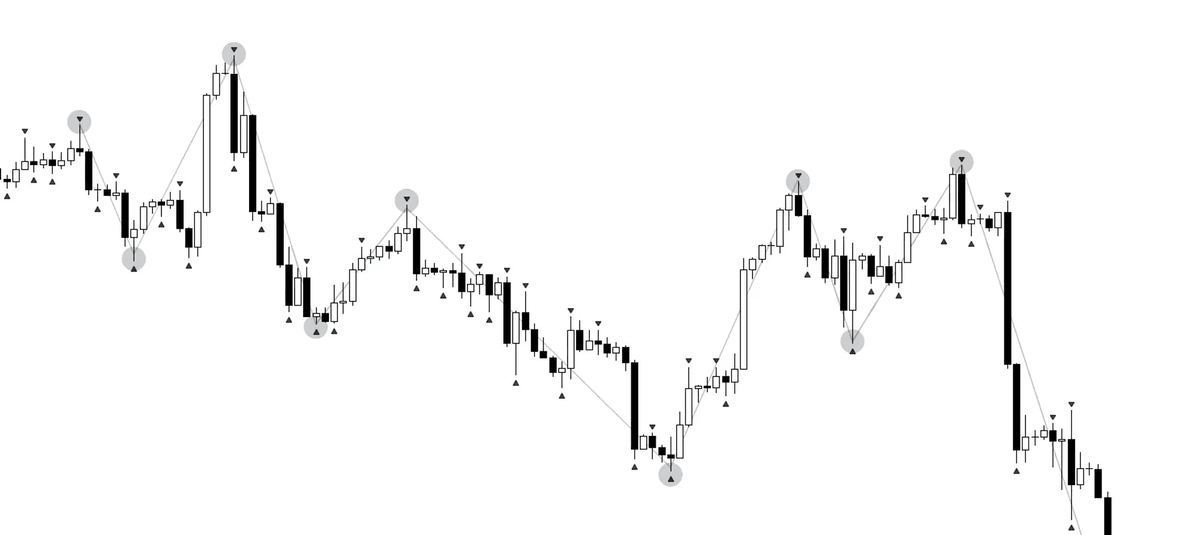
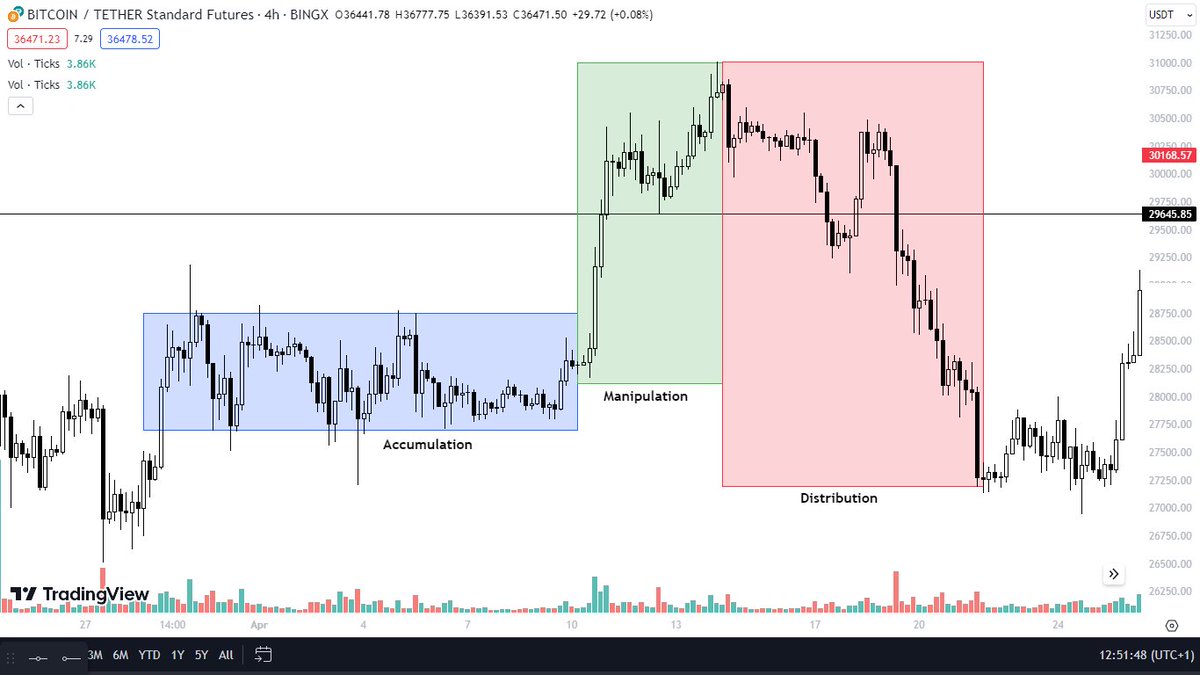
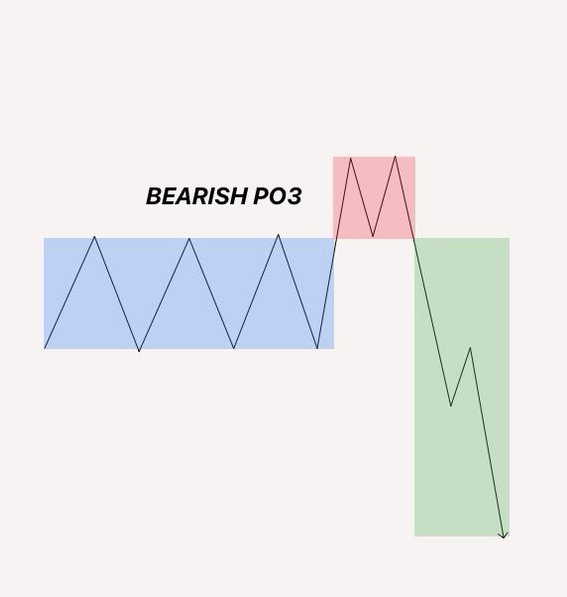
2. Bearish PO3:
Bearish PO3 is conformed by;
1. Accumulation: The price enters in a range
2. Manipulation: The price aggressively rallies above the range, creating liquidity above last highs
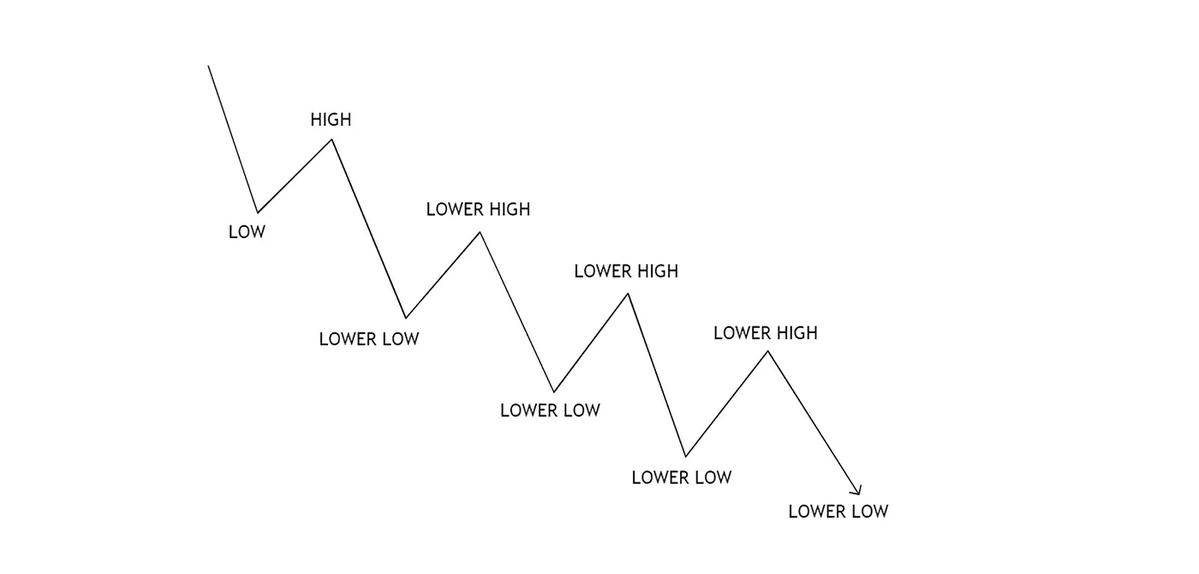
3. Distribution: Price expands downwards, breaking the MS with strong bearish candles
Bearish PO3 is conformed by;
1. Accumulation: The price enters in a range
2. Manipulation: The price aggressively rallies above the range, creating liquidity above last highs
3. Distribution: Price expands downwards, breaking the MS with strong bearish candles
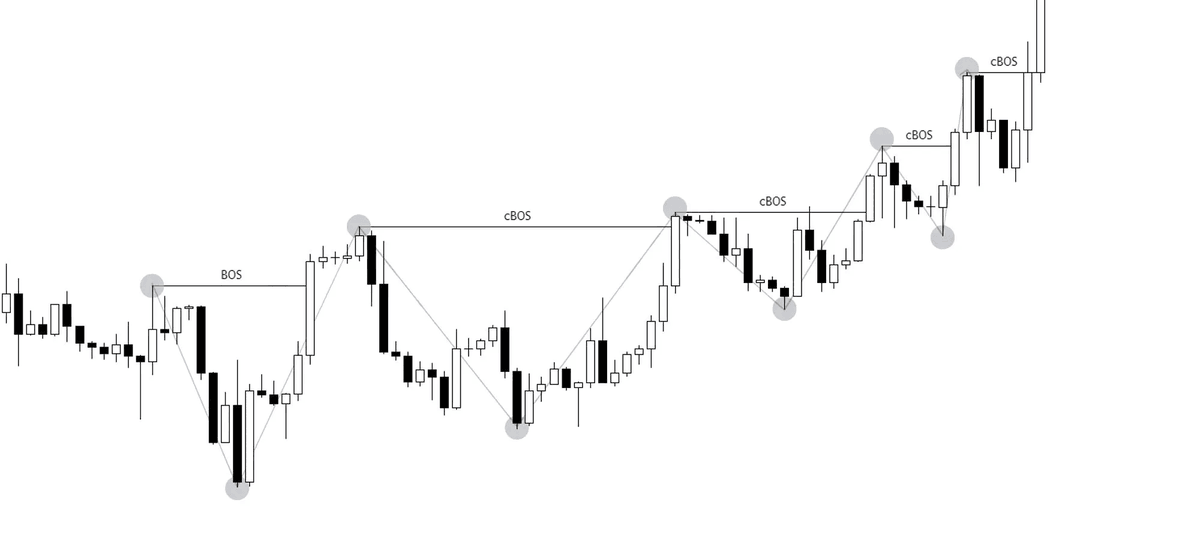
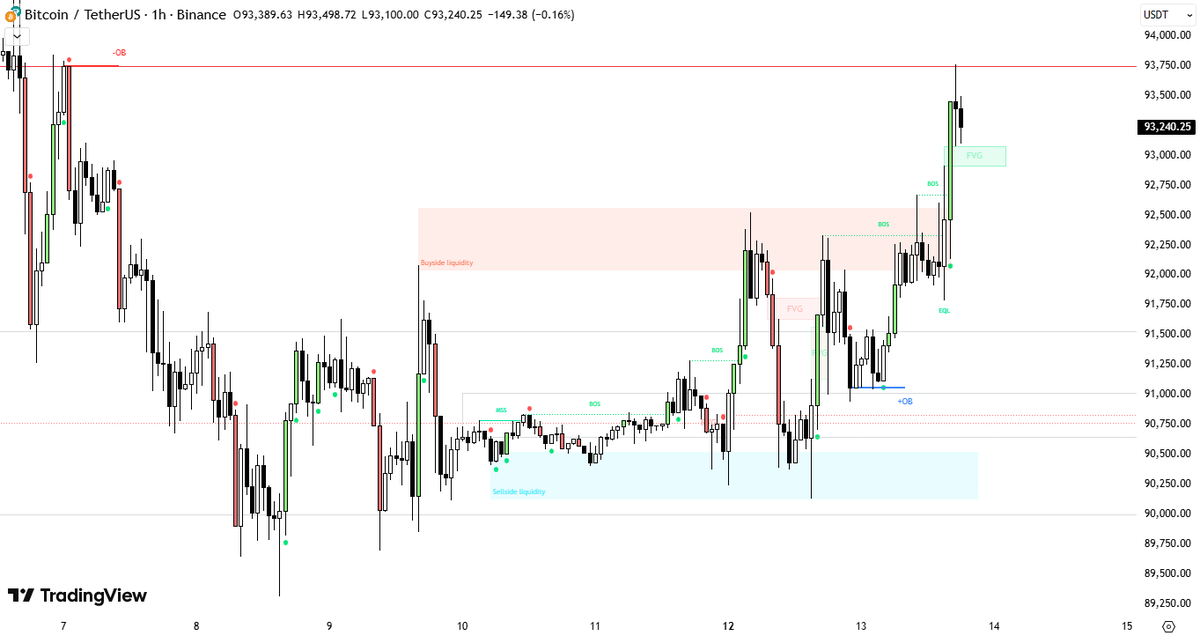
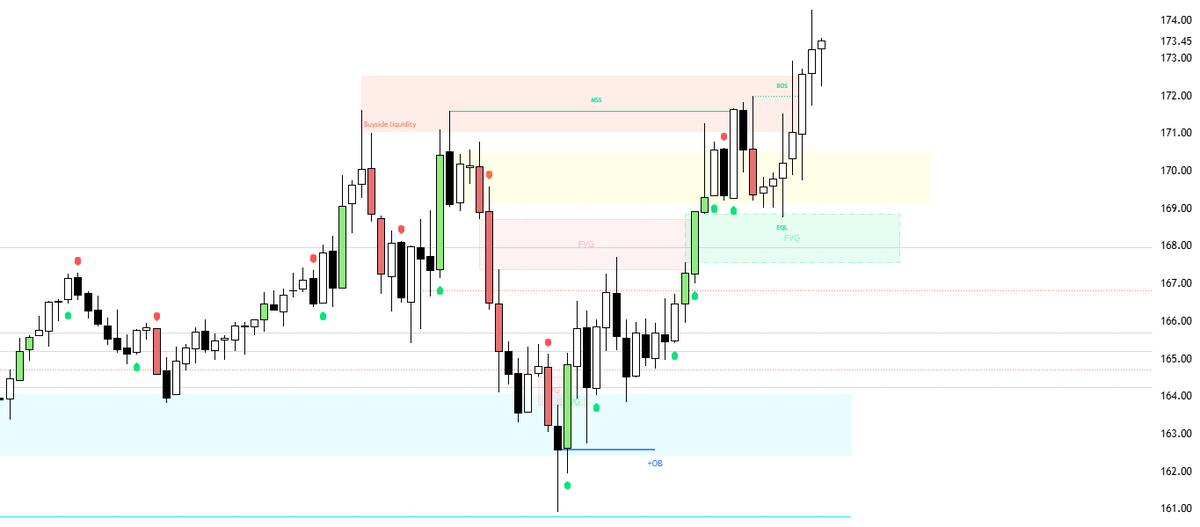
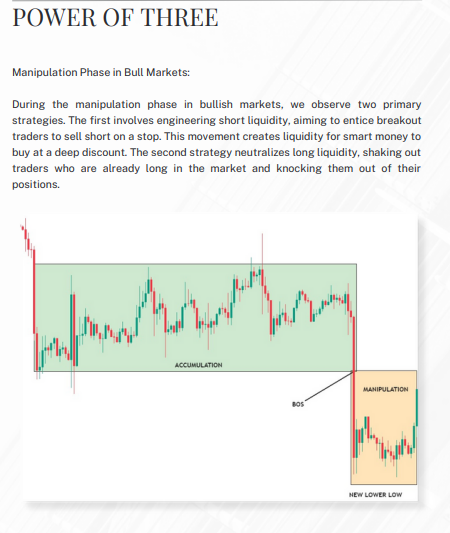
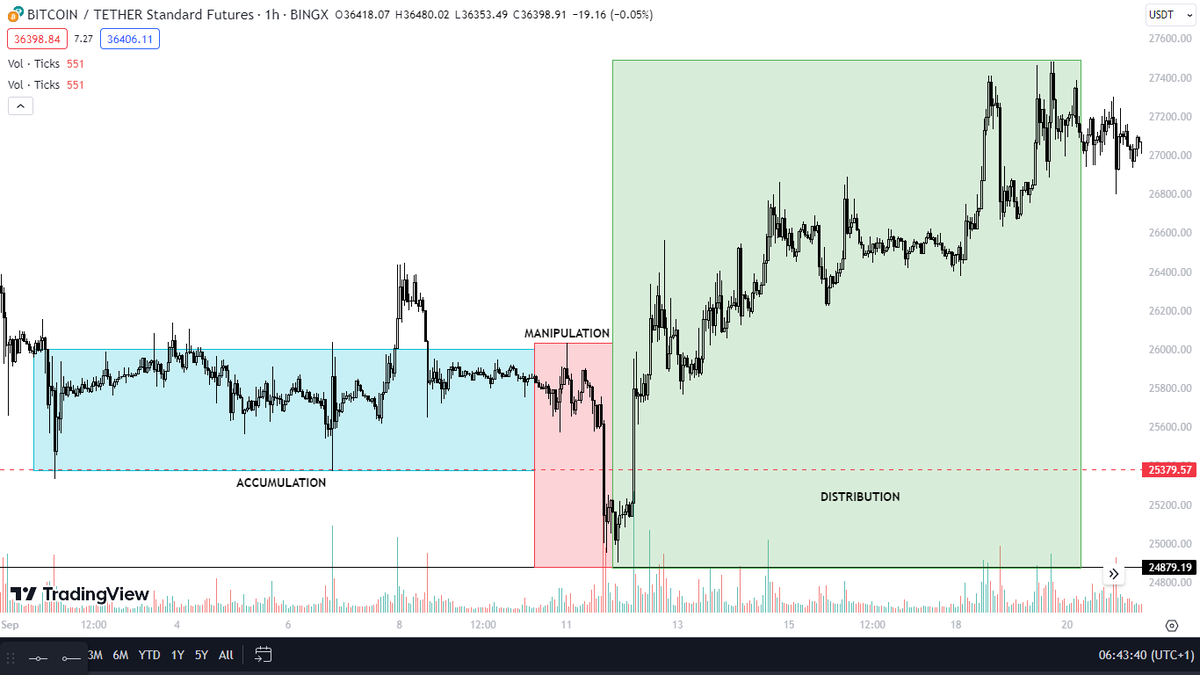
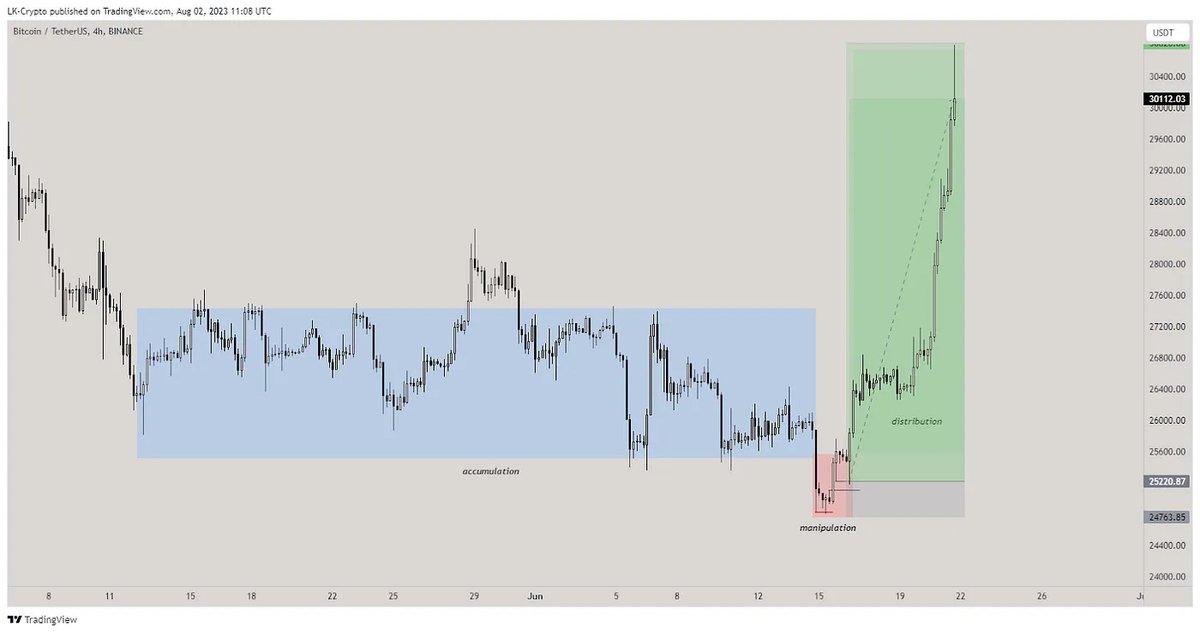
3. Bullish PO3:
Bullish PO3 is conformed by;
1. Accumulation: Longs are building up and price is in a range.
2. Manipulation: Market sells of below the range, creating liquidity
3. Distribution: Price expands upwards, breaking MS with strong bullish candles and bullish volume
Bullish PO3 is conformed by;
1. Accumulation: Longs are building up and price is in a range.
2. Manipulation: Market sells of below the range, creating liquidity
3. Distribution: Price expands upwards, breaking MS with strong bullish candles and bullish volume
I hope this THREAD has helped you to understand PO3 (Power of 3)
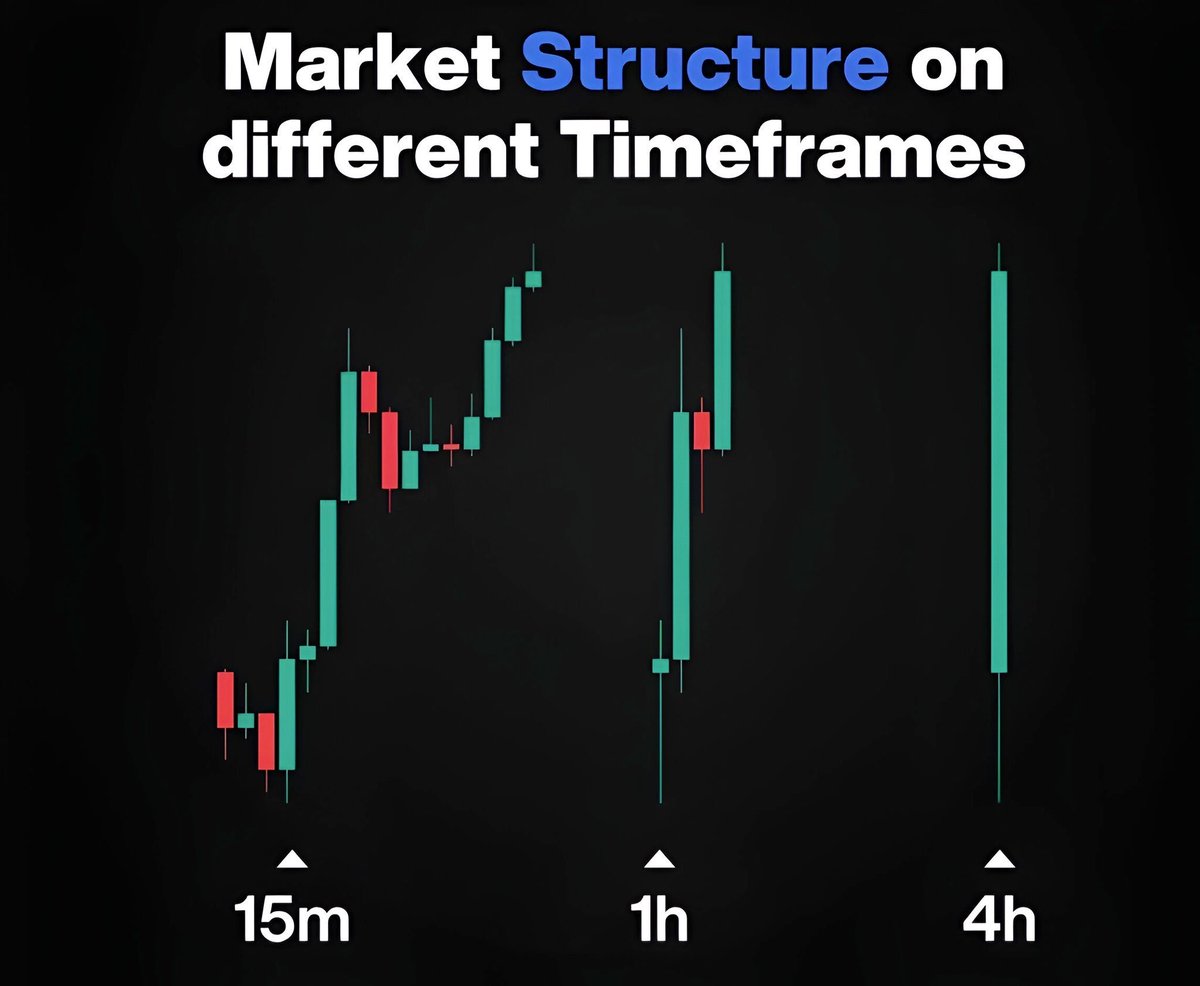
You can use it in all TF, and use this knowledge while trading $BTC or altcoins.
RT and FAV to spread this THREAD is appreciated.
You can use it in all TF, and use this knowledge while trading $BTC or altcoins.
RT and FAV to spread this THREAD is appreciated.
• • •
Missing some Tweet in this thread? You can try to
force a refresh