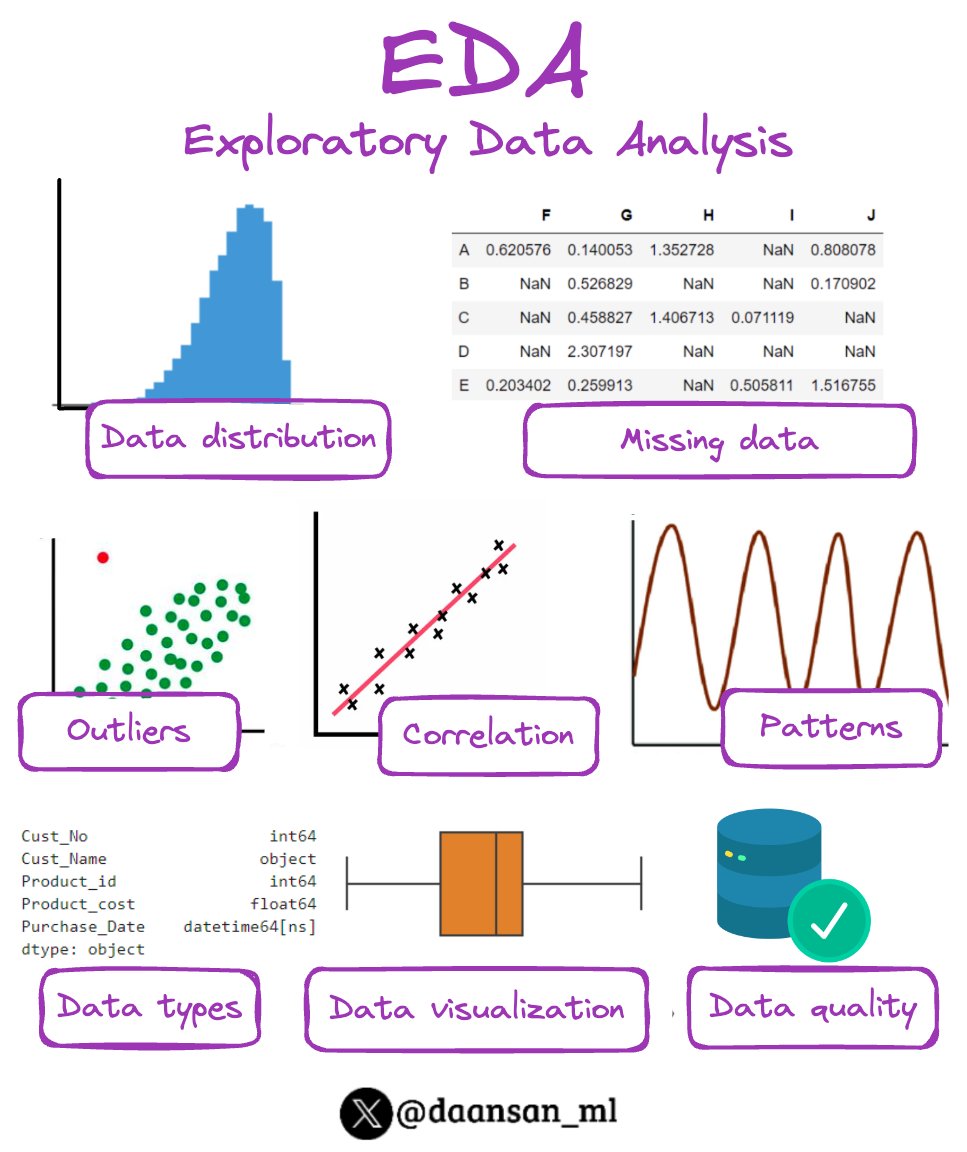
There are several types of data distributions you might encounter in a dataset.
Here are some common ones 👇🧵
Here are some common ones 👇🧵
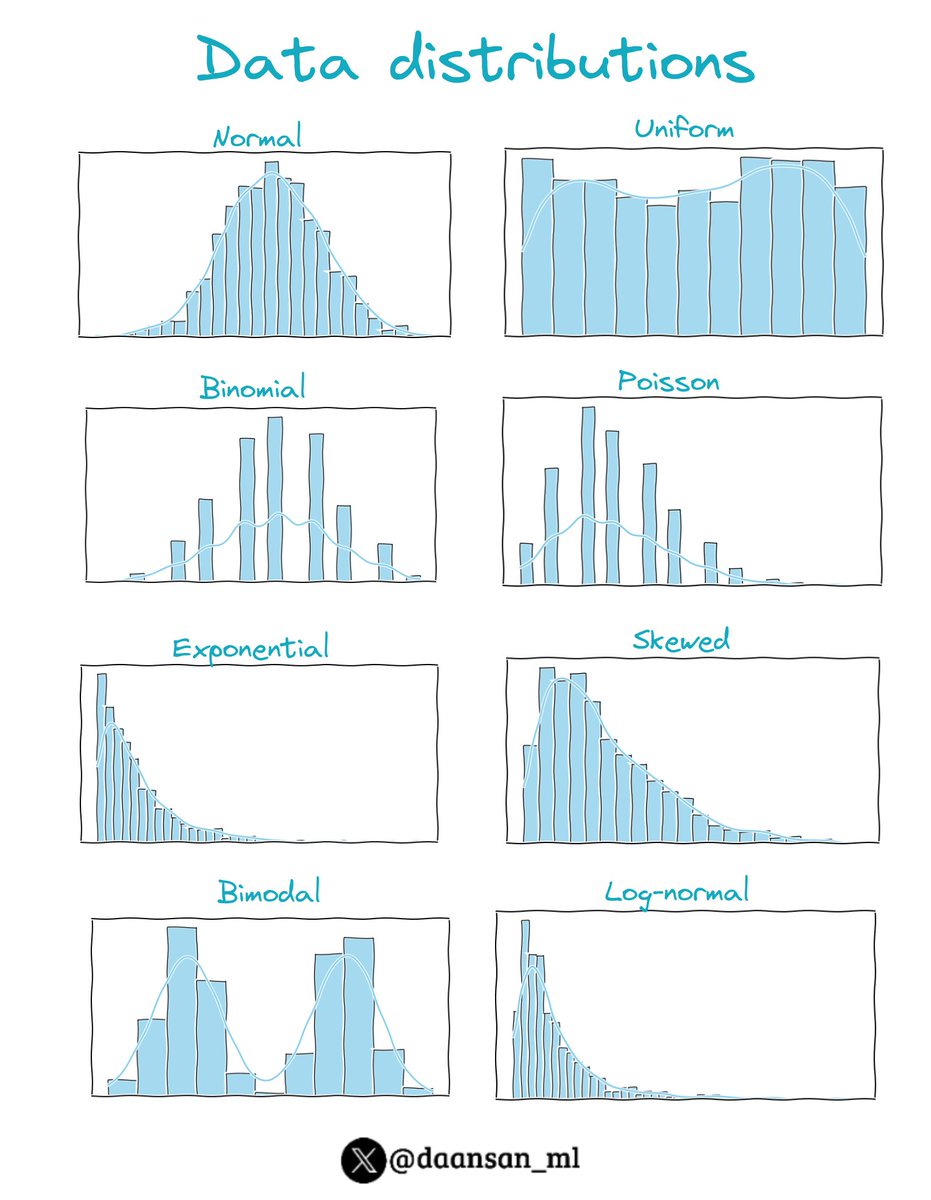
1️⃣ Normal Distribution (Bell Curve):
Characterized by a symmetric bell-shaped curve, where most of the data points cluster around the mean, with fewer and fewer appearing as you move away from the mean.
Characterized by a symmetric bell-shaped curve, where most of the data points cluster around the mean, with fewer and fewer appearing as you move away from the mean.
2️⃣ Uniform Distribution:
Each value within a certain range has an equal probability of occurring. The distribution is flat, with no peaks.
Each value within a certain range has an equal probability of occurring. The distribution is flat, with no peaks.
3️⃣ Binomial Distribution:
Describes the number of successes in a fixed number of trials, with each trial having the same probability of success. It is characterized by a peak at the most probable number of successes.
Describes the number of successes in a fixed number of trials, with each trial having the same probability of success. It is characterized by a peak at the most probable number of successes.
4️⃣ Poisson Distribution:
Used for count-based data, like the number of events happening in a fixed interval of time or space. It is characterized by a peak at lower values, with the frequency of values decreasing as they increase.
Used for count-based data, like the number of events happening in a fixed interval of time or space. It is characterized by a peak at lower values, with the frequency of values decreasing as they increase.
5️⃣ Exponential Distribution:
Describes the time between events in a process where events occur continuously and independently at a constant average rate.
Describes the time between events in a process where events occur continuously and independently at a constant average rate.
6️⃣ Skewed Distribution (Left or Right):
In a skewed distribution, the tail of the distribution is longer on one side. In a right-skewed distribution, the tail is longer on the right, while in a left-skewed distribution, it is longer on the left.
In a skewed distribution, the tail of the distribution is longer on one side. In a right-skewed distribution, the tail is longer on the right, while in a left-skewed distribution, it is longer on the left.
7️⃣ Bimodal/Multimodal Distribution:
A distribution with two or more peaks. These peaks may vary in height and spread.
A distribution with two or more peaks. These peaks may vary in height and spread.
8️⃣ Log-Normal Distribution:
This distribution is applicable when the logarithm of the variable is normally distributed. The distribution is skewed to the right.
This distribution is applicable when the logarithm of the variable is normally distributed. The distribution is skewed to the right.
These distributions are fundamental in statistics and data analysis, as they provide insights into the nature of the data and inform appropriate analytical strategies.
Soon I'll share when you may find each of them and how to handle them to optimise your model...
Follow me and subscribe to 💊 MLPills not to miss it 👇
mlpills.dev/subscribe/
Follow me and subscribe to 💊 MLPills not to miss it 👇
mlpills.dev/subscribe/
You should also join our newsletter, DSBoost🚀
Every week we share:
🔹Interviews
🔹Podcast notes
🔹Learning resources
🔹Interesting collections of content
Subscribe for free👇👇
dsboost.dev
Every week we share:
🔹Interviews
🔹Podcast notes
🔹Learning resources
🔹Interesting collections of content
Subscribe for free👇👇
dsboost.dev
• • •
Missing some Tweet in this thread? You can try to
force a refresh