PMC COVID-19 Tracker, Nov 27, 2023
❄️ The winter surge is coming! ❄️
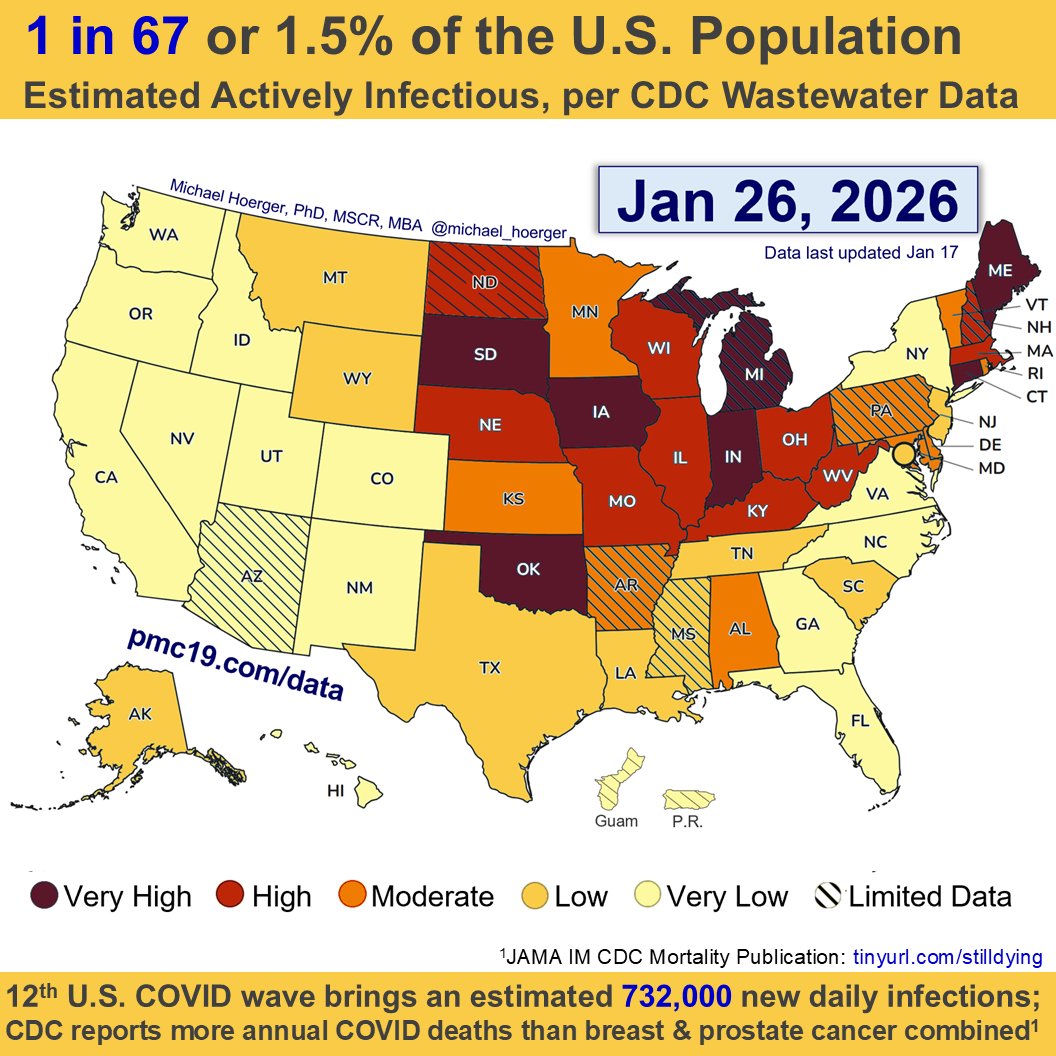
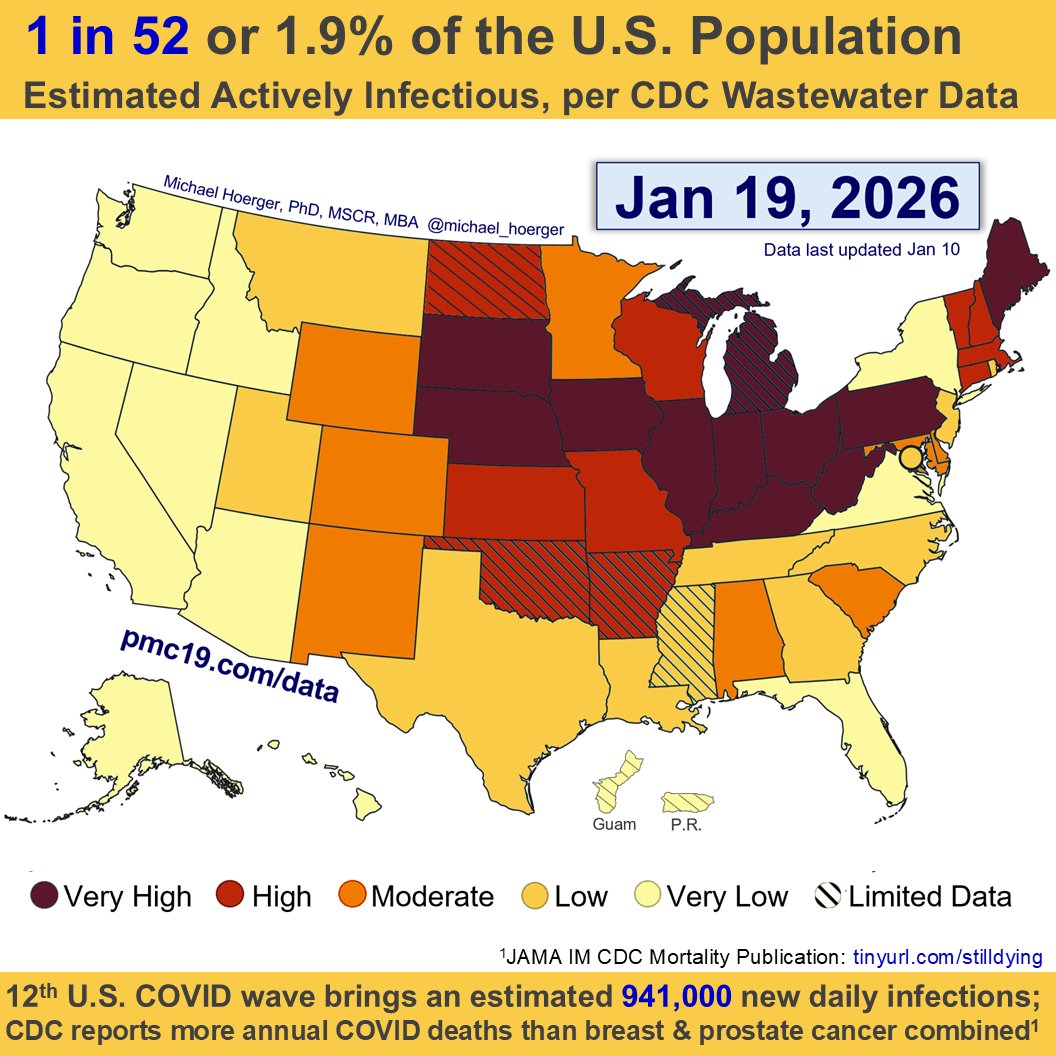
Today:
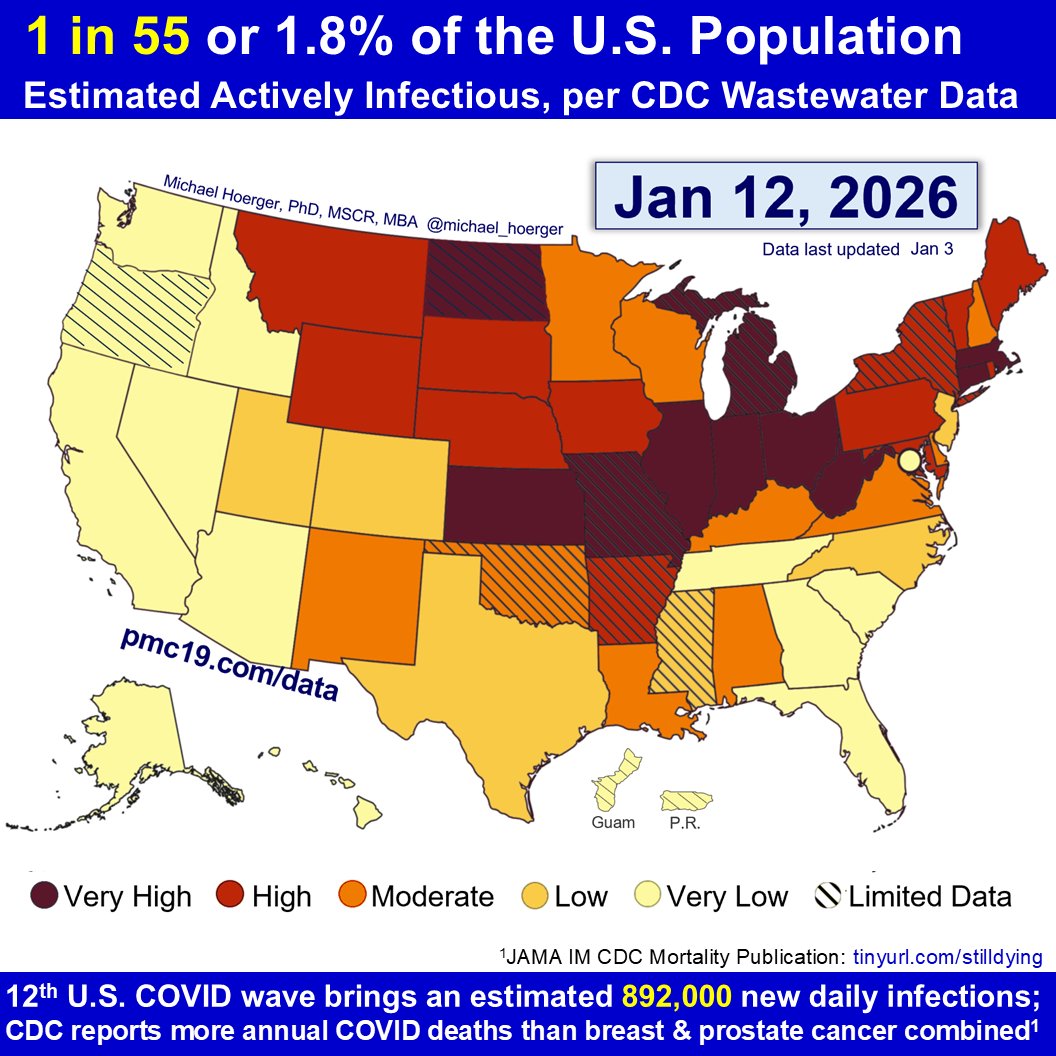
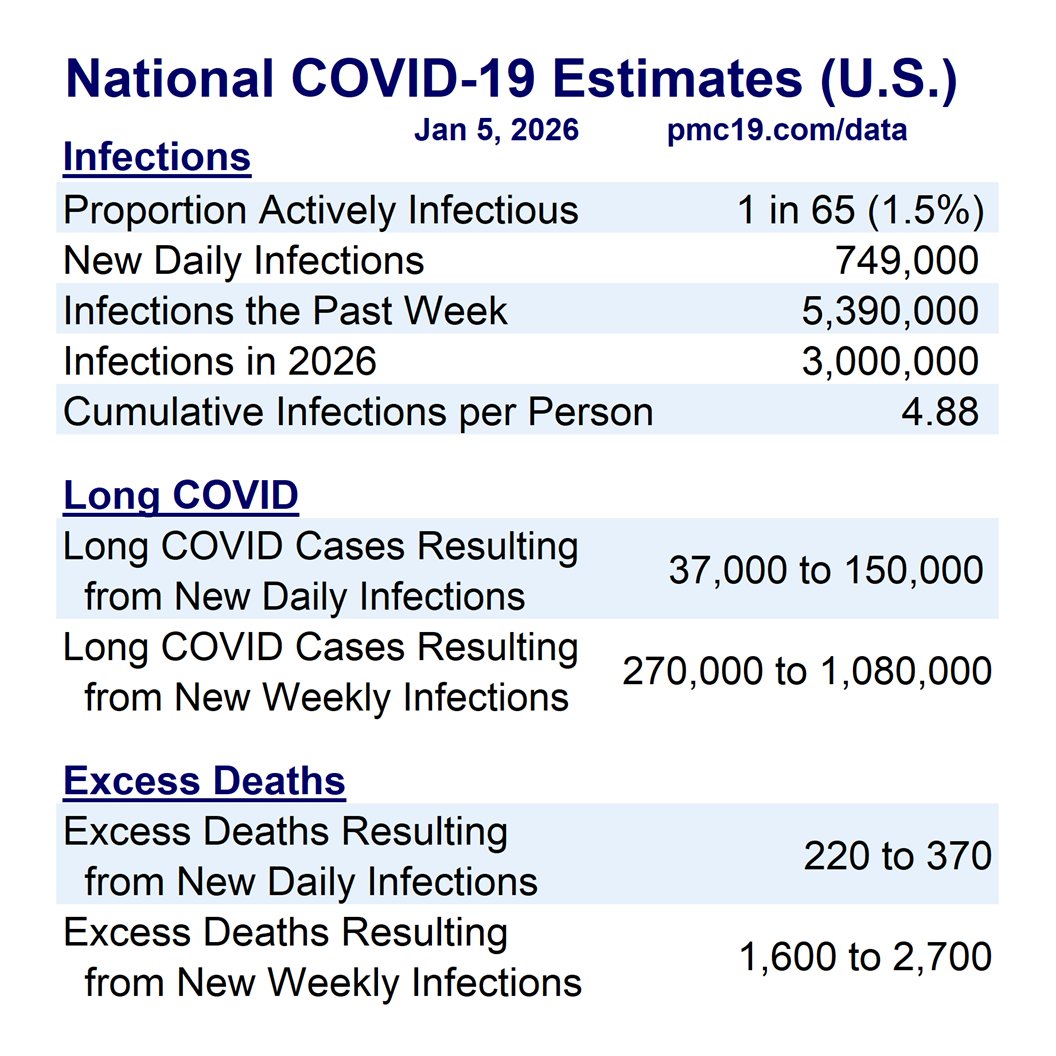
🔹886,000 daily cases
🔹1 in 54 infectious (1.9%)
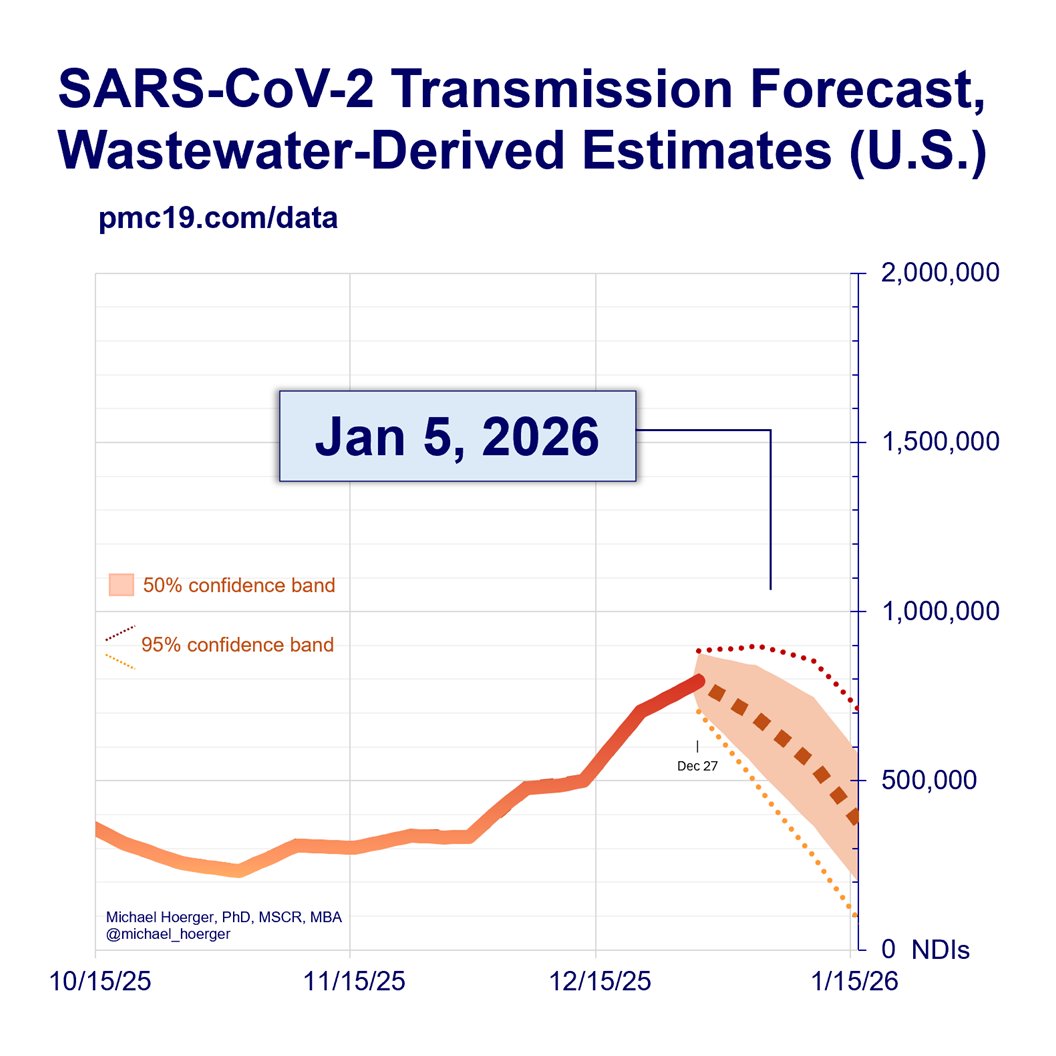
In 4 weeks (Christmas Day):
🔹1.5 million daily cases
🔹1 in 32 infectious (3.1%)
1/

❄️ The winter surge is coming! ❄️
Today:
🔹886,000 daily cases
🔹1 in 54 infectious (1.9%)
In 4 weeks (Christmas Day):
🔹1.5 million daily cases
🔹1 in 32 infectious (3.1%)
1/

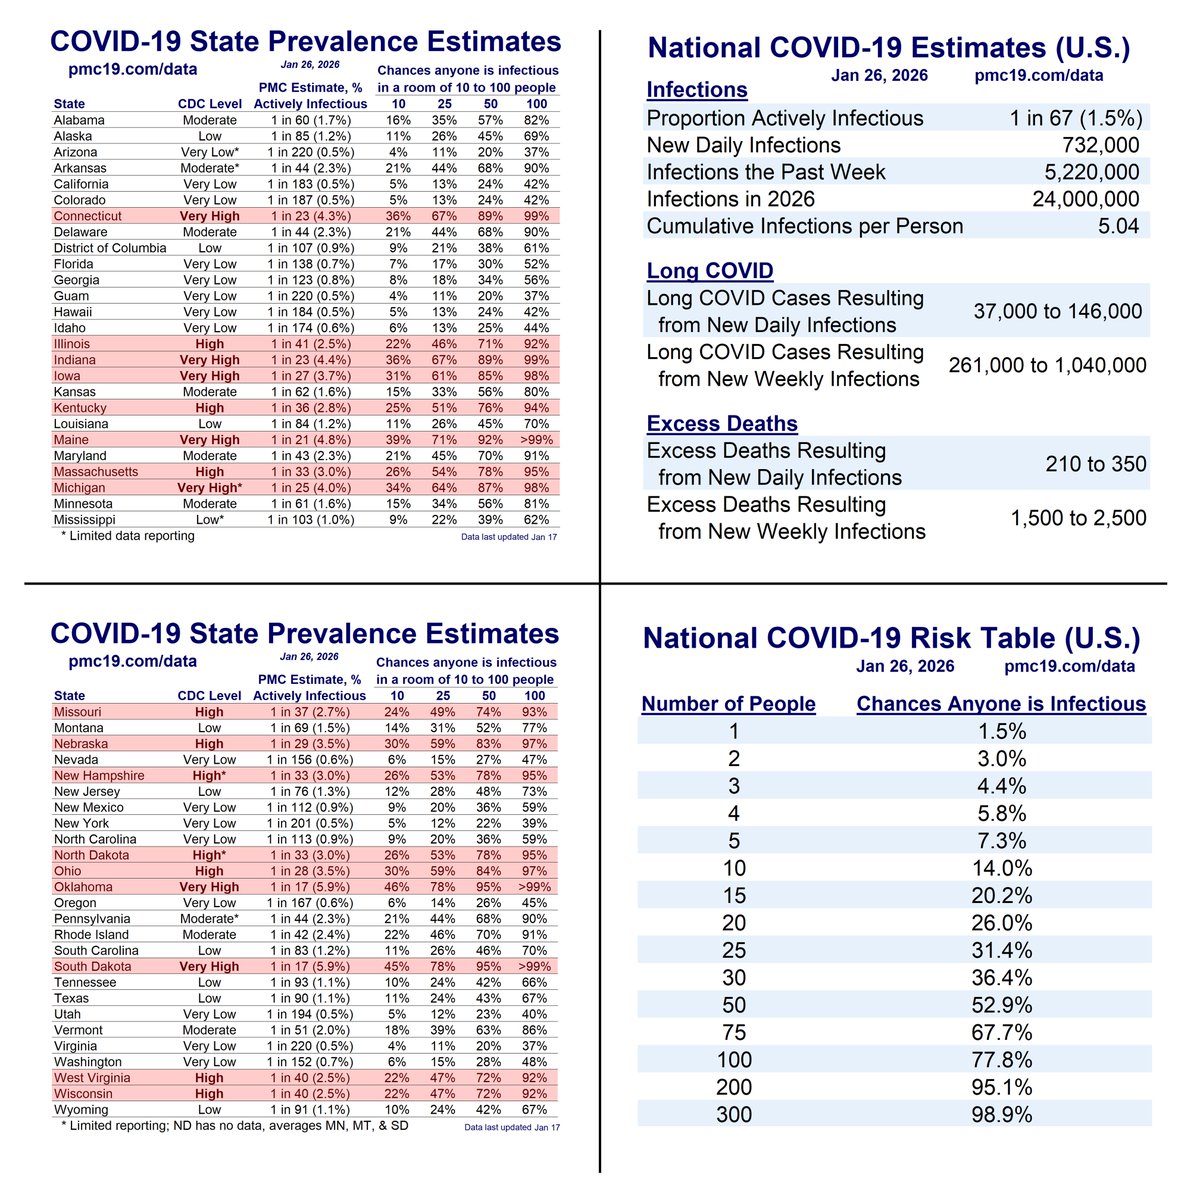
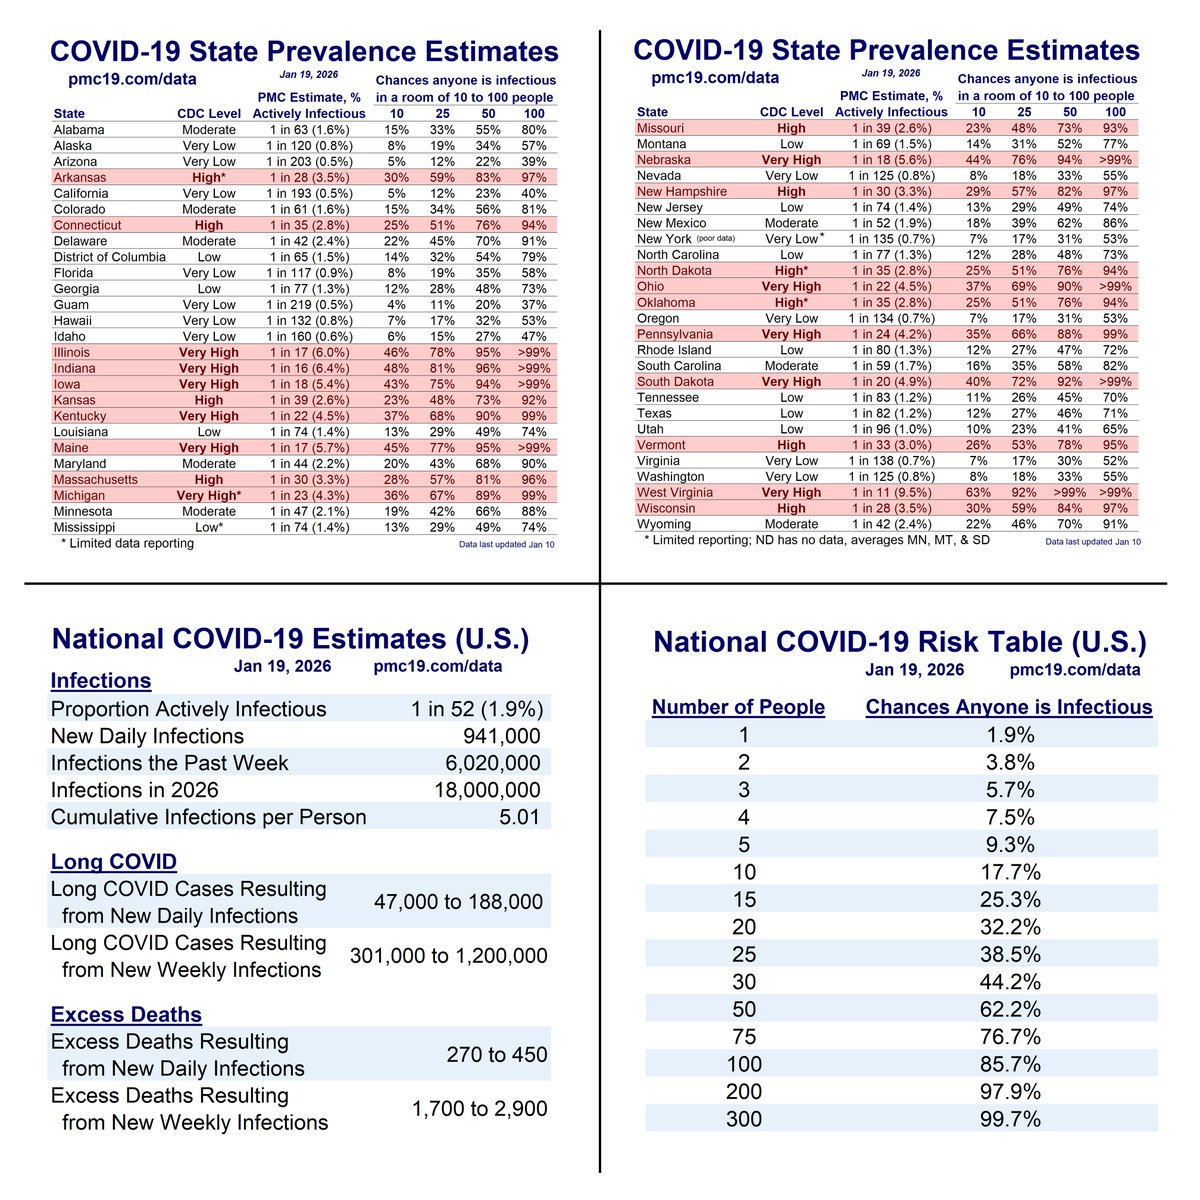
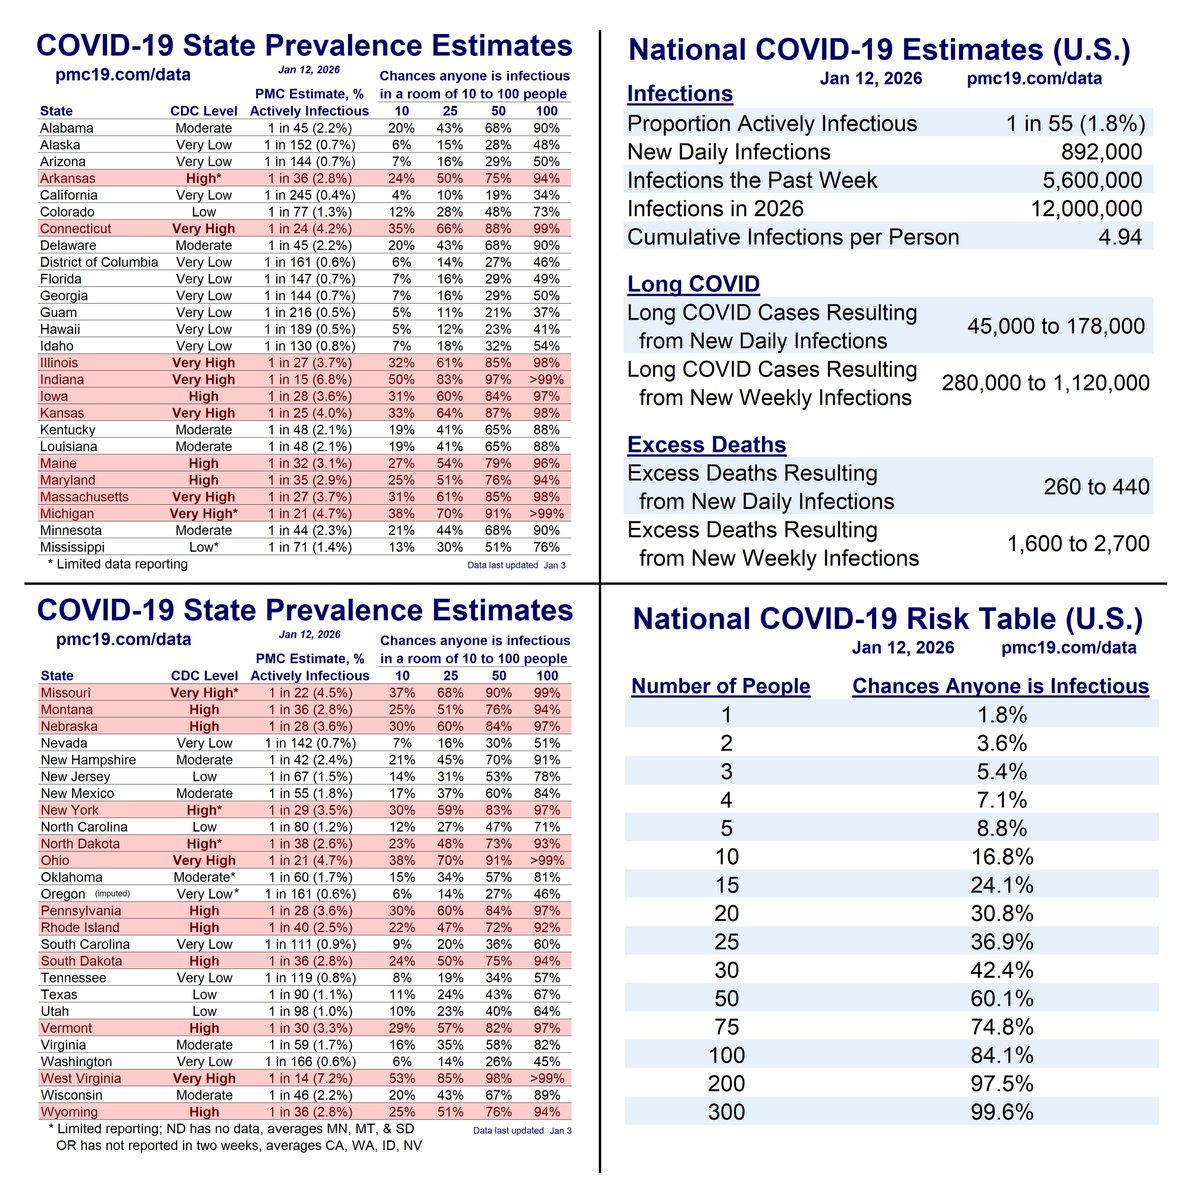
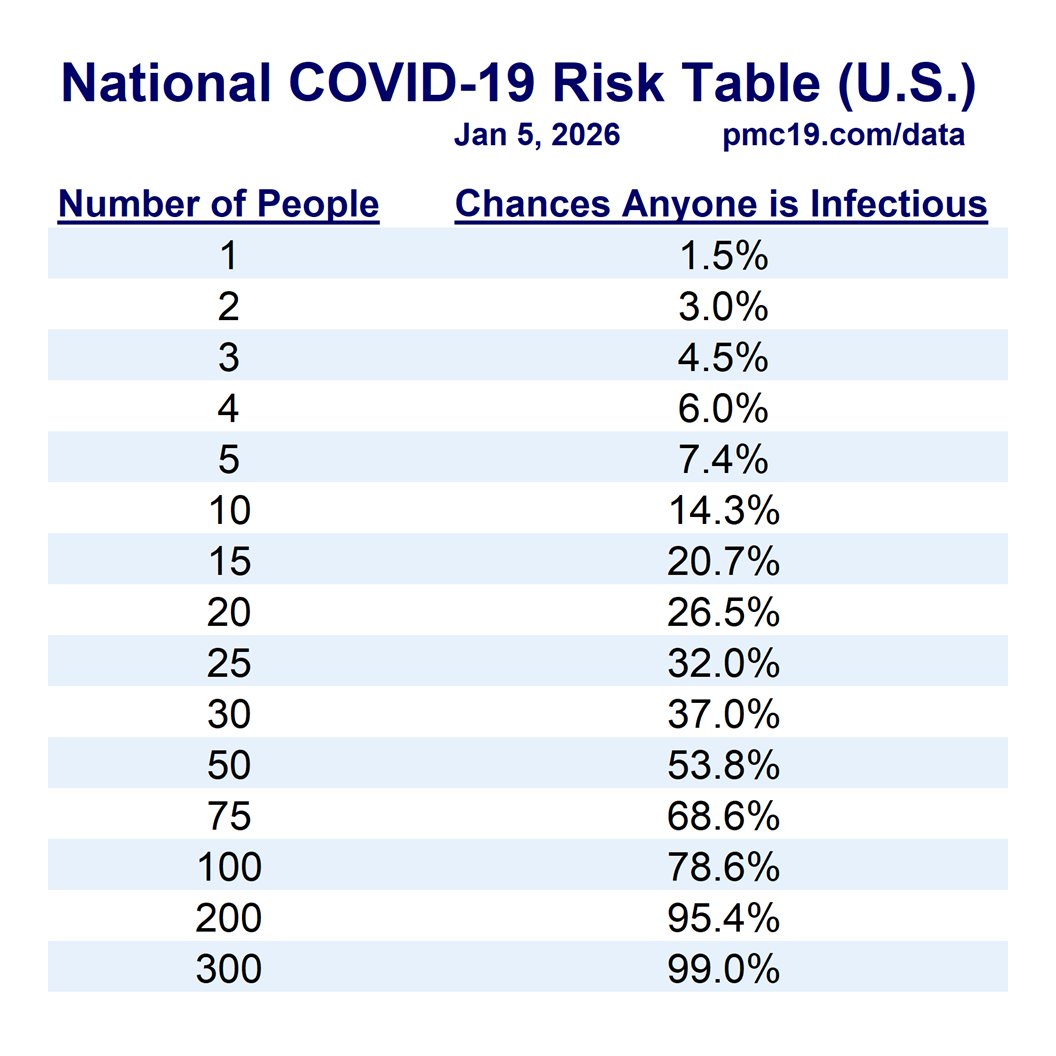
For Nov 27, what is the COVID risk in the office, a classroom, or at a social gathering?
Bad.
10 people (daycare, team meeting) = 17% chance someone is infectious
30 people (classroom) = 43% chance
50 people (lecture, restaurant) = 61% chance
2/
Bad.
10 people (daycare, team meeting) = 17% chance someone is infectious
30 people (classroom) = 43% chance
50 people (lecture, restaurant) = 61% chance
2/

For Dec 25, what's the risk of COVID?
8-10 people (small gathering) = 25% chance someone is infectious
20 people (visiting two families) = 47% chance
100 people (flight, restaurant, etc.) = 96% chance
Limit gatherings, #MaskUp, #VaxUp, Test/Isolate, #CleanTheAir
3/
8-10 people (small gathering) = 25% chance someone is infectious
20 people (visiting two families) = 47% chance
100 people (flight, restaurant, etc.) = 96% chance
Limit gatherings, #MaskUp, #VaxUp, Test/Isolate, #CleanTheAir
3/

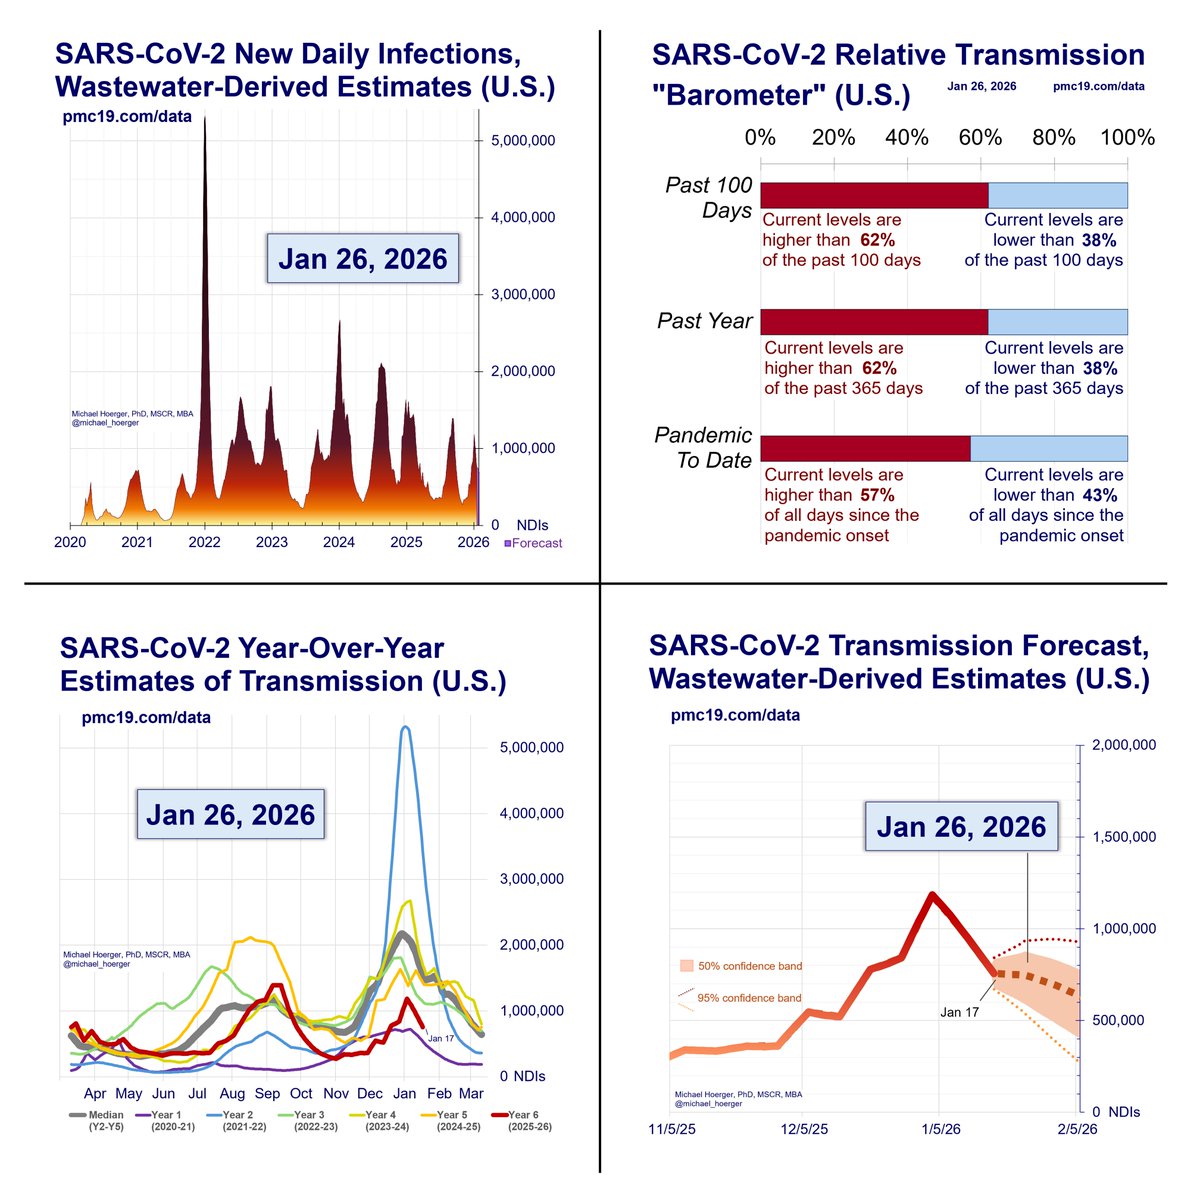
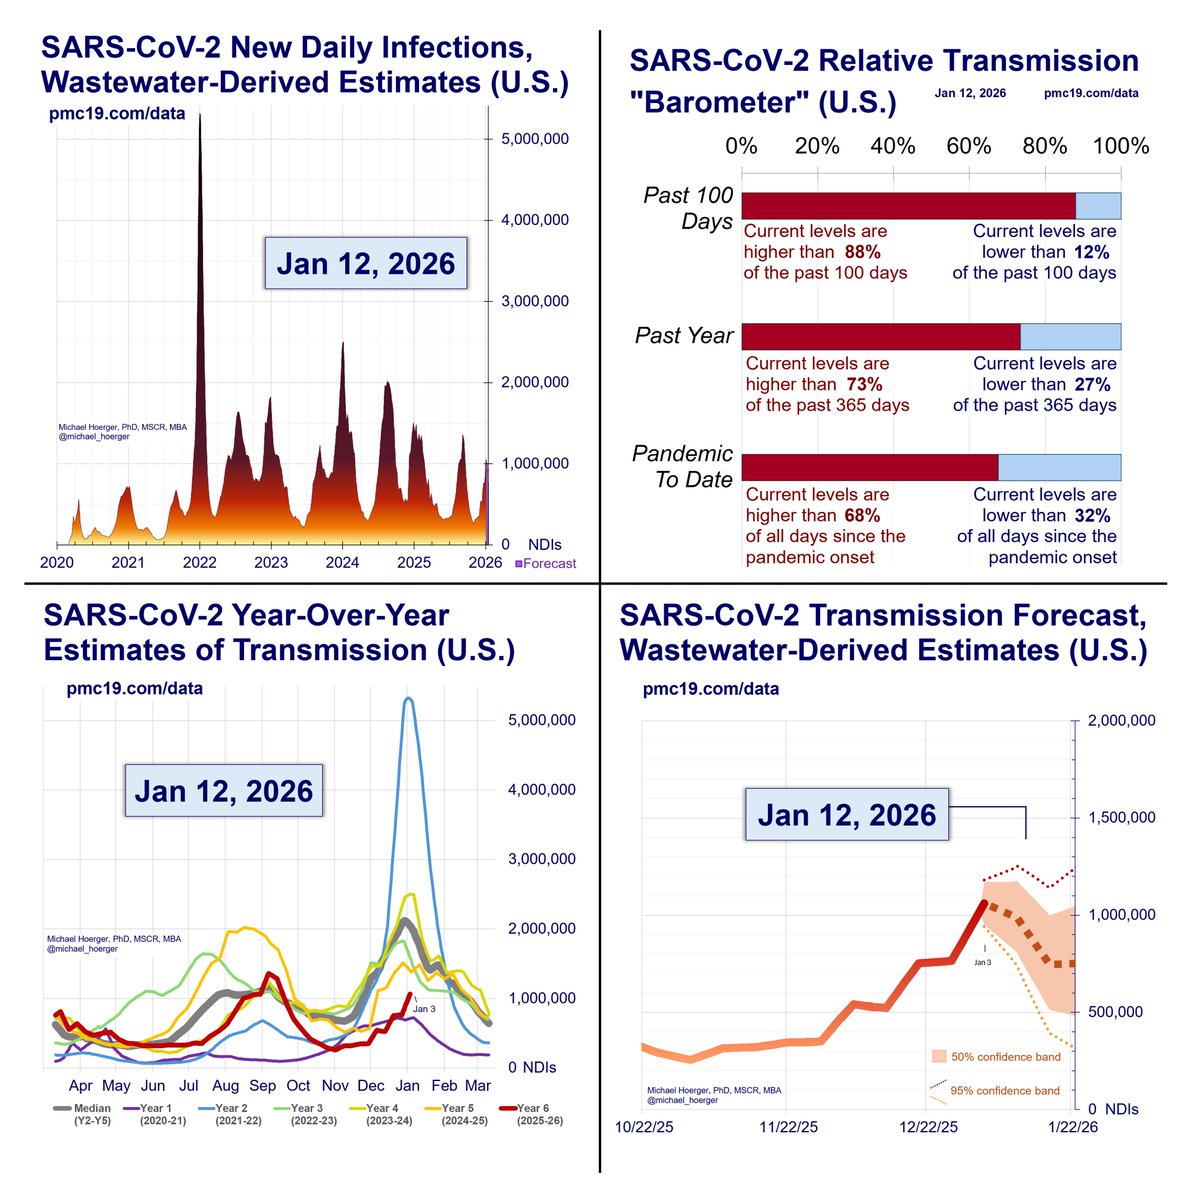
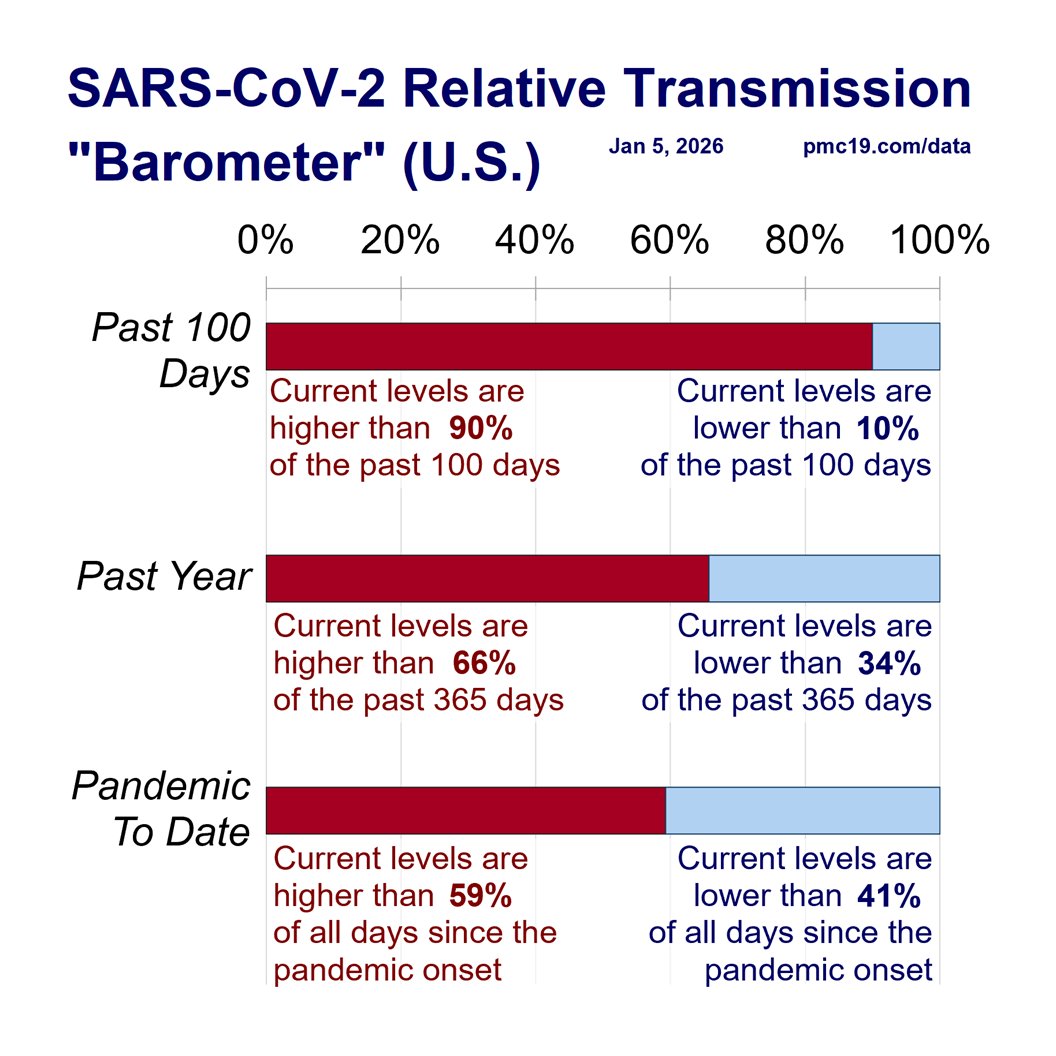
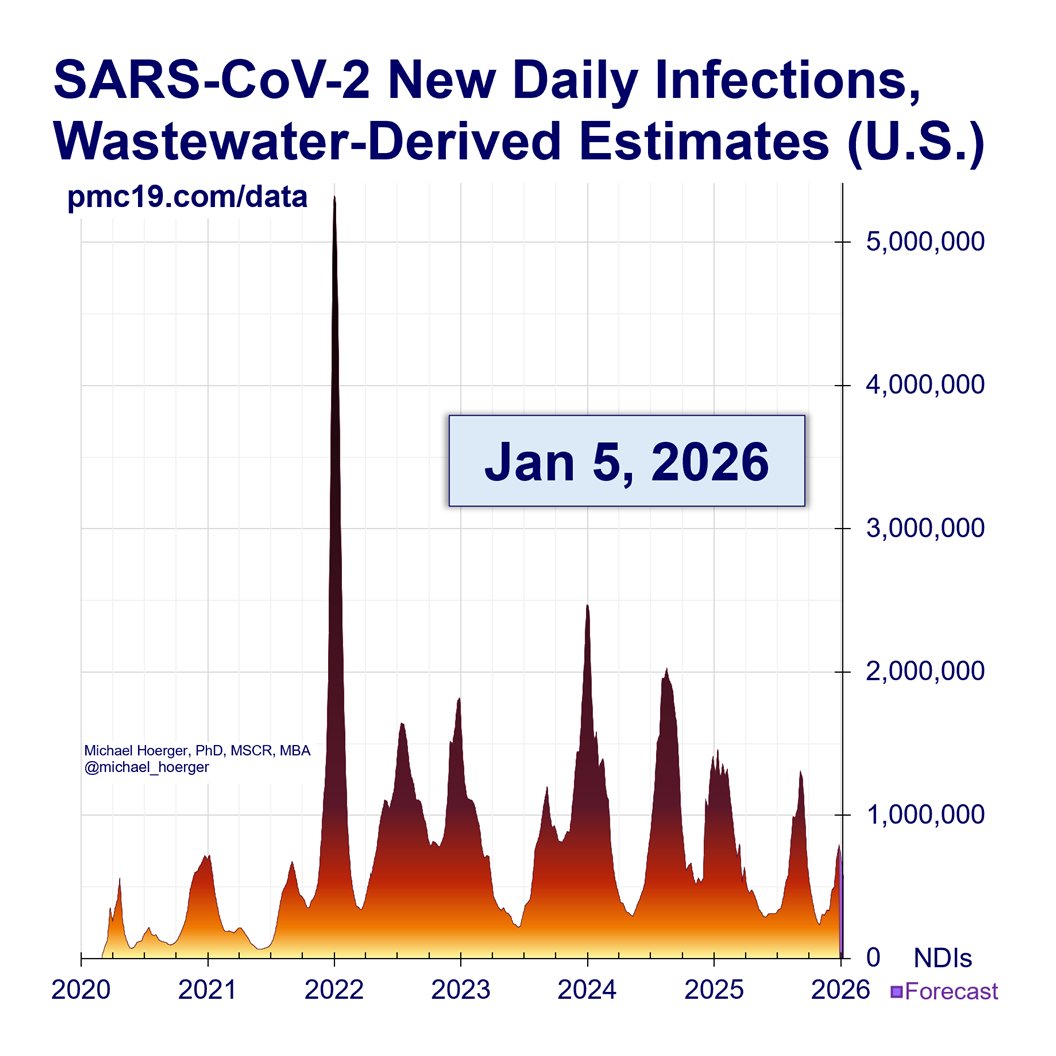
Zooming out to the full pandemic shows the harm of the 8th U.S. Covid wave.
🔹More daily infections that 2/3 of the pandemic
🔹25x more actual than reported cases
🔹44,000 #LongCovid cases/day eventually resulting from these infections
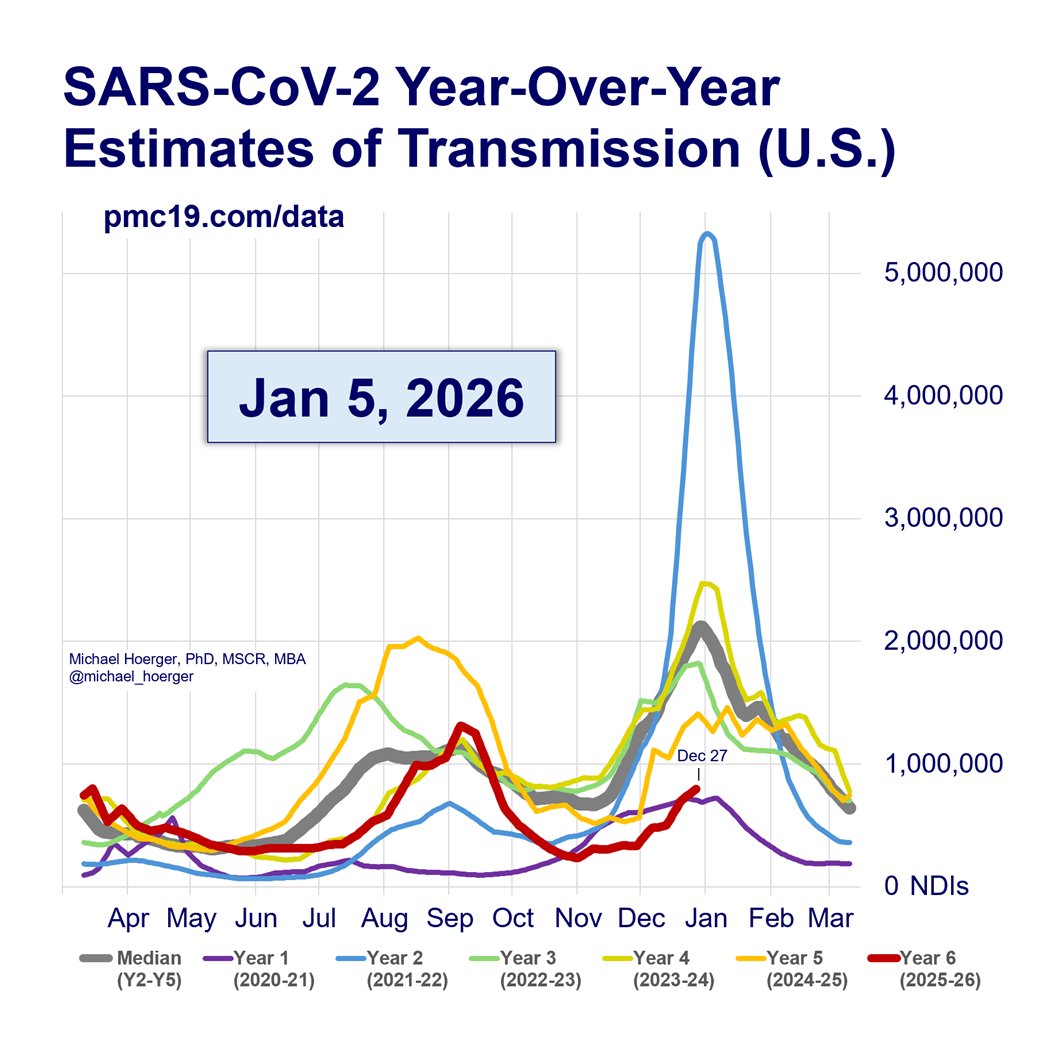
🔹Winter peak similar to last year
4/
🔹More daily infections that 2/3 of the pandemic
🔹25x more actual than reported cases
🔹44,000 #LongCovid cases/day eventually resulting from these infections
🔹Winter peak similar to last year
4/

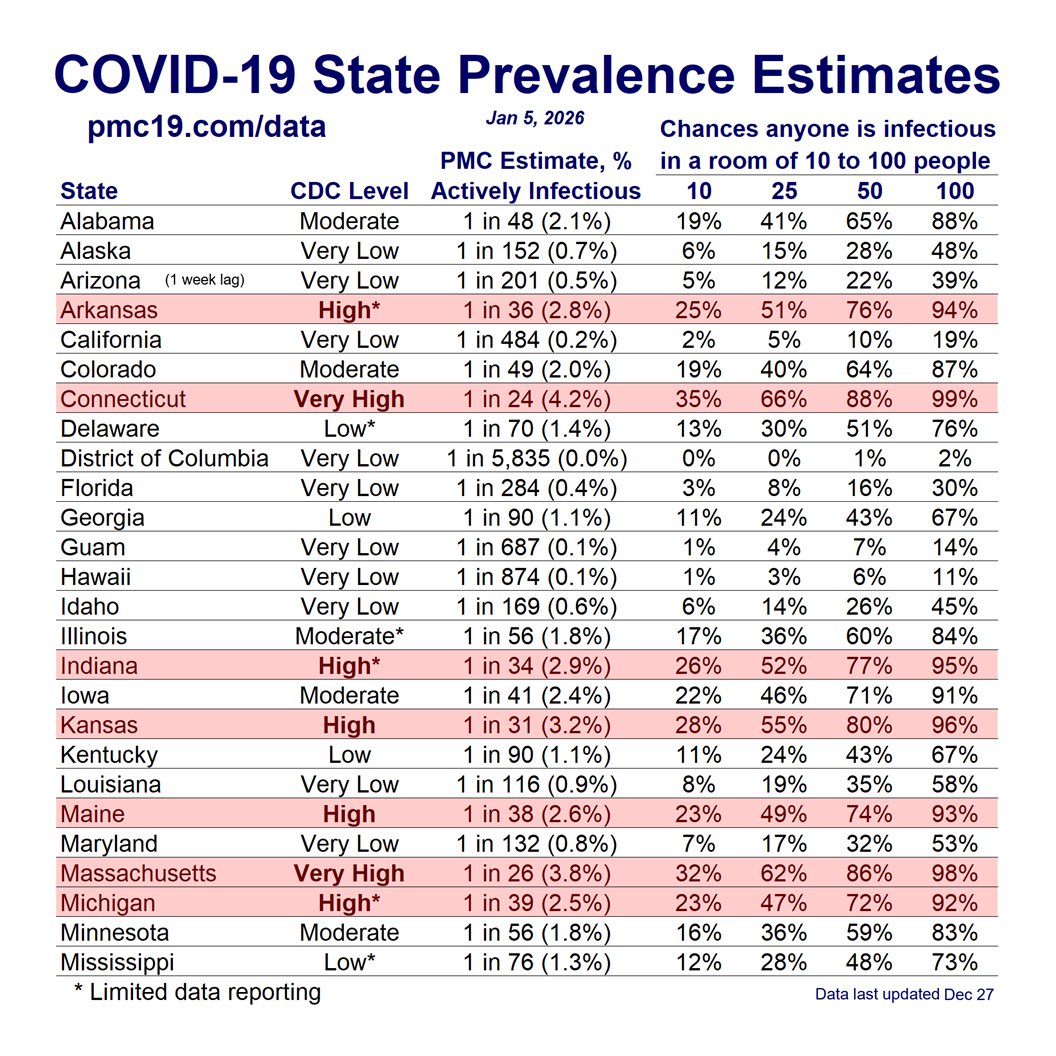
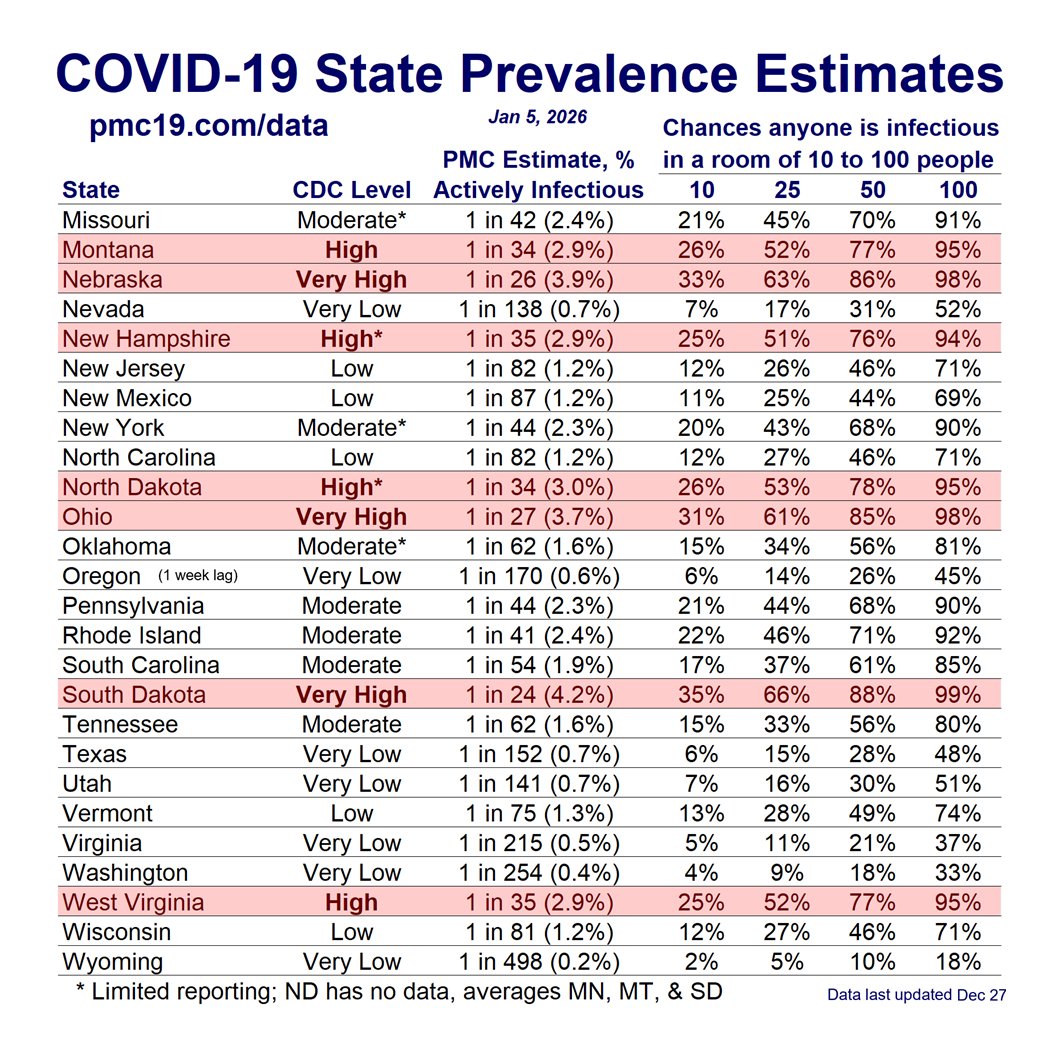
Here's the full PMC Dashboard for Nov 27 to Dec 25.
You can read the full report here:
Thank you for your continued questions, suggestions, gratitude, and sharing across other platforms. Please offer any success stories to encourage others.
5/ pmc19.com/data/

You can read the full report here:
Thank you for your continued questions, suggestions, gratitude, and sharing across other platforms. Please offer any success stories to encourage others.
5/ pmc19.com/data/

• • •
Missing some Tweet in this thread? You can try to
force a refresh


