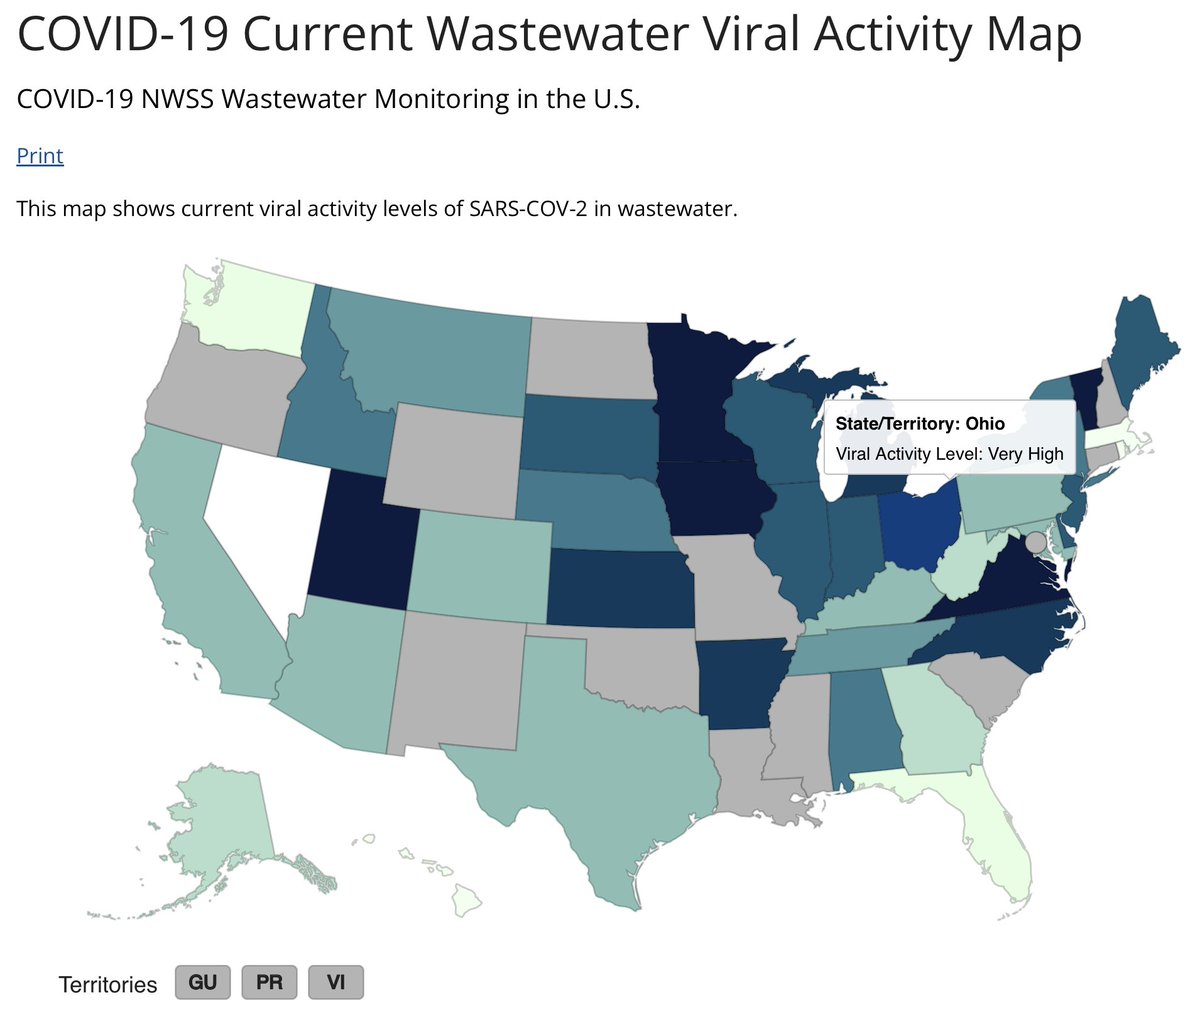
So we did a thing @CDCgov - since arriving there I've become slightly obsessed with waste water measurement.....yes💩......we lead the world in how to detect several different kinds of viral activity weeks before they show up in more traditional data sources (labs, ED visits etc)
Despite the cutting edge science the visualizations of the waste water data on the CDC site were.....underwhelming to say the least.....so we decided to change that....in 4 weeks a tiger team (codename "💩's Clues") totally reimagined how we present the data
Where at a glance you can see national trends in COVID-19 viral activity in wastewater in 1 year, 6 month and 45 day increments 

But wait, there's more! You can also track regional and state level trends in viral activity levels...... 

It was fun and fast paced and my thanks to the incredible team at CDC who willingly ripped up the rule book in the process of making this incredible resource more accessible to a wider audience. Much more to come!
• • •
Missing some Tweet in this thread? You can try to
force a refresh


