In this THREAD I will explain LIQUIDITY:
1. What is Liquidity?
2. How to measure Liquidity?
3. Sell-side Liquidity
4. Buy-side Liquidity
5. Stop hunts
🧵(1/7)
1. What is Liquidity?
2. How to measure Liquidity?
3. Sell-side Liquidity
4. Buy-side Liquidity
5. Stop hunts
🧵(1/7)

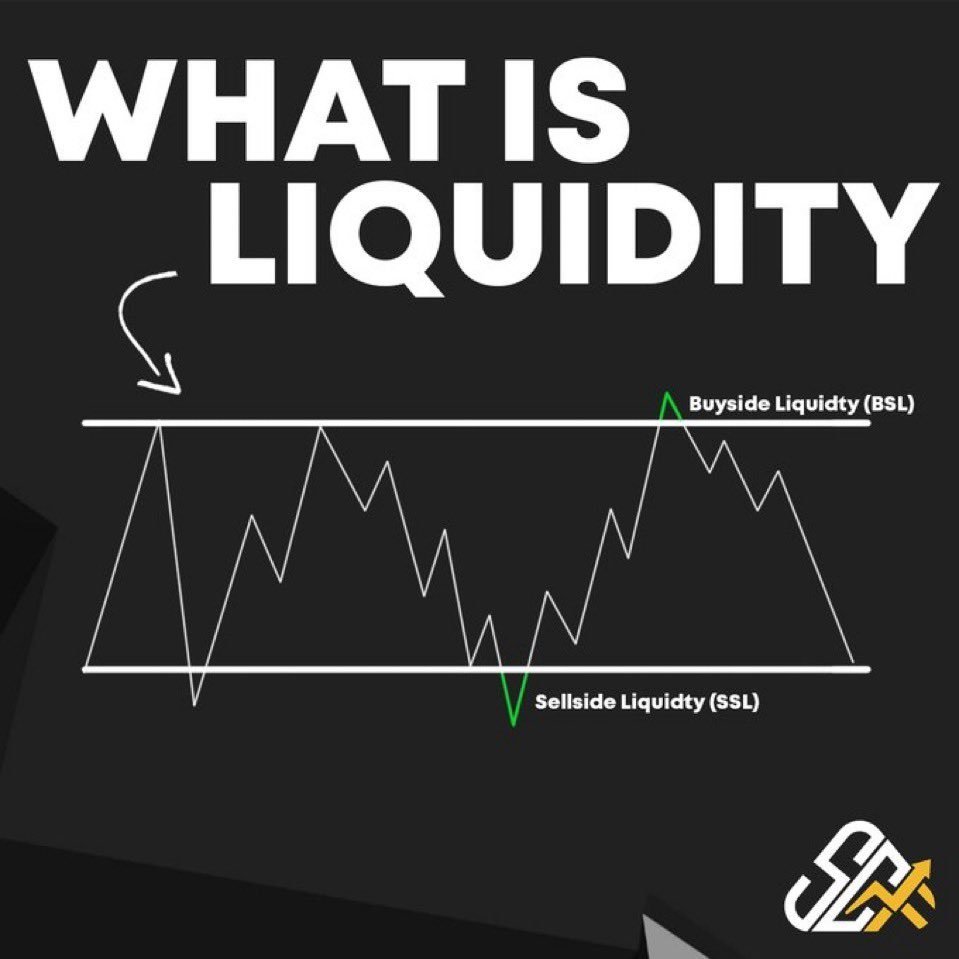
1. What is LIQUIDITY?
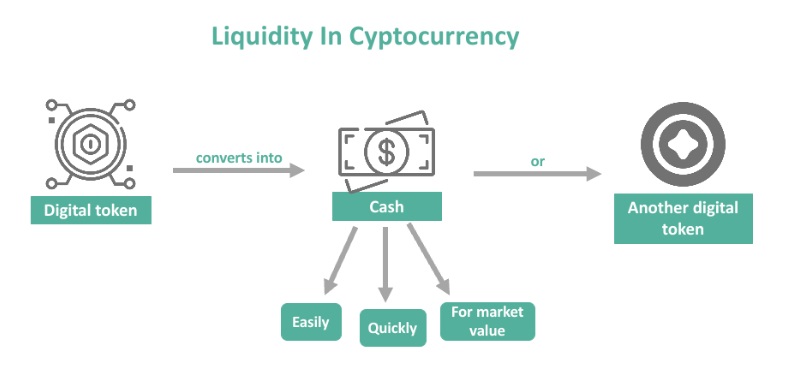
"Liquidity" is the ease with which an asset can be bought or sold in the market without causing a significant impact on the price.
Liquidity is influenced by factors such as trading volume, order book size, and the number of market participants.
"Liquidity" is the ease with which an asset can be bought or sold in the market without causing a significant impact on the price.
Liquidity is influenced by factors such as trading volume, order book size, and the number of market participants.

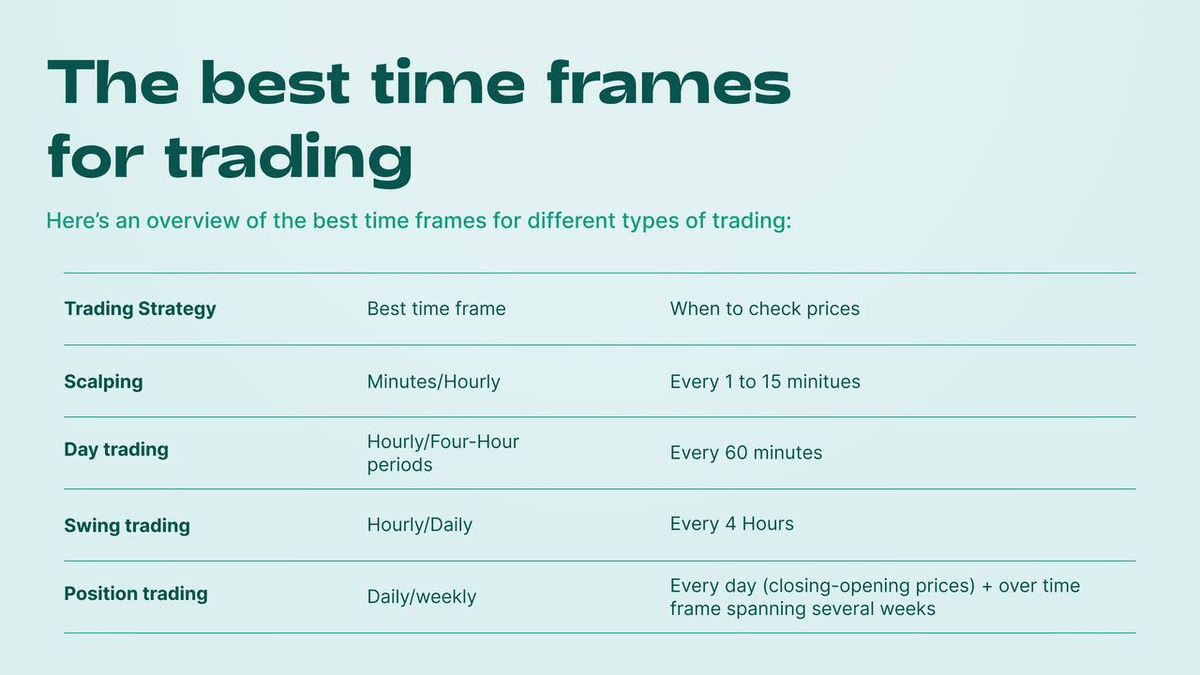
2. How to measure Liquidity?
1. Computing the number of tokens bought/sold in a particular market during a certain TF.
2. Ask spread. Bid-ask spread is obtained by computing the difference between the buyers highest bid price and the sellers lowest ask.
1. Computing the number of tokens bought/sold in a particular market during a certain TF.
2. Ask spread. Bid-ask spread is obtained by computing the difference between the buyers highest bid price and the sellers lowest ask.
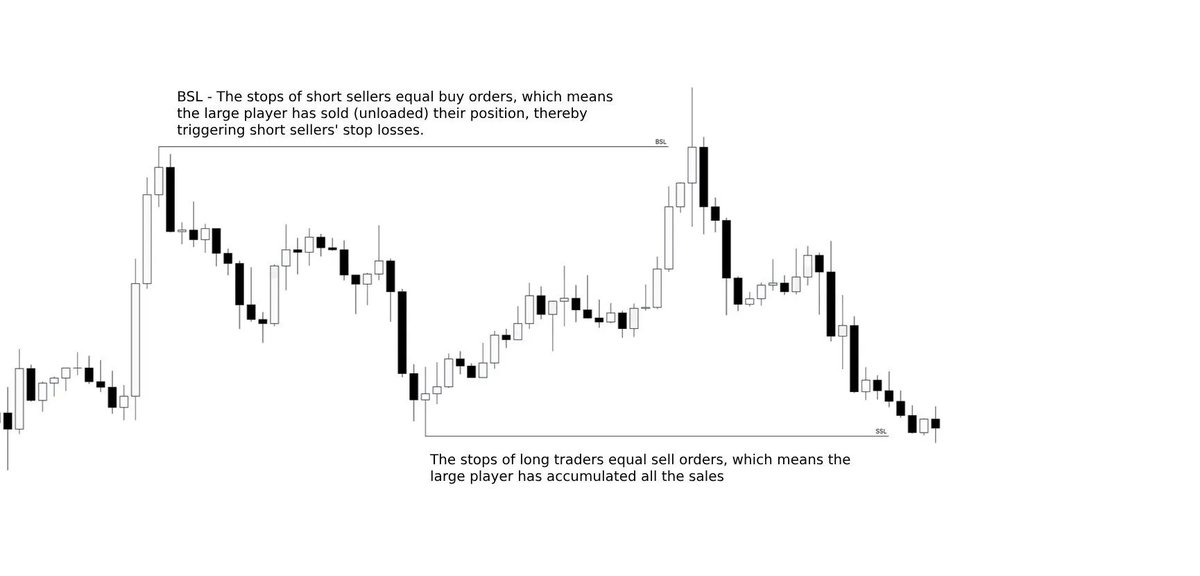
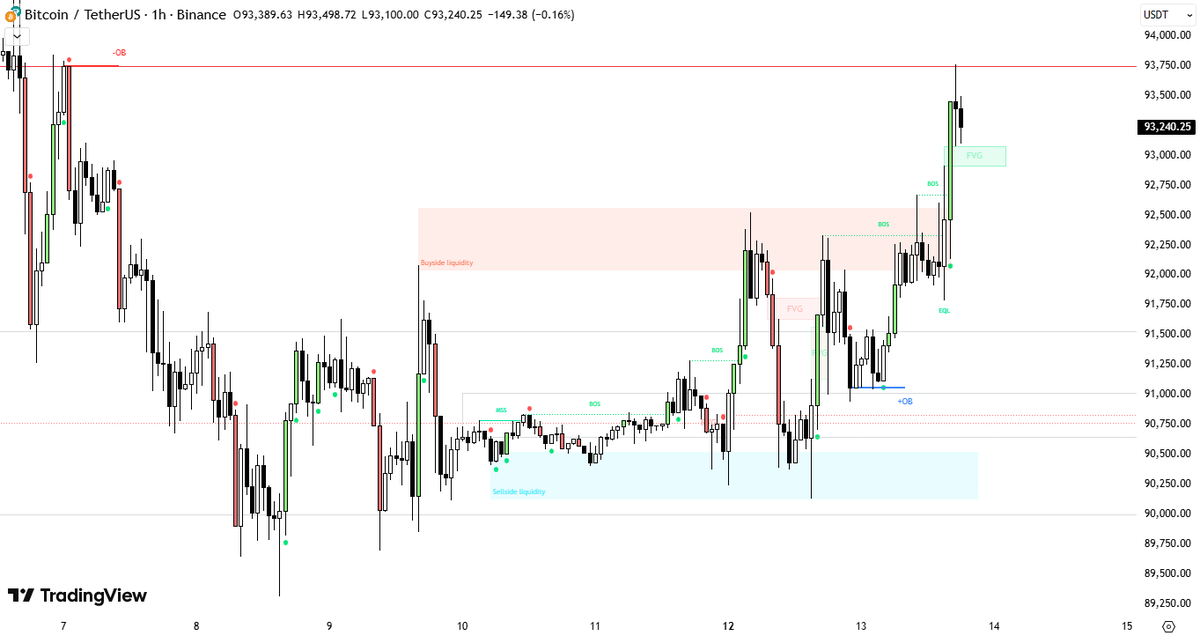
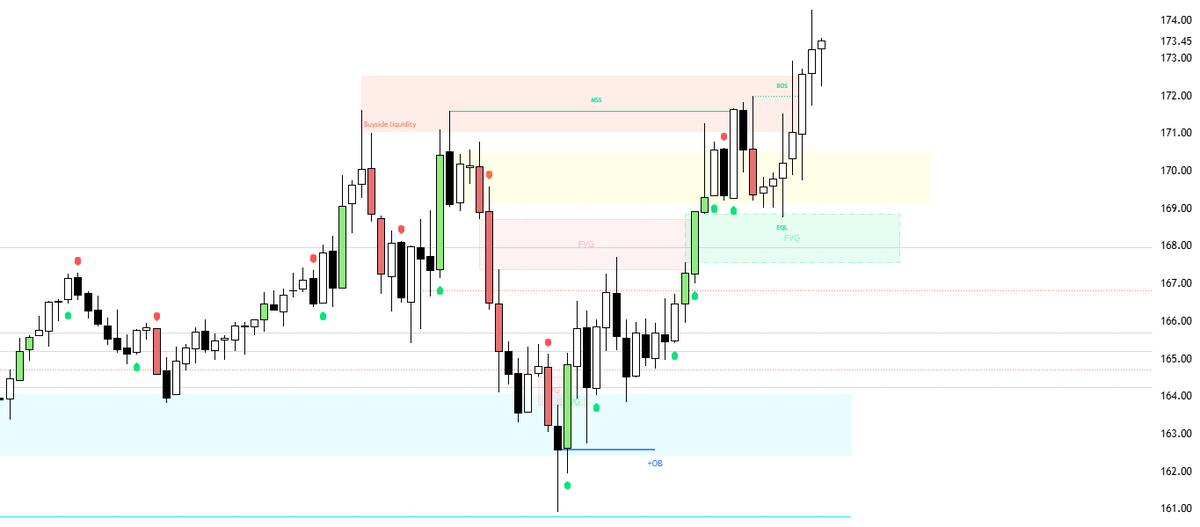
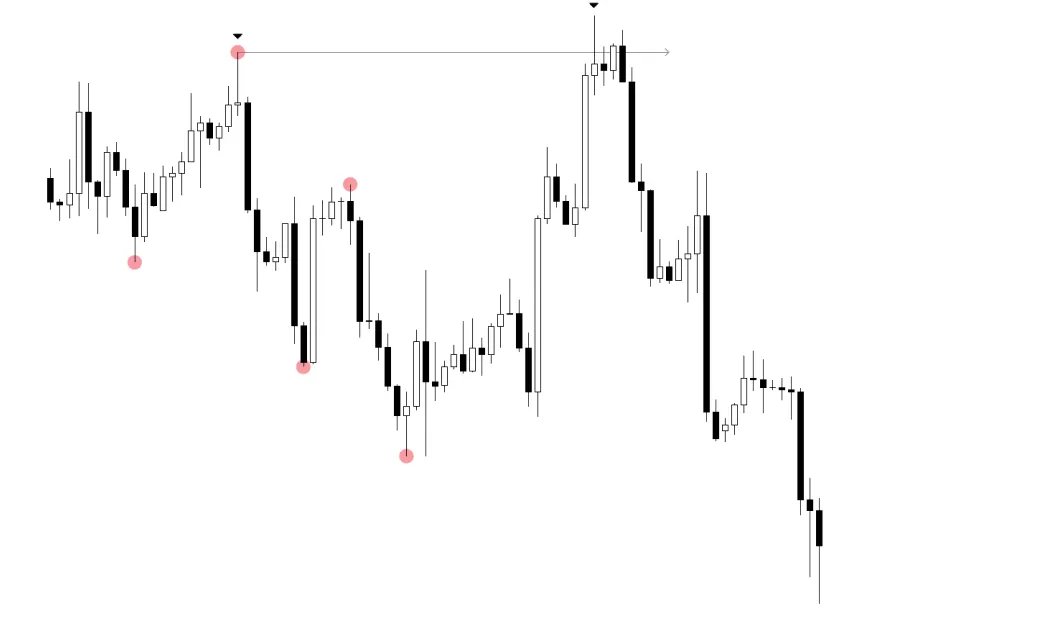
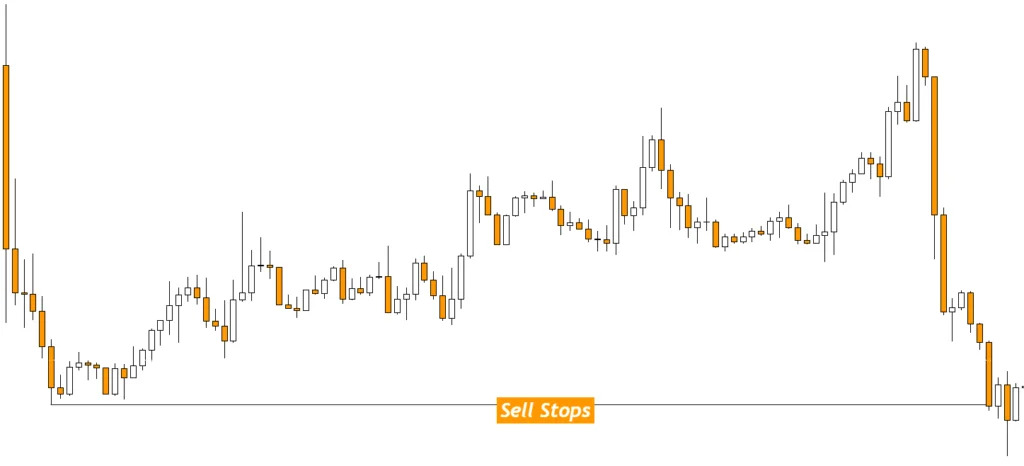
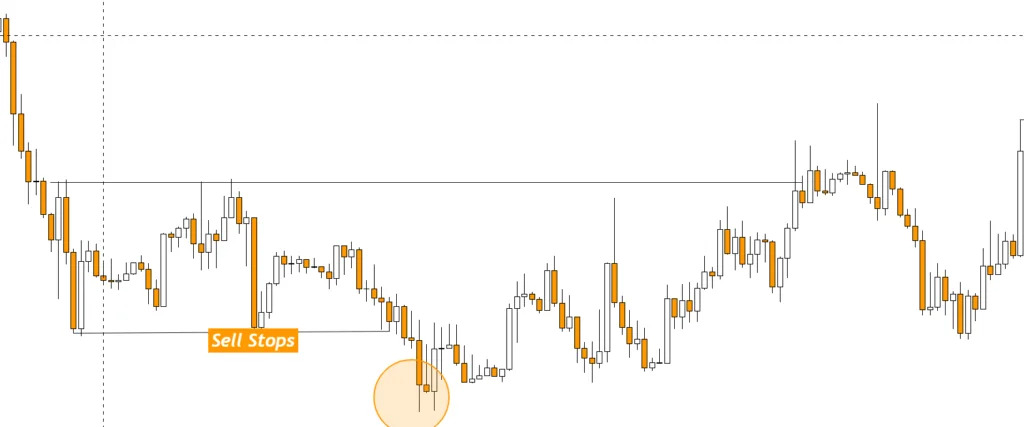
3. Sell-side Liquidity:
Takes place where buyers place their stop losses and expect the price will not retrace to that certain points
This chart shows sell-stop areas. Traders buy and place their sell stops below these points Hunt liquidity can happen before the price moves up
Takes place where buyers place their stop losses and expect the price will not retrace to that certain points
This chart shows sell-stop areas. Traders buy and place their sell stops below these points Hunt liquidity can happen before the price moves up
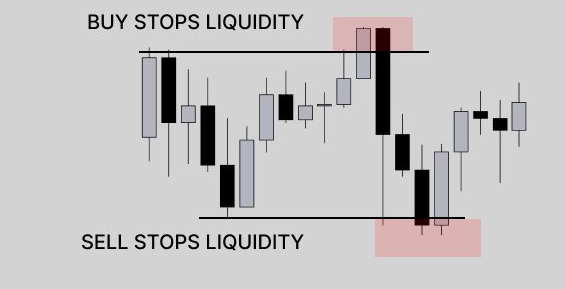
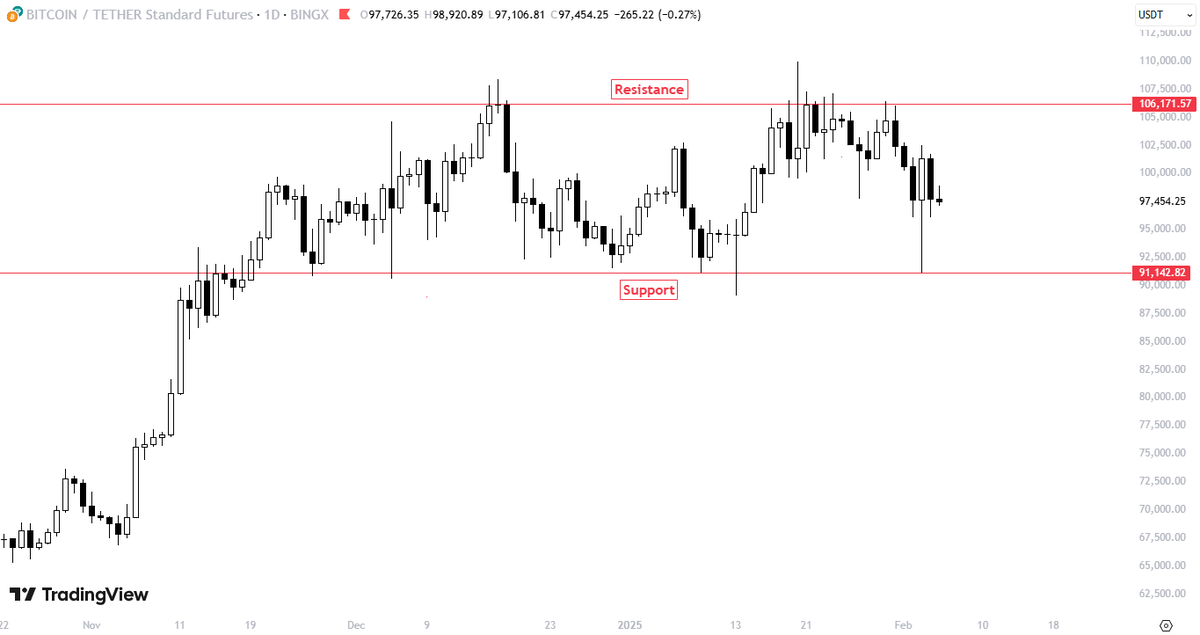
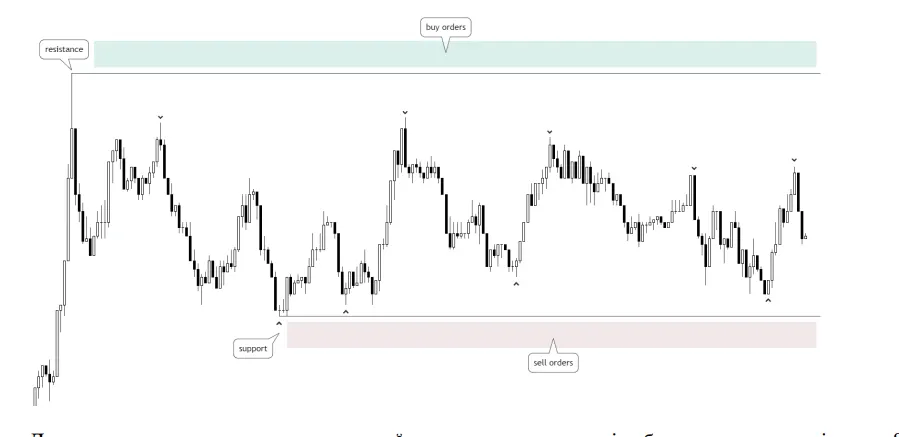
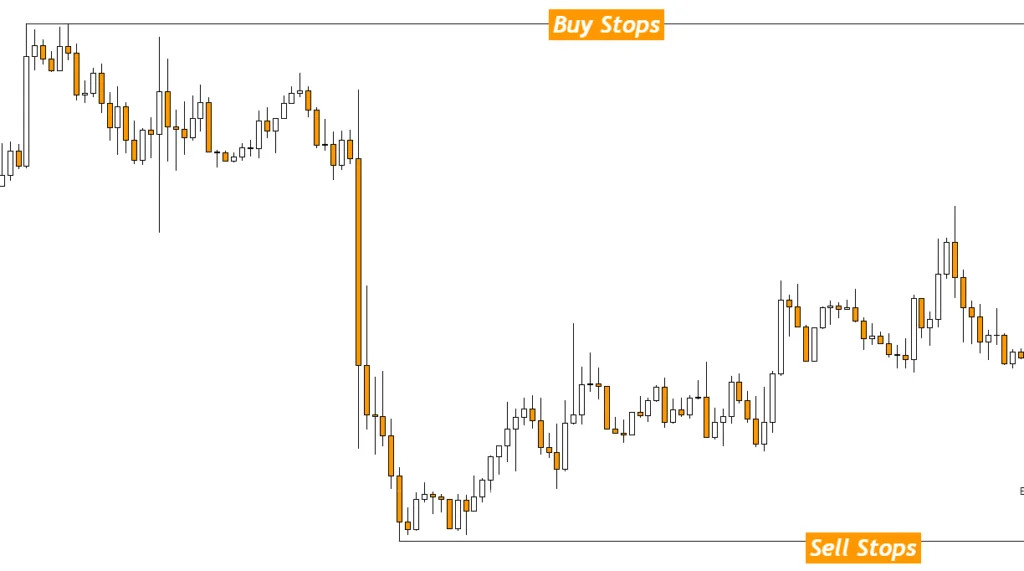
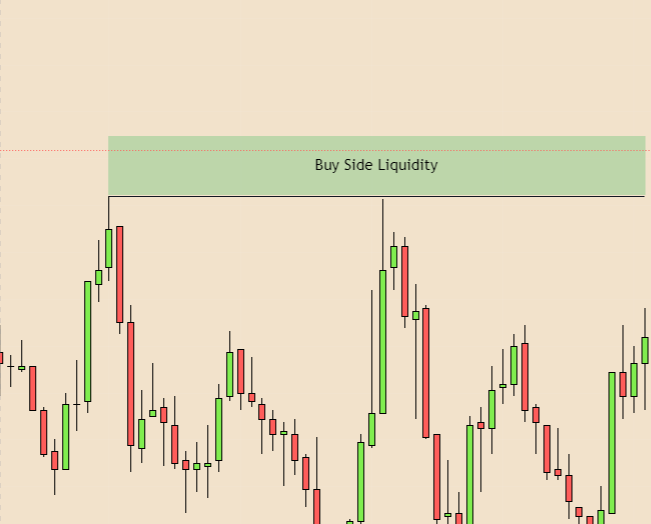
4. Buy-side Liquidity:
Buy-stop orders are usually placed just above or at the same levels as previous highs, where SELLERS have placed their SL.
These highs are considered as resistance levels, holding a significant amount of selling pressure.
Buy-stop orders are usually placed just above or at the same levels as previous highs, where SELLERS have placed their SL.
These highs are considered as resistance levels, holding a significant amount of selling pressure.
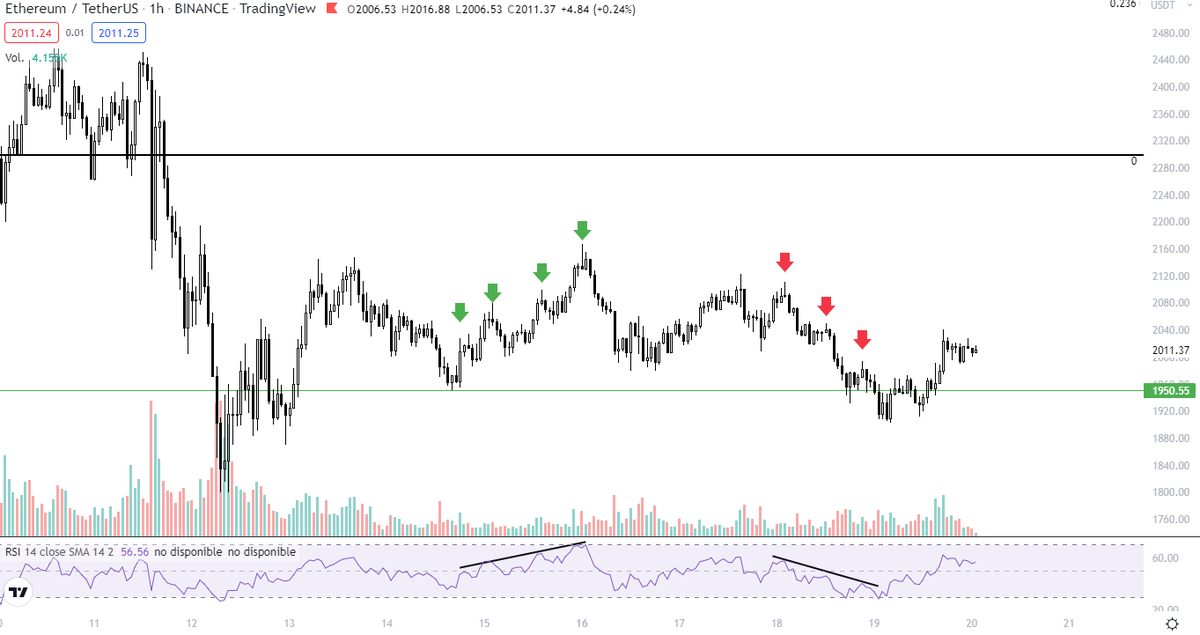
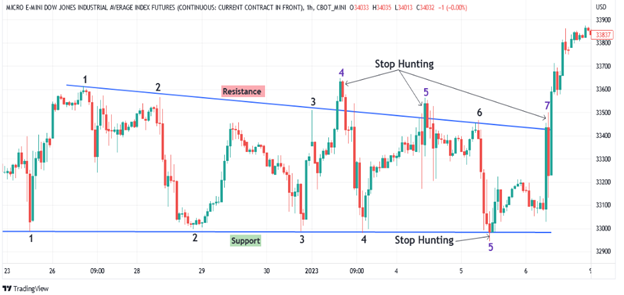
5. Stop hunts:
"Stop hunt" is a strategy that attempts to force some traders out of their positions, by driving the price to a level where many traders have chosen to set their SL.
This practice is called “stop-loss hunt", and generates additional liquidity in the process.
"Stop hunt" is a strategy that attempts to force some traders out of their positions, by driving the price to a level where many traders have chosen to set their SL.
This practice is called “stop-loss hunt", and generates additional liquidity in the process.
I hope this THREAD has helped you to understand the extense concept of LIQUIDITY.
It's a needed knowledge you must have. It's not an easy concept to explain, in this THREAD I only explained the basics from it.
RT and FAV to spread this THREAD is appreciated.
It's a needed knowledge you must have. It's not an easy concept to explain, in this THREAD I only explained the basics from it.
RT and FAV to spread this THREAD is appreciated.
• • •
Missing some Tweet in this thread? You can try to
force a refresh