A quick thread on the history of reported positive covid tests in England, and the relationship to PCR testing. 

What's going on in that graph...
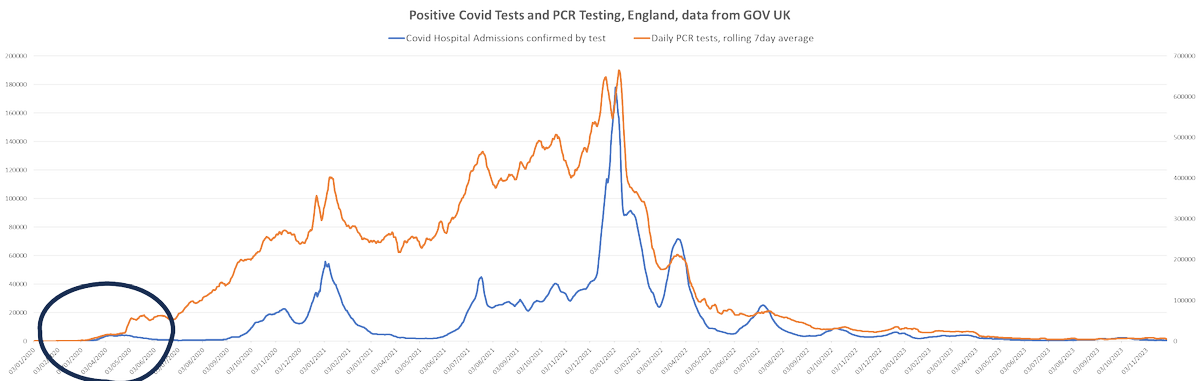
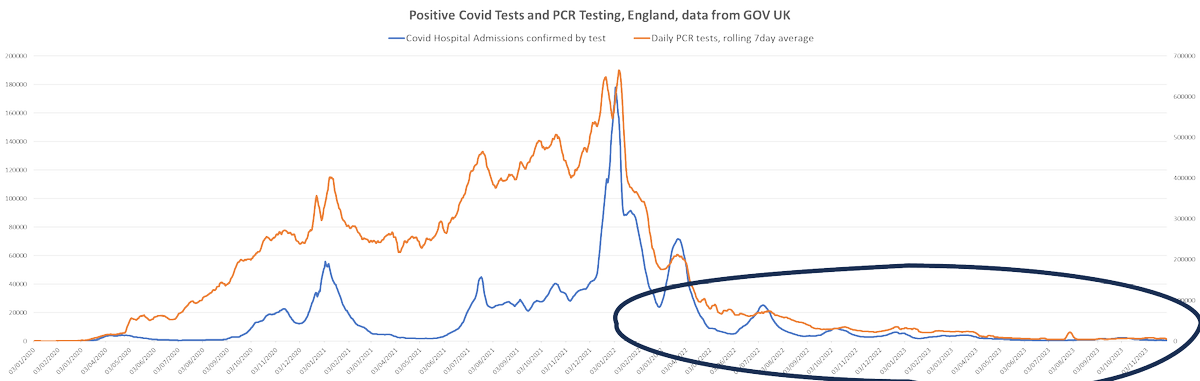
The left hand axis tracks the blue line, reported positive covid tests.
The right hand axis tracks the orange line, pcr tests.
The bottom axis tracks time, from left to right.
The left hand axis tracks the blue line, reported positive covid tests.
The right hand axis tracks the orange line, pcr tests.
The bottom axis tracks time, from left to right.
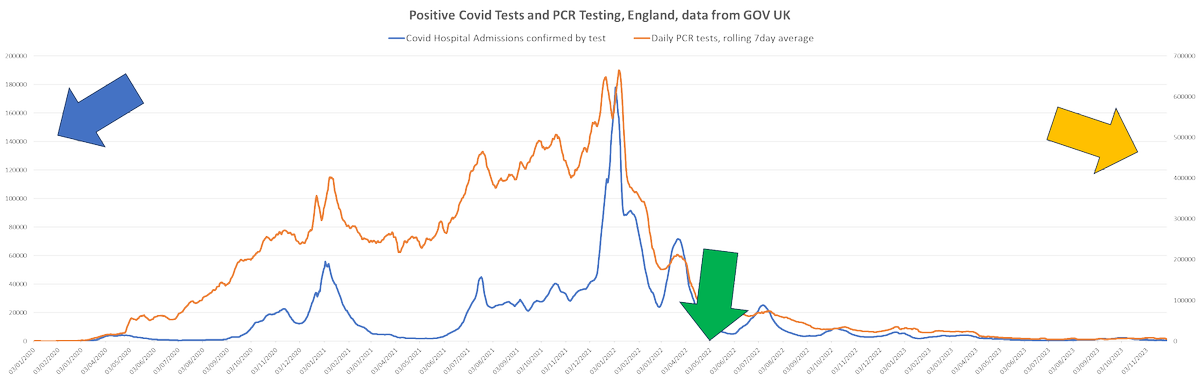
The lines are a 'rolling 7 day average', so the spreadsheet adds up the totals from each of the previous seven days, and averages them out, to smooth out the high peaks and troughs of individual days.
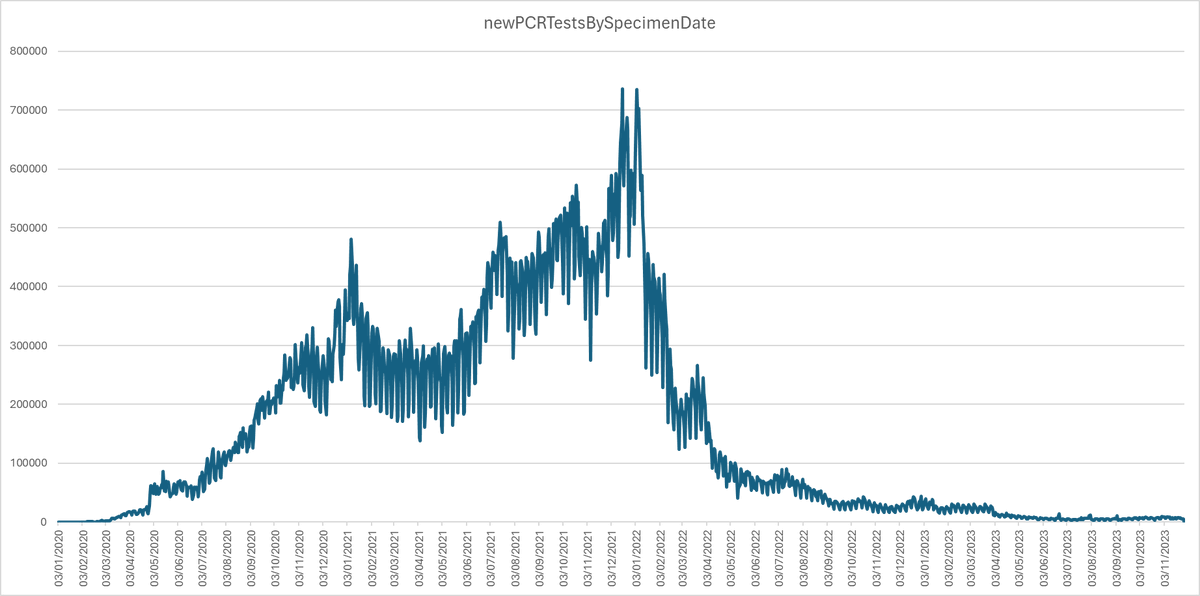
Here's what pcr tests looks like without the rolling average:
Here's what pcr tests looks like without the rolling average:
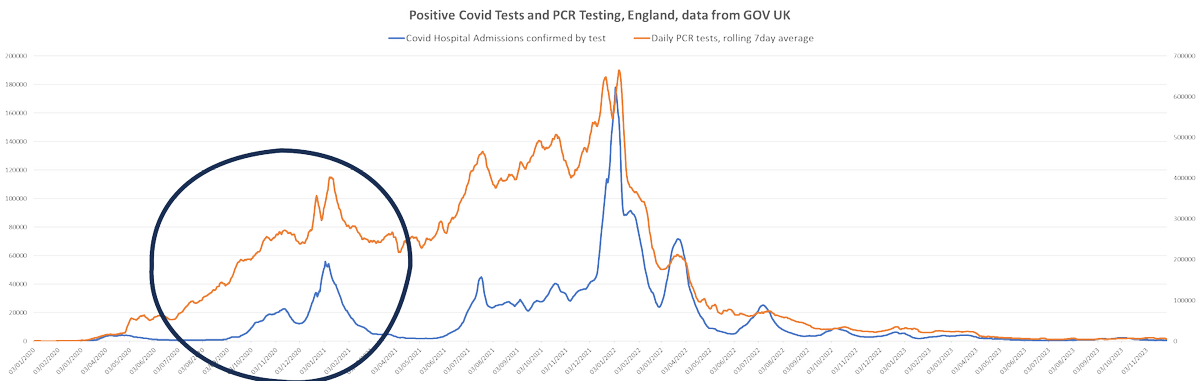
Let's just zoom in briefly on the early days:
The relationship back in the early days between the number of tests being done, and the number of positives being returned started pretty constant...

But when restrictions kicked in, cases dropped, and testing increased dramatically...
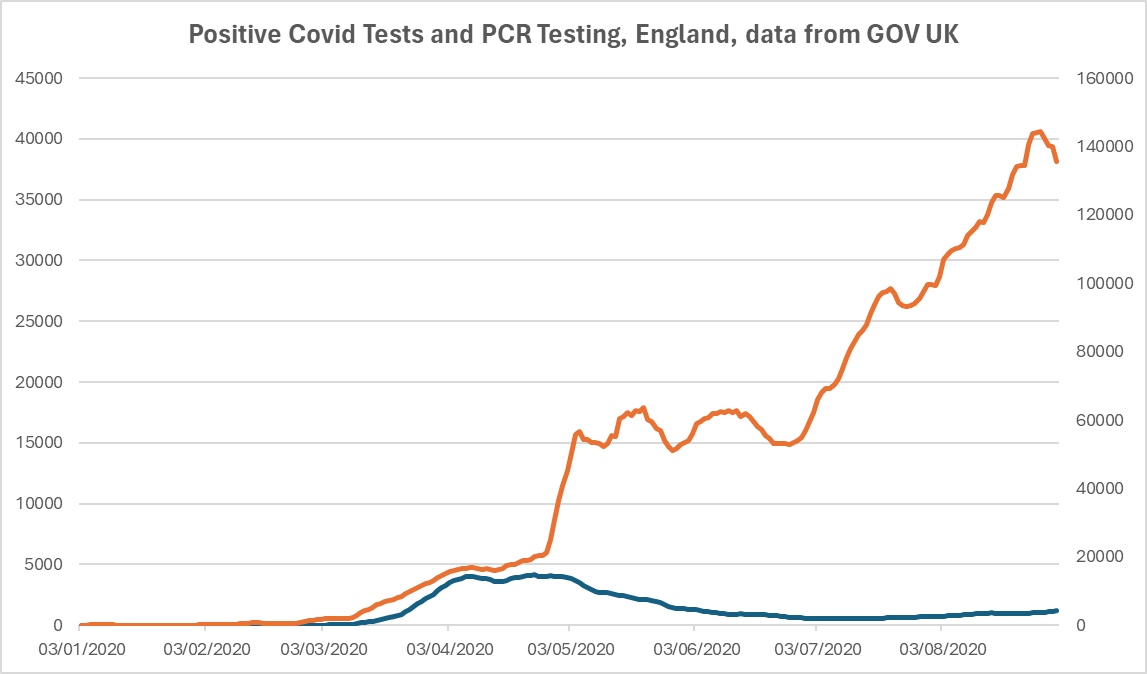
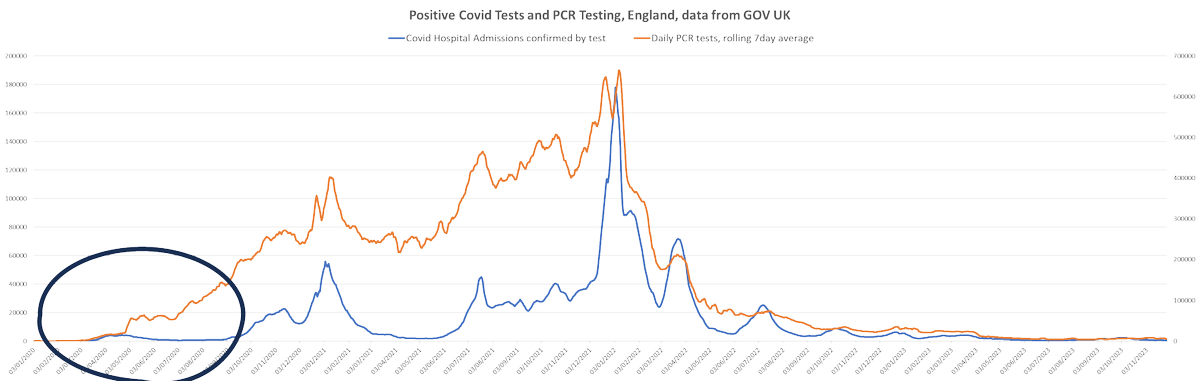
That previous graph runs up to the start of term in Autumn 2020.
Testing in orange, cases in blue.
That's when the rest of the kids went back to school, and covid went nuts...
Testing in orange, cases in blue.
That's when the rest of the kids went back to school, and covid went nuts...
So during the 2020/2021 winter, the pattern of testing and positives tracks very closely.
More tests, more positives, fewer tests, fewer positives.
More tests, more positives, fewer tests, fewer positives.

That relationship is chicken and egg.
If more people are sick, you test more, if the capacity is there.
But also if you improve capacity and test more people, you'll discover more positives.
But do you see how closely those patterns are linked?
If more people are sick, you test more, if the capacity is there.
But also if you improve capacity and test more people, you'll discover more positives.
But do you see how closely those patterns are linked?
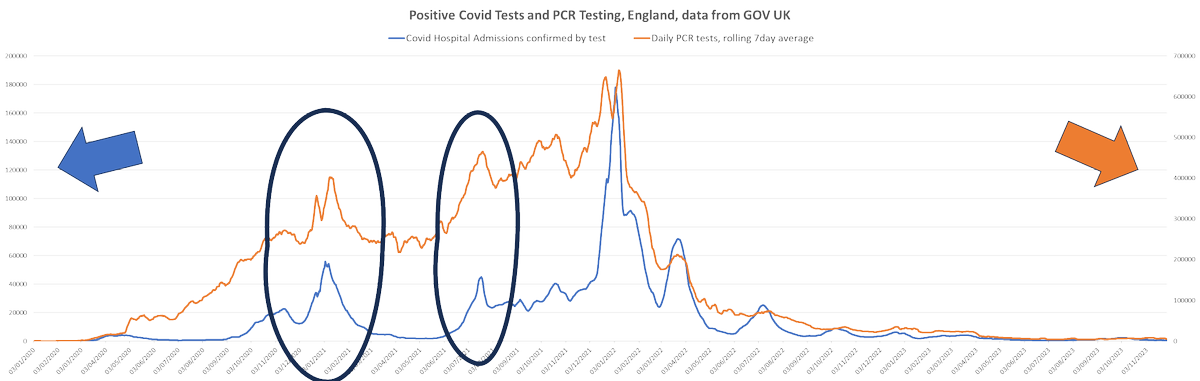
But there's also a difference in pick up of positives during different points.
Look at these two peaks and the trough in between.
Look at these two peaks and the trough in between.

At this point it's worth reminding that the scales on the two lines are different.
That's why we have two axes for the two sets of data.
That's why we have two axes for the two sets of data.
Without the different scales, the graph looks like this and is far harder to read:

But the relationship between the peaks of testing and positives are different at different points.
In January 21 you're getting about 12% of tests positive, and July 21 you're getting about 8% of tests positive.
In January 21 you're getting about 12% of tests positive, and July 21 you're getting about 8% of tests positive.

And then at New Year 2022, you're getting 25% of tests coming back positive, and a huge number of them.

But during that whole period, while you get ebbs and flows of cases and tests, the general rising tide is more and more tests and more and more confirmed cases until...
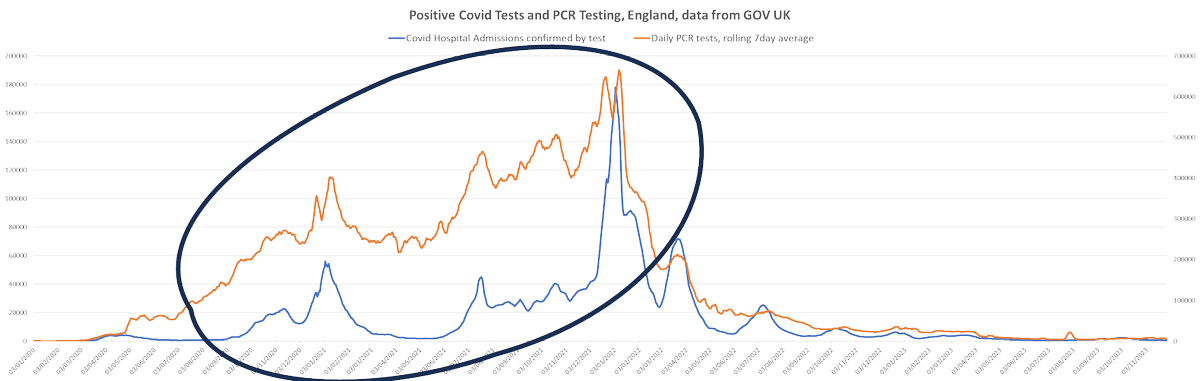
A change in approach.
From here on out there was a constant attempt to reduce testing and reduce coverage.
Minimisation was literally the policy from here on.
From here on out there was a constant attempt to reduce testing and reduce coverage.
Minimisation was literally the policy from here on.

And, yes, there's chicken and egg here.
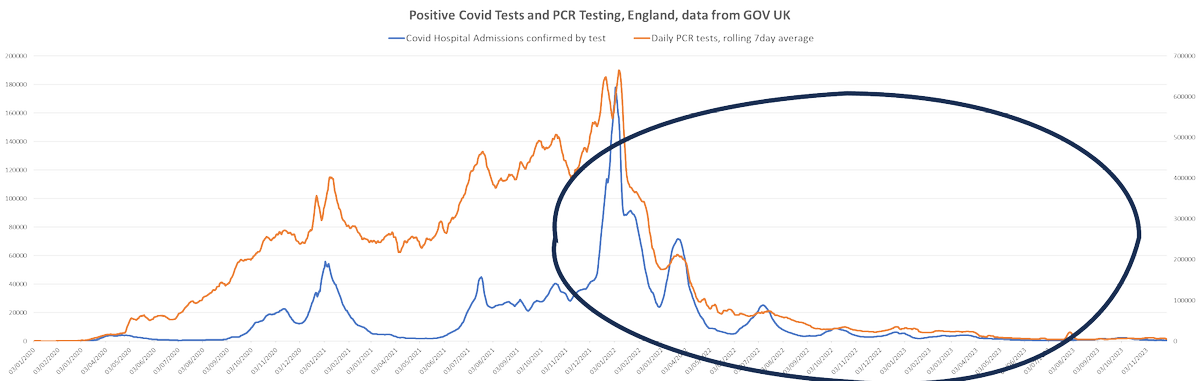
As that horrific wave finished, cases did drop.
But testing dropped harder.
See how testing exceeded the previous waves, but now cases exceed testing?
(again, bearing in mind that those scales are different)
As that horrific wave finished, cases did drop.
But testing dropped harder.
See how testing exceeded the previous waves, but now cases exceed testing?
(again, bearing in mind that those scales are different)

But now we hit the part of the pandemic that the minimisers love to point at. "look, it's over" they say, "because there aren't so many people testing positive".
But there's been a consistent restriction on testing from that point.
But there's been a consistent restriction on testing from that point.
As Trump put it, you don't test and it goes away.
I've just heard of yet another person admitted to hospital while sick with Covid (admitted for a heart attack while ill) and the hospital haven't tested them.
It's a deliberate policy.
It's a deliberate policy.
If you don't test, it goes away.
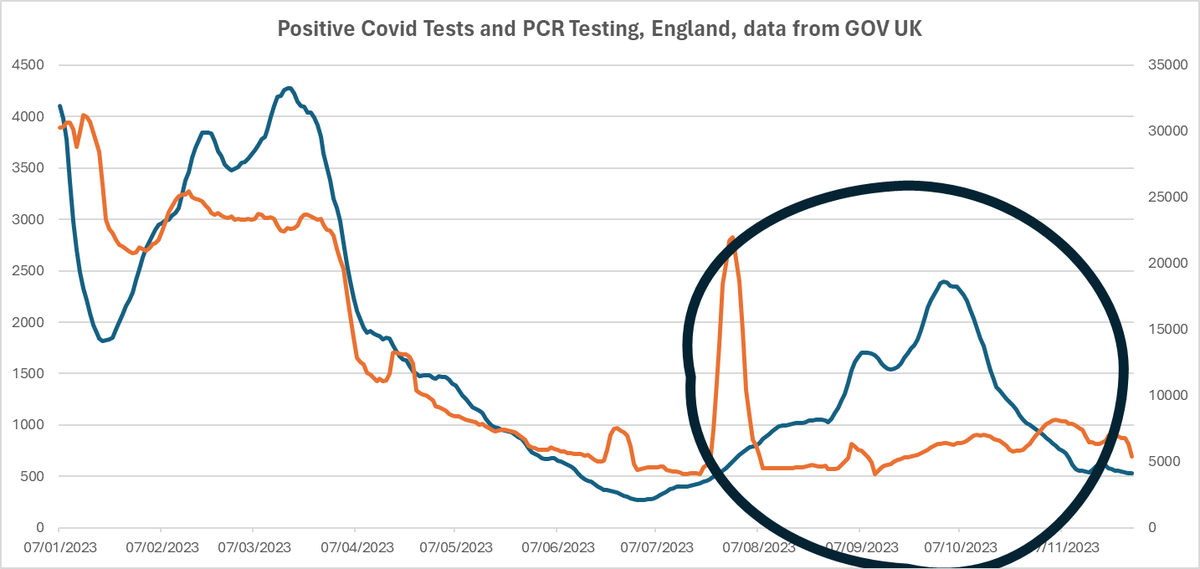
But it's still worth zooming in on this part to get a deeper understanding of what is going on.
But before we do, do you see how the nature of the relationship has changed?
Earlier the peaks tracked exactly. Chicken and Egg.
But later, do you see how the peaks of cases remain, and yet the testing line is less connected?
Earlier the peaks tracked exactly. Chicken and Egg.
But later, do you see how the peaks of cases remain, and yet the testing line is less connected?

That's because they reduced testing on admission and in response to any sudden illness, and they narrowed symptoms based testing to a very narrow definition...
And so the definition of both sets of lines is lost.

But as we hit April 2023 and progress further in to the year... do you see how testing does not respond or correlate in any way to the increase in positives?

Testing is not completely disconnected from illness, as I have seen repeatedly throughout this year as people have been admitted to hospital for problems caused by Covid.
Heart attacks, bronchitis, pneumonia, dizziness, dehydration, fever, weakness, falls, breakages from falls - all **during Covid infections** but none of them tested for Covid.

Honestly, I don't even know who they're doing these PCR tests on anymore.
So when you get a minimiser pointing to this information and saying that cases are low, they are lying to you.
When they say that admissions for Covid are low, they're lying to you.
Testing volume is low, and testing has been disconnected from illness and admission, that's all.
• • •
Missing some Tweet in this thread? You can try to
force a refresh