
PMC COVID-19 Tracker, Dec 4, 2023
The U.S. surge is worsening faster than anticipated.
Today:
🔹1.2 million daily infections
🔹1 in 38 infectious (2.6%)
In 4 weeks (New Year's Day):
🔹1.8 million daily infections
🔹1 in 26 infectious (3.9%)
1/

The U.S. surge is worsening faster than anticipated.
Today:
🔹1.2 million daily infections
🔹1 in 38 infectious (2.6%)
In 4 weeks (New Year's Day):
🔹1.8 million daily infections
🔹1 in 26 infectious (3.9%)
1/
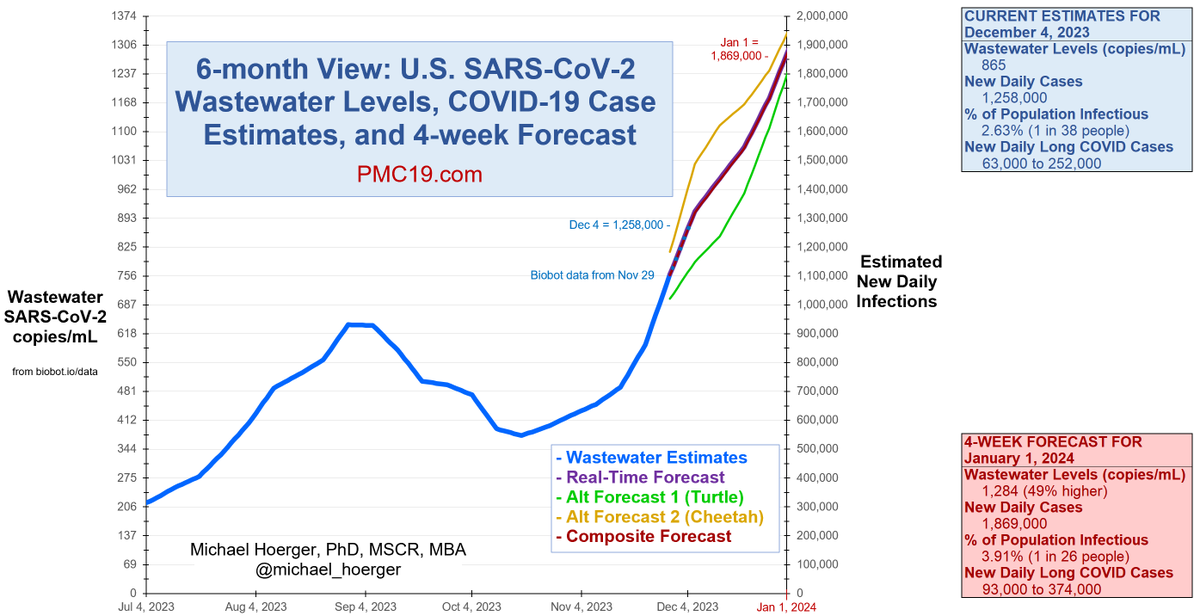
You'll note the diverging forecasts. Biobot #wastewater levels increased more than anticipated this week, and they updated last week's numbers upward too.
The cheetah forecast (yellow) assumes this week's levels will also get revised upward like last week's. The turtle model (green) ignores this week's data as an aberration. The real-time forecast (purple), which assumes all real-time estimates are accurate, is barely visible behind the red line. The red line is the composite average of all 3 forecasts.
You'll notice the blue line (wastewater levels) and red line (forecast) overlap marginally. Biobot reports levels for Nov 29, and we carry them forward in the forecasting model through Dec 4 (today). Transmission is accelerating so much, usually this 5 day lag isn't even visible graphically.
2/

This table shows how additional social contacts increase risk today (Dec 4).
🔥10 people (daycare, team meeting) = about a 1 in 4 chance someone has infectious COVID
🔥🔥30 people (large K-12 class) = over a 50% chance someone has infectious COVID
3/
🔥10 people (daycare, team meeting) = about a 1 in 4 chance someone has infectious COVID
🔥🔥30 people (large K-12 class) = over a 50% chance someone has infectious COVID
3/

This table shows how socializing on Christmas will drive the worst of the winter surge. Estimates are revised upward today (Dec 4).
⭐️Large fam gathering (20 people) = over a 50% chance someone's infectious
⭐️⭐️Large restaurant/flight = near-certain someone's infectious
4/
⭐️Large fam gathering (20 people) = over a 50% chance someone's infectious
⭐️⭐️Large restaurant/flight = near-certain someone's infectious
4/

This table shows the risk of socializing on New Year's Day. Finger crossed, the surge should peak around then.
Not a great time to party. 🎉🎉
5/
Not a great time to party. 🎉🎉
5/

Zooming out to the full pandemic shows the harm of the 8th U.S. Covid wave.
🔹More daily infections than 89% of the pandemic
🔹>25x more actual than reported cases
🔹>60,000 #LongCovid cases/day eventually resulting from these infections
🔹Winter peak like last year
6/
🔹More daily infections than 89% of the pandemic
🔹>25x more actual than reported cases
🔹>60,000 #LongCovid cases/day eventually resulting from these infections
🔹Winter peak like last year
6/

Here's the full PMC Dashboard for Dec 4 to Jan 1.
You can read the full report here:
Thank you for your continued questions, suggestions, gratitude, and sharing across other platforms. Please offer any success stories to encourage others.
7/ pmc19.com/data/
You can read the full report here:
Thank you for your continued questions, suggestions, gratitude, and sharing across other platforms. Please offer any success stories to encourage others.
7/ pmc19.com/data/

• • •
Missing some Tweet in this thread? You can try to
force a refresh


