In this THREAD I will explain LIQUIDITY:
1. What is Liquidity?
2. Sell-side Liquidity
3. Buy-side Liquidity
4. Internal & External Liquidity
🧵(1/6)
1. What is Liquidity?
2. Sell-side Liquidity
3. Buy-side Liquidity
4. Internal & External Liquidity
🧵(1/6)

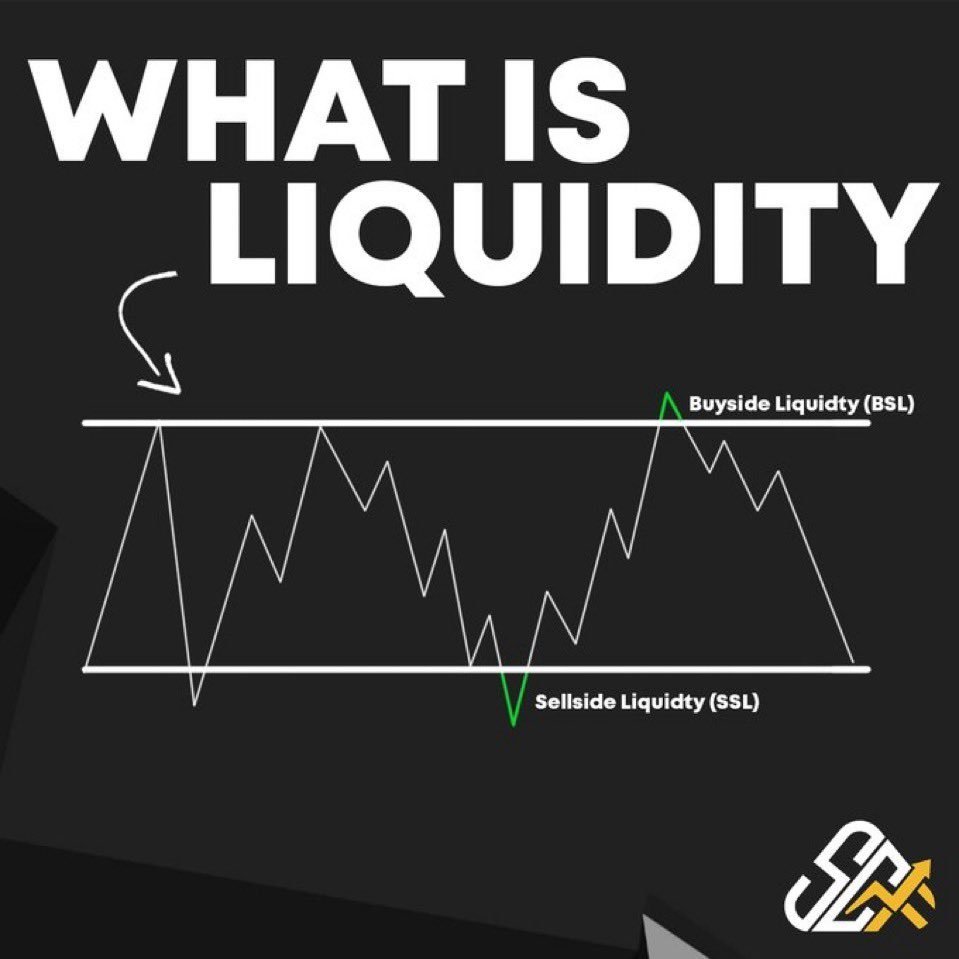
1. What is Liquidity?
- Liquidity is basically sum of all orders at a specific price
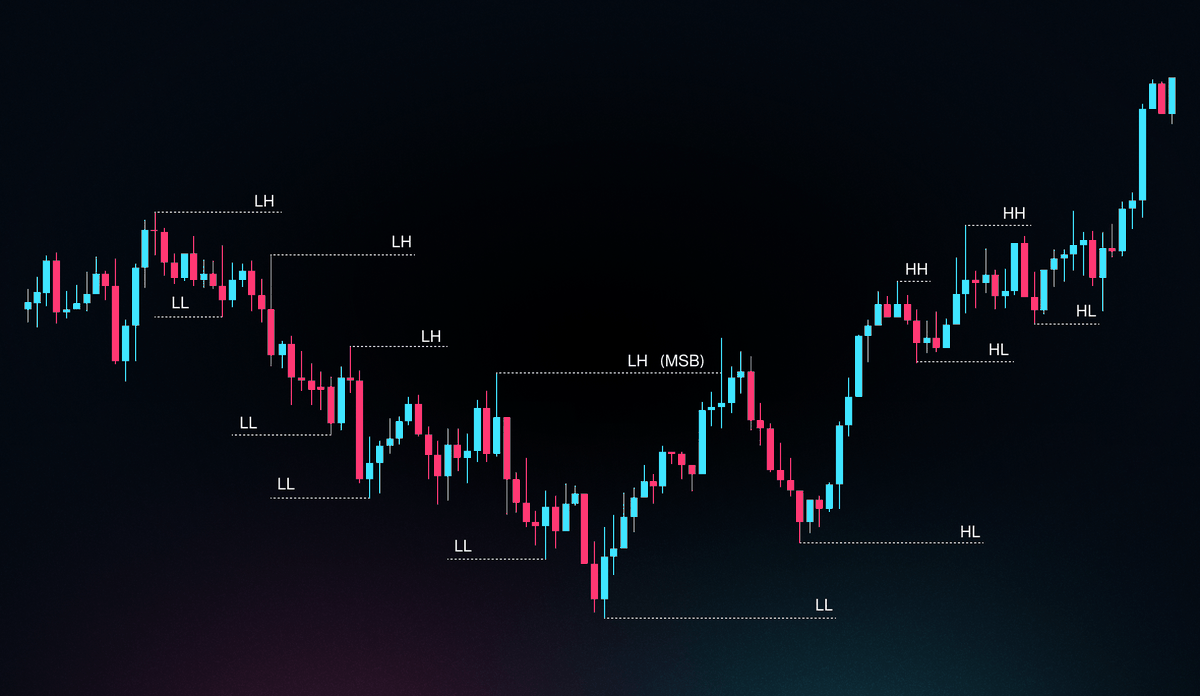
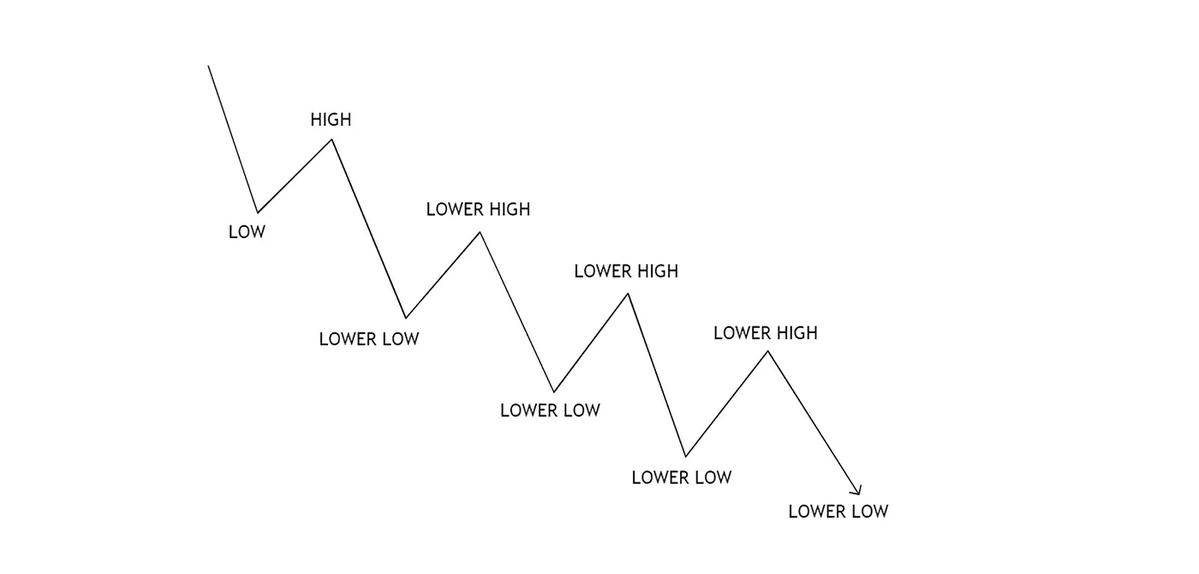
- Liquidity is present at every high and low. Since, is where traders place buy, sell and stop orders
- Liquidity is used by smart money to fill gaps on the market
- Liquidity is basically sum of all orders at a specific price
- Liquidity is present at every high and low. Since, is where traders place buy, sell and stop orders
- Liquidity is used by smart money to fill gaps on the market

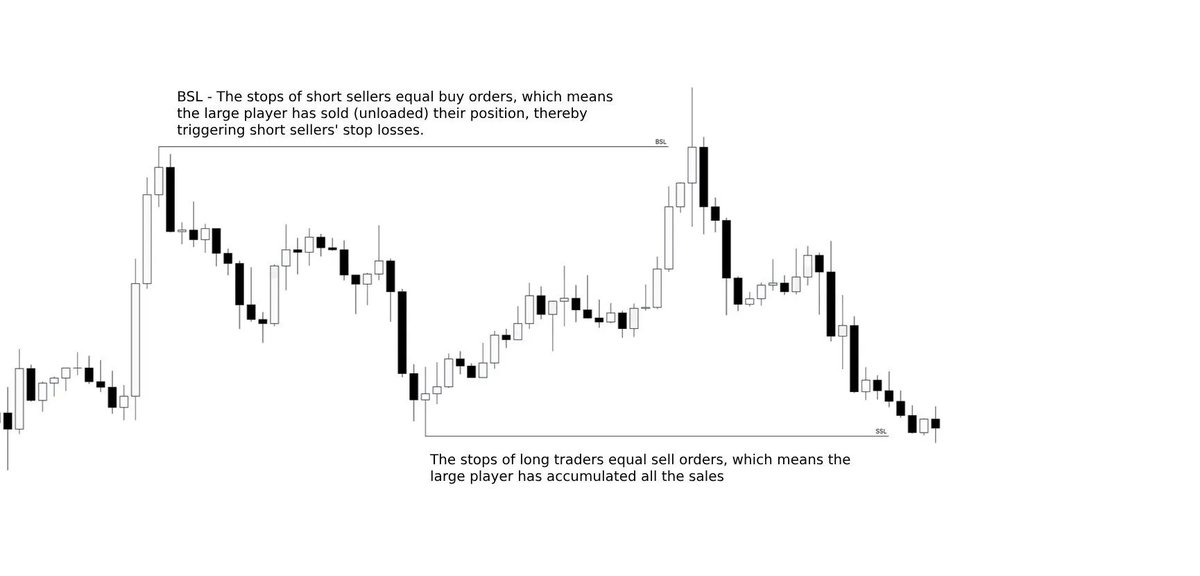
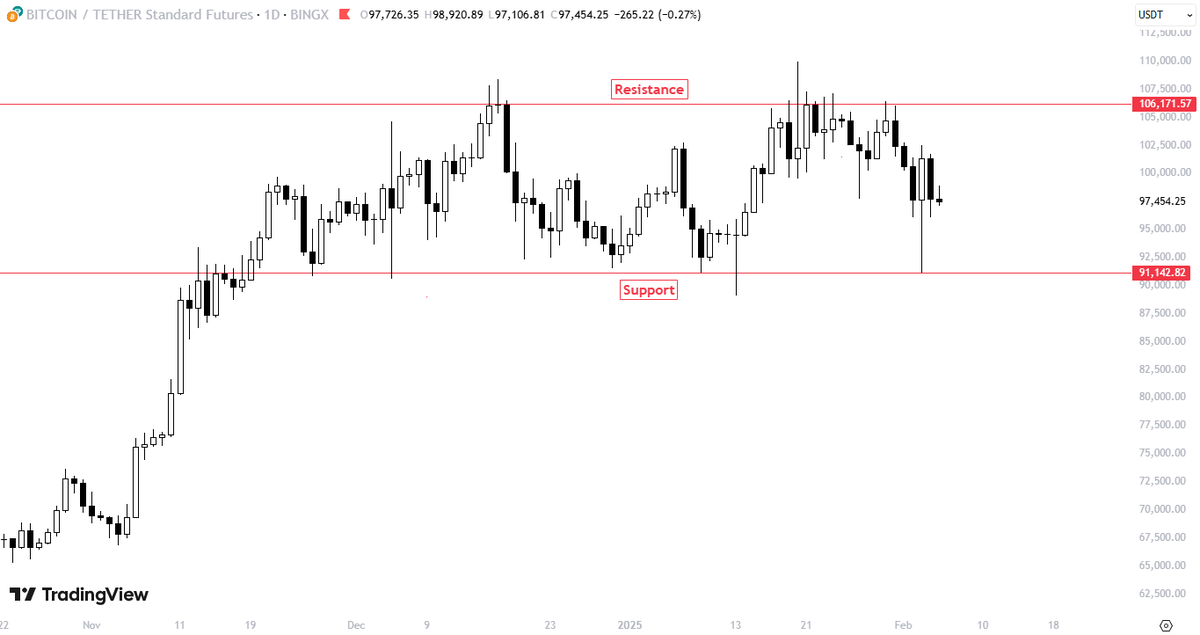
2. Buy-side Liquidity:
- Liquidity generated when SL are taken out.
Areas where Buy-side liquidity rests:
• PWH, PDH, Equal Highs, Above HTF resistance…
- Liquidity generated when SL are taken out.
Areas where Buy-side liquidity rests:
• PWH, PDH, Equal Highs, Above HTF resistance…


3. Sell-side Liquidity:
- Is the liquidity generated when buy-stops are triggered below support.
Areas where Buy-side liquidity rests:
• PWL, PDL, Equal lows, Below HTF Support…
- Is the liquidity generated when buy-stops are triggered below support.
Areas where Buy-side liquidity rests:
• PWL, PDL, Equal lows, Below HTF Support…


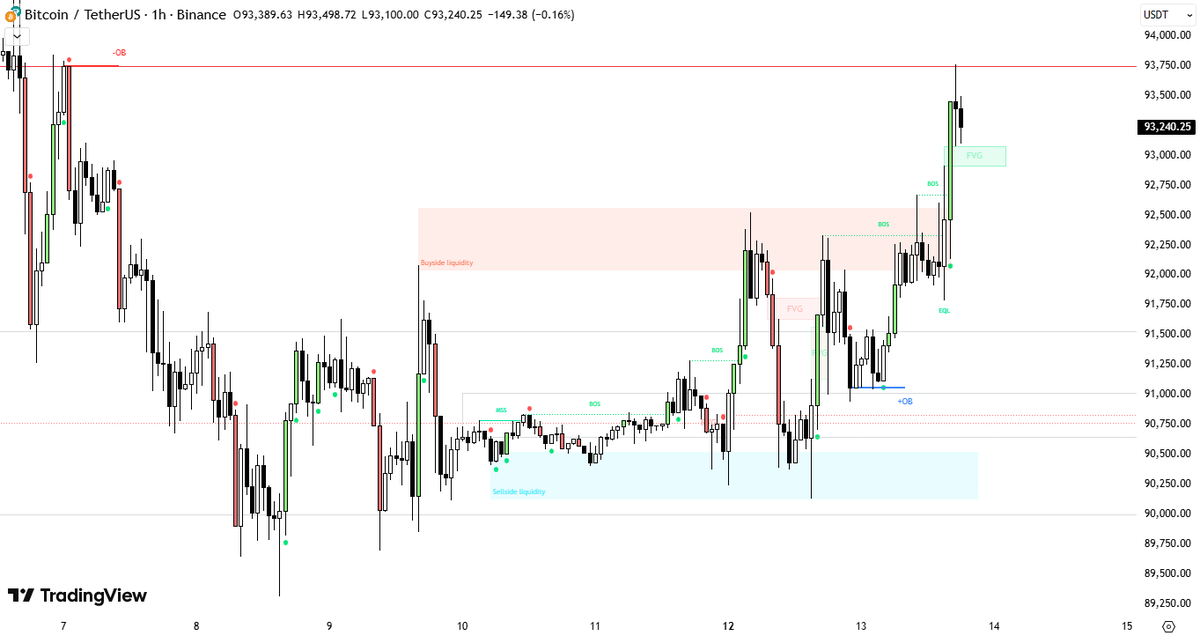
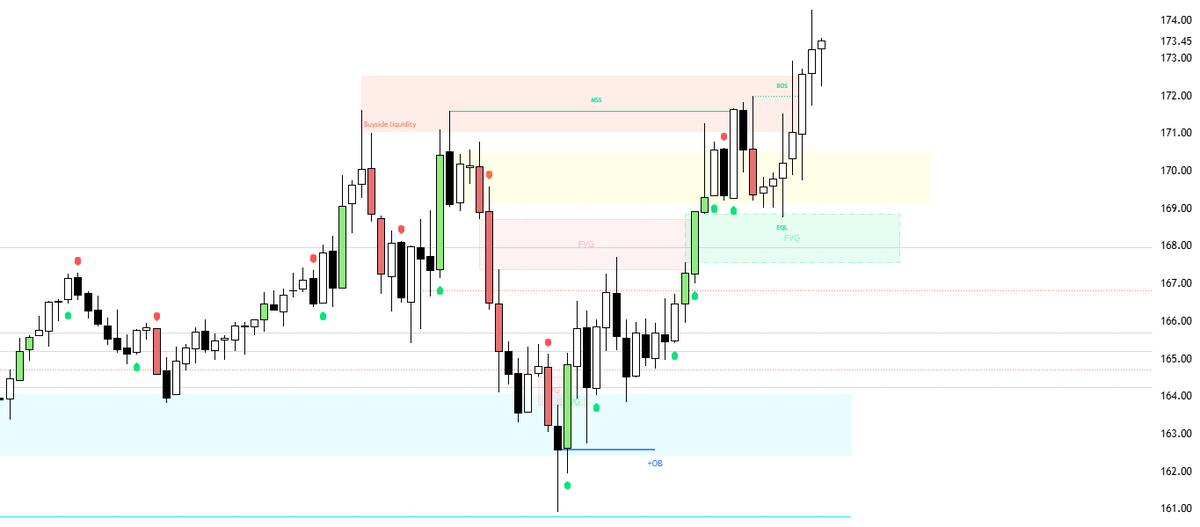
4. Internal & External Liquidity:
- Internal Liquidity: Is the liquidity inside the define range
- External Liquidity: Buy-side liquidity above the range high and sell-liquidity below the range low.
- Market moves essentially between Internal and External Liquidity.
- Internal Liquidity: Is the liquidity inside the define range
- External Liquidity: Buy-side liquidity above the range high and sell-liquidity below the range low.
- Market moves essentially between Internal and External Liquidity.

I hope this THREAD has helped you to understand the extense concept of LIQUIDITY.
It's a needed knowledge you must have.
This has been the SECOND THREAD I made about Liquidity.
RT and FAV to spread this THREAD is appreciated
It's a needed knowledge you must have.
This has been the SECOND THREAD I made about Liquidity.
RT and FAV to spread this THREAD is appreciated
• • •
Missing some Tweet in this thread? You can try to
force a refresh