 Read on Twitter
The most positive thing from the employment report was the decline in the unemployment rate from 3.9% to 3.7%.
This decline lowered the Sahm Rule from 0.33 to 0.30.
1/
This decline lowered the Sahm Rule from 0.33 to 0.30.
1/

This fractional decline led to a spiking of the football for the soft landing camp which is curious given the history of the Sahm Rule.
As covered below, we know the Sahm Rule is not a leading indicator.
2/
As covered below, we know the Sahm Rule is not a leading indicator.
2/
https://x.com/EPBResearch/status/1732419936847597983?s=20
For example, the Real-Time Sahm Rule declined to 0.03 two months prior to the 1991 recession.
3/
3/
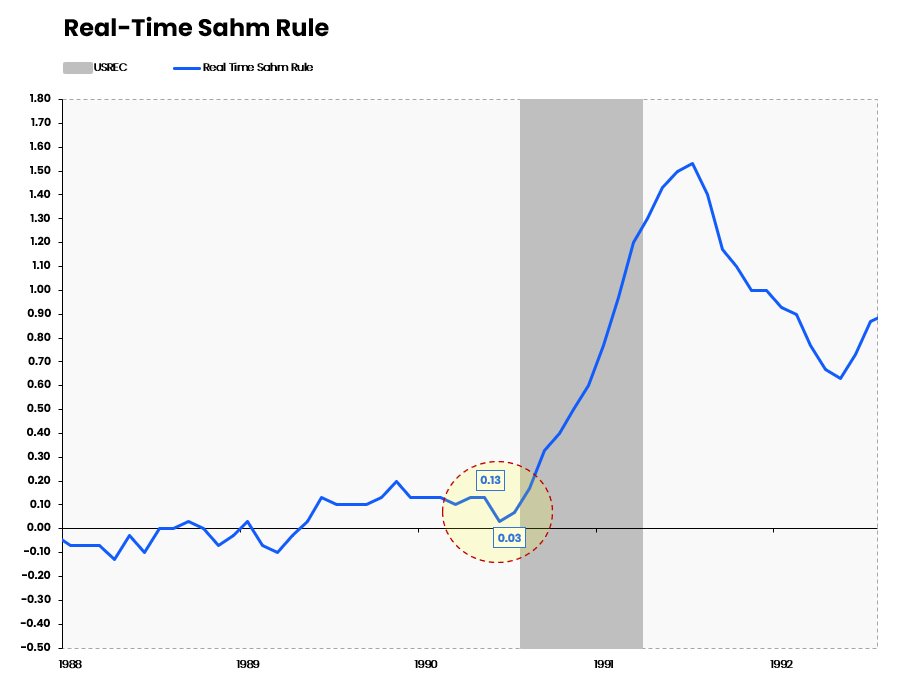
The Real-Time Sahm Rule is triggered an average of 2-3 months inside the recession with a level of 0.19 at the average recession start.
4/
4/
https://x.com/EPBResearch/status/1732419954501394582?s=20
Of course, any directional improvement is good news and should be treated as such.
But 0.3 is still an uncomfortable level and higher than the start of the average recession.
5/
But 0.3 is still an uncomfortable level and higher than the start of the average recession.
5/
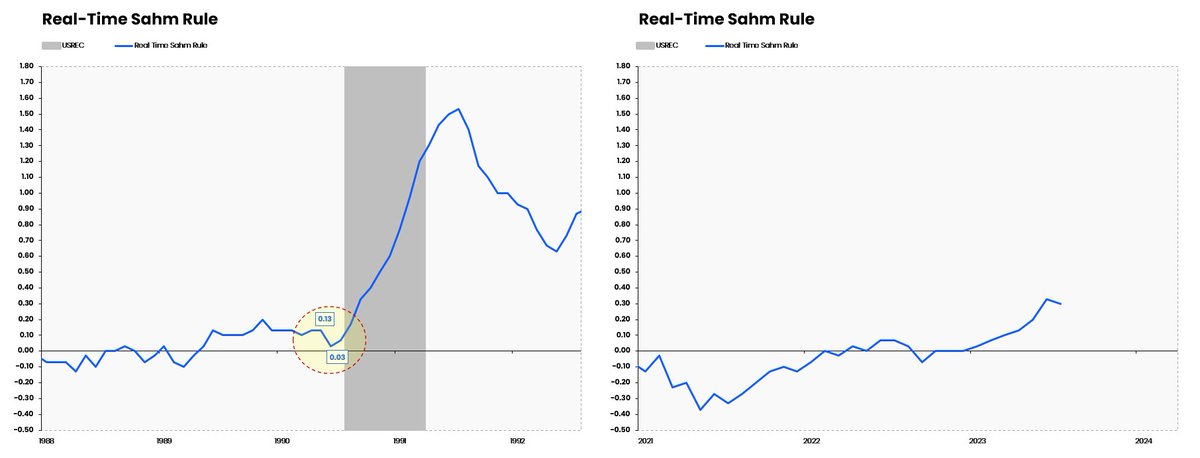
Importantly, labor market breadth is still deteriorating and at levels that are not exactly consistent with business cycle expansions, or even non-recessionary slowdowns.
6/
6/

So the Sahm Rule doesn't give any indication regarding where the labor market is heading.
It's a good rule, but it's a Coincident Indicator at best and more accurately a touch lagging, but this is by design and not necessarily a flaw.
7/
It's a good rule, but it's a Coincident Indicator at best and more accurately a touch lagging, but this is by design and not necessarily a flaw.
7/
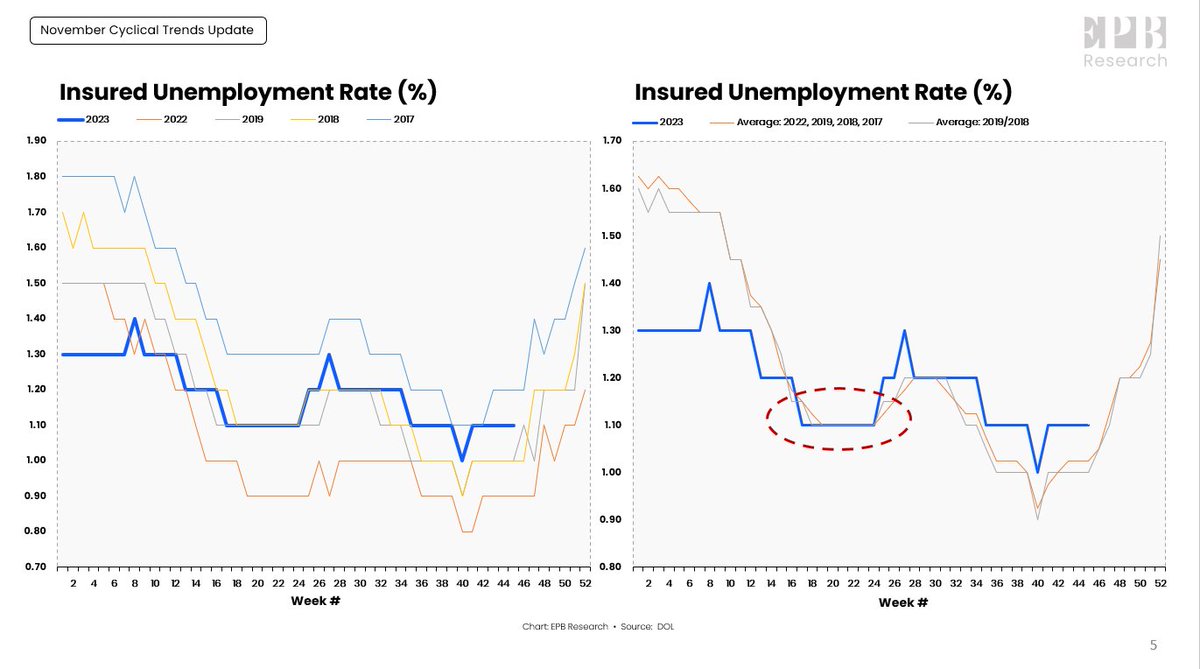
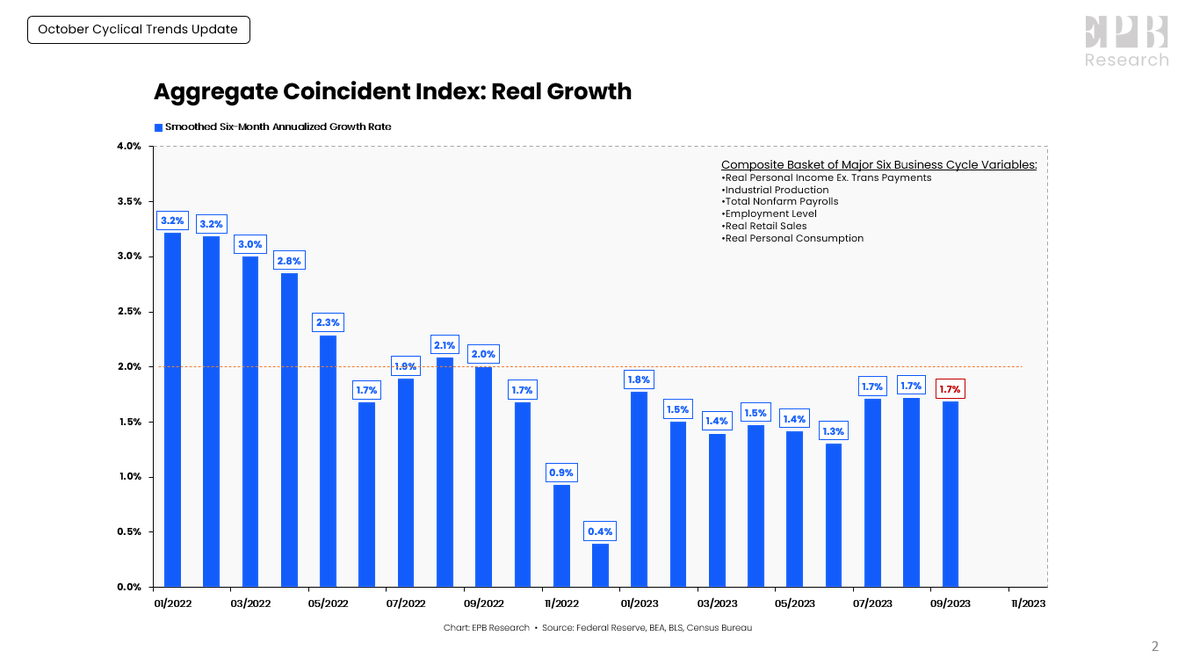
The future direction of the labor market should be judged by Leading Indicators of employment.
I covered six leading indicators of employment in my Weekly Update Video.
Good or bad, post your favorite leading indicator of employment below 👇
8/8
I covered six leading indicators of employment in my Weekly Update Video.
Good or bad, post your favorite leading indicator of employment below 👇
8/8
• • •
Missing some Tweet in this thread? You can try to
force a refresh