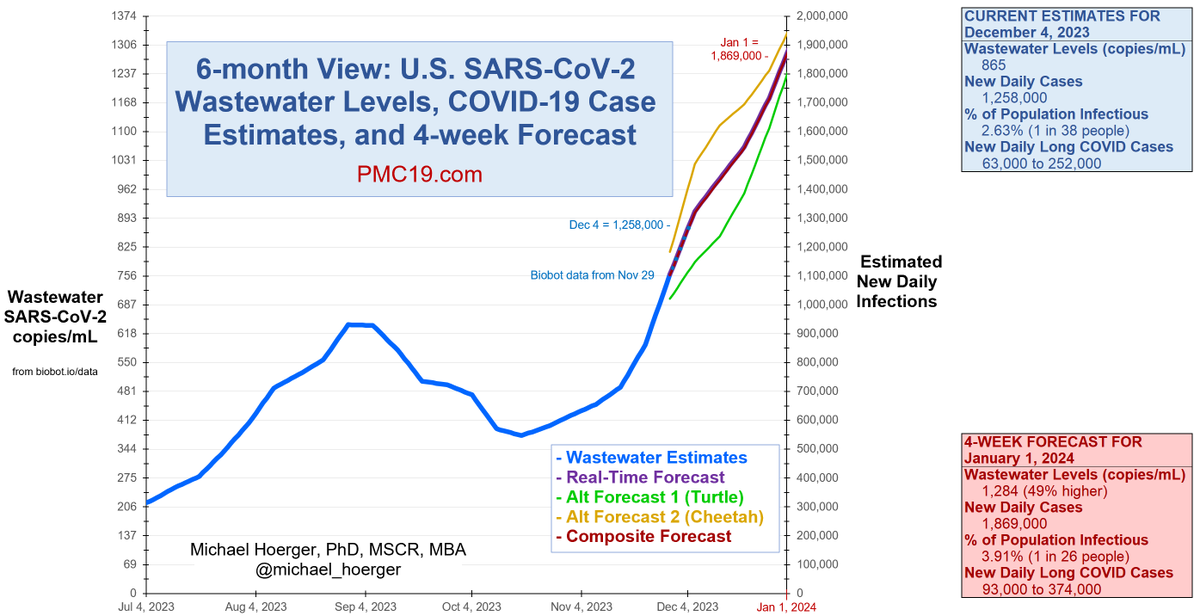
There's a lot of dichotomous thinking about #COVID risk on #airplanes.
Some believe it's completely safe, others completable dangerous.
I minimize flight travel and wouldn't fly without a fit-tested high-quality mask (N95 or elastomeric respirator). Here's why. 🧵
1/16
Some believe it's completely safe, others completable dangerous.
I minimize flight travel and wouldn't fly without a fit-tested high-quality mask (N95 or elastomeric respirator). Here's why. 🧵
1/16

Field research from @sri_srikrishna found that across 3 models of aircrafts, they had an air cleaning rate of 10.9-11.8 air changes per hour (ACH).
A U.S. operating room should have 15 ACH, so flights are pretty good, right?
Wrong. I'll explain why.
2/16
A U.S. operating room should have 15 ACH, so flights are pretty good, right?
Wrong. I'll explain why.
2/16

10-12 air changes per hour (ACH) on a flight sounds good, even overkill, right?
Actually, no.
If the air has good mixing, the best case scenario is that each air change is still imperfectly efficient, cleaning out about 2/3 of the air each air change.
Uh oh.
3/16
Actually, no.
If the air has good mixing, the best case scenario is that each air change is still imperfectly efficient, cleaning out about 2/3 of the air each air change.
Uh oh.
3/16
The imperfect efficiency means that the air cleaning must exceed the rate at which the air is being contaminated with airborne infectious virus laden aerosol particles.
The air cleaners must work faster than the people breathing into the air, or virus can accumulate.
4/16
The air cleaners must work faster than the people breathing into the air, or virus can accumulate.
4/16
This is a question of the density of the people in the room. If the room has hardly anyone in it, a low air cleaning rate can prevent virus from accumulating in the air. If the room has many people in it, a high air cleaning rate is needed to prevent viral accumulation.
5/16
5/16
Accordingly, the 2023 ASHRAE standards indicate per-person air cleaning rates, rather than the number of times a room's air should be cleaned per hour.
This is where the risk of airplanes is revealed.
6/16
This is where the risk of airplanes is revealed.
6/16

ASHRAE only deals with "buildings," not planes (confirmed by phone). As consumers, we can draw approximate inferences by examining their standards for similar "rooms."
A lecture hall/auditorium should clean the air at a rate of 50 cubic ft per minute (cfm) per person.
7/16
A lecture hall/auditorium should clean the air at a rate of 50 cubic ft per minute (cfm) per person.
7/16

If we consider the typical density of people in such settings, 50 cfm/person in a lecture hall is equivalent to about 50 ACH (it's a coincidence both are "50").
8/16
8/16
https://twitter.com/michael_hoerger/status/1686469138942734336
If 50 ACH is the minimum standard for air cleaning in a lecture hall & airplanes are similar to lecture halls in terms of seating and density, then airplanes may be cleaning the air at <25% of the standard we would expect.
That means virus accumulating in the air.
9/16
That means virus accumulating in the air.
9/16
Alternatively, if we assume 11.7 ACH on a plane, that the cabin volume is 6,978 cubic ft, and there are 100 people on the plane, then it would clean at 1,361 total cfm.
It should clean at 5,000 cfm.
That's about 25% of the minimum expected rate. Virus accumulation.
10/16
It should clean at 5,000 cfm.
That's about 25% of the minimum expected rate. Virus accumulation.
10/16

We are all often in rooms with poor air cleaning rates. However, the risk increases as fewer people are masked, duration increases, and the number of infectious people increases.
Masking is low, flights can be long, and we're entering a U.S. surge.
11/16
Masking is low, flights can be long, and we're entering a U.S. surge.
11/16
Moreover, the ASHRAE standards focus on far field transmission (preventing viral accumulation in the "room") not on those in near proximity.
Good air cleaning can somewhat reduce risk from those nearby, not completely, but poorer air cleaning increases that risk too.
12/16
Good air cleaning can somewhat reduce risk from those nearby, not completely, but poorer air cleaning increases that risk too.
12/16
So, (A) avoid flight travel, or (B) wear a fit-tested high-quality mask throughout.
13/16
13/16
These are my recommendations for high-quality N95 masks that fit most people. I have worn an elastomeric (reusable) mask called a @flo_mask on flights (profile picture). No COIs.
14/16
14/16
https://twitter.com/michael_hoerger/status/1645531268099215366
Fit-testing can help you select the best N95 for YOUR face and ensure that you're adjusting your mask to prevent gaps and get the best fit possible.
On a long flight, a mask gap could mean the difference between getting COVID or not.
15/16
On a long flight, a mask gap could mean the difference between getting COVID or not.
15/16
https://twitter.com/michael_hoerger/status/1604020083189219330
Thank you. Please ask any questions or share personal examples. If you found the thread helpful, please share the first Tweet.
Please also share across other platforms. 🙏
16/16
Please also share across other platforms. 🙏
16/16
• • •
Missing some Tweet in this thread? You can try to
force a refresh

 Read on Twitter


