PMC COVID-19 Tracker, Dec 11, 2023
The surge continues.
Today:
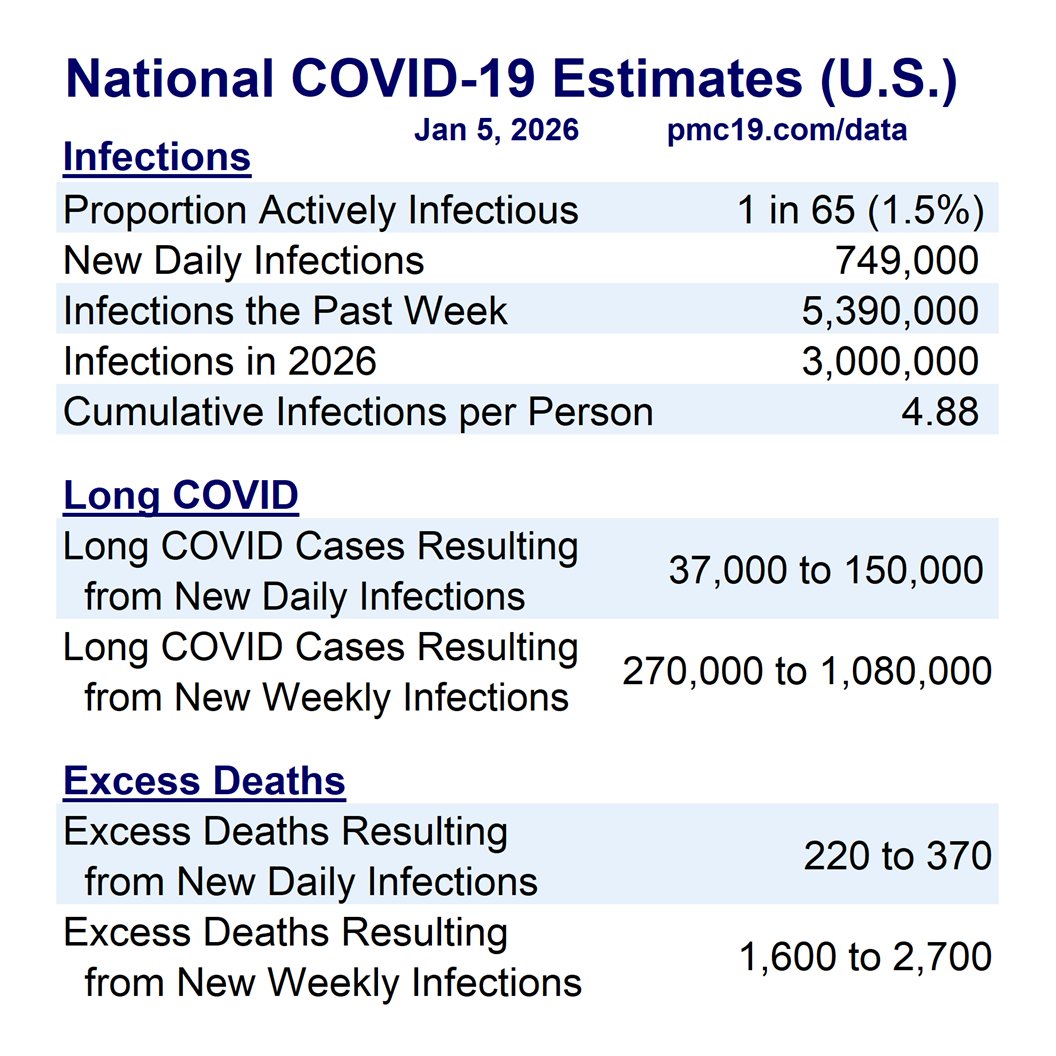
🔹1.2 million daily infections
🔹1 in 41 infectious (2.5%)
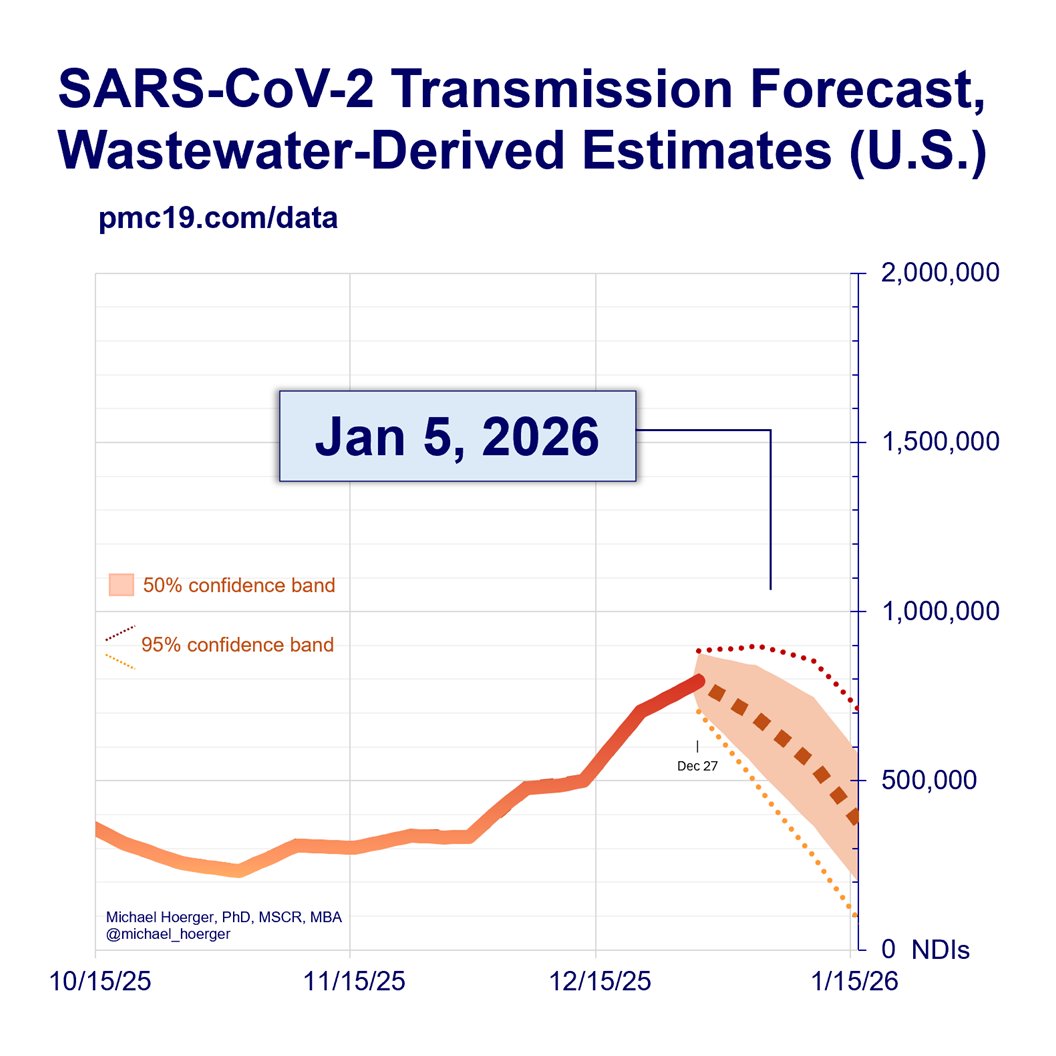
In 4 weeks (Jan 8):
🔹1.6 million daily infections
🔹1 in 30 infectious (3.3%)
1/
A few key methodologic updates.
1) Biobot correct levels downward for the past two weeks, so you might notice that this week's estimates seem similar to last week's or marginally lower.
2) Our forecasting model uses a combination of historic data (situation past several years) and current data (past 4 weeks). In the historic model, we switched from using mean-type data to median-type data. This avoids overestimating levels based on the BA.1 surge and allows us to predict accurately a little faster, rather than predicting high and waiting for the current 4-week's data to correct it.
3) The forecasts depend a lot on the most recent week's data. To the extent Biobot is accurate or inaccurate in real-time, this leads to divergent forecasts.

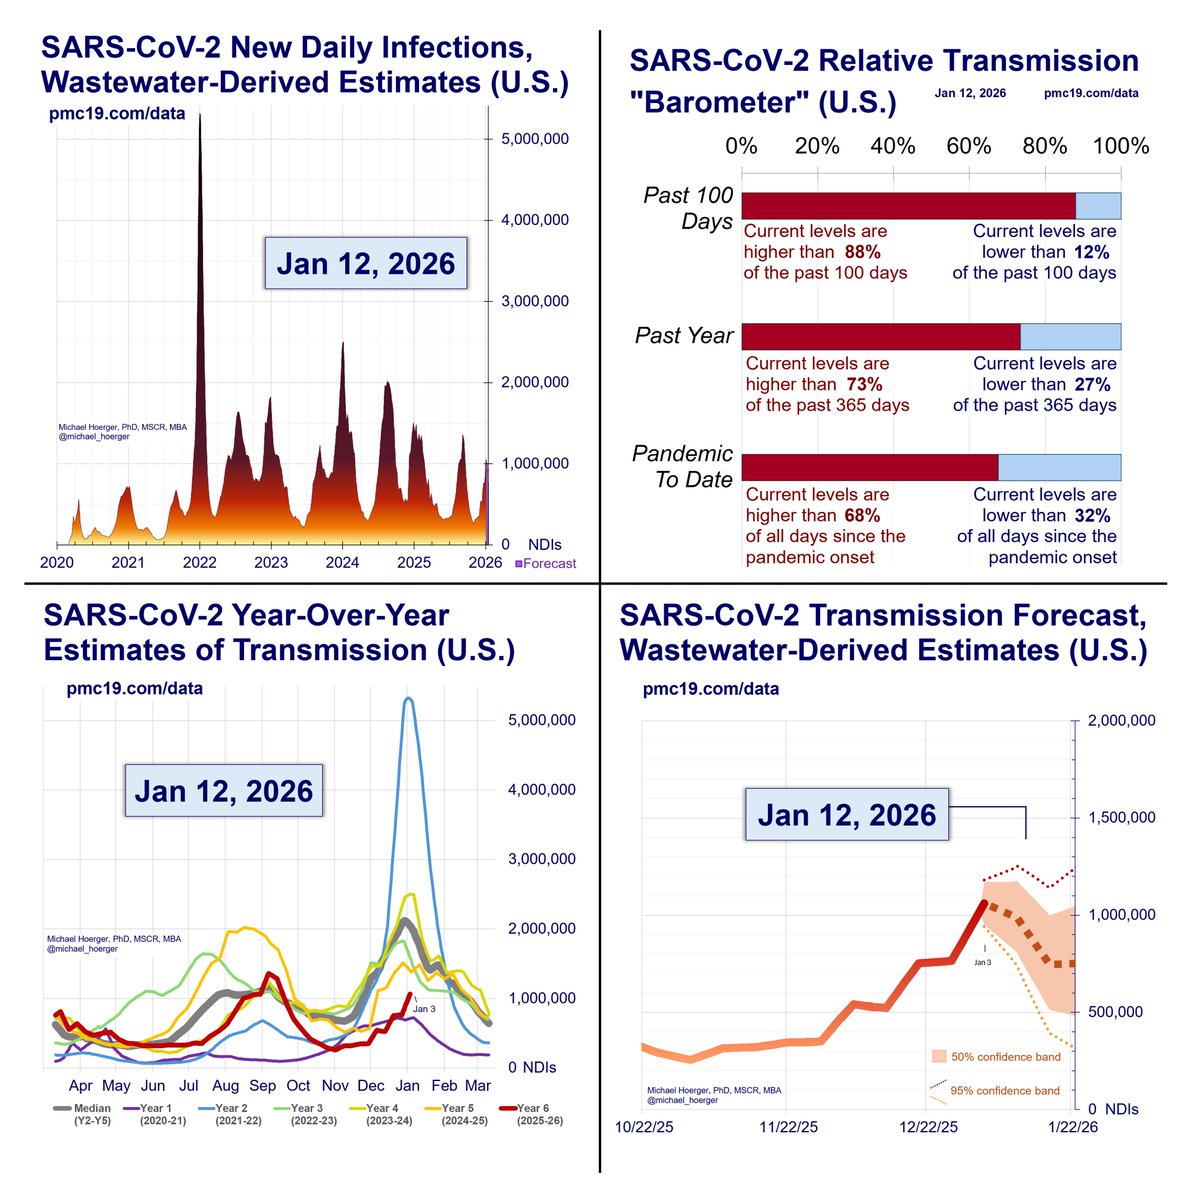
You'll see the forecasts differ considerably (1.3 to 1.9 million daily infections) in 4 weeks.
2/
However, they mostly agree on the peak. It could be as early as Jan 1 or as late as Jan 15. It's a moot point. Transmission will be similar across that timespan and the weekly reports lack the precision to say whether it will peak on the 4th or 9th, for example. Early Jan will remain bad.
Details:
The real-time model (purple) anticipates the highest surge levels. This assumes that Biobot real-time reports are accurate, but they were substantially corrected for the past two weeks, and there were some issues with real-time accuracy during the summer wave. The turtle model (green) discount’s the most recent week’s data as an aberration, assumes transmission should be corrected upward a little, and predicts a steady rise with peak around January 1. The cheetah model (yellow) says that because last week’s data were corrected downward, this week’s estimate should be too, so it’s much more conservative on the next several weeks. The average of all models (red) guides forecasted numbers for the next four weeks. A month from now, we will see about 1.6 million new U.S. cases per day (range of 1.3 to 1.9 million across forecasting models), with 3.3% of the U.S. population or 1 in 30 people actively infectious.

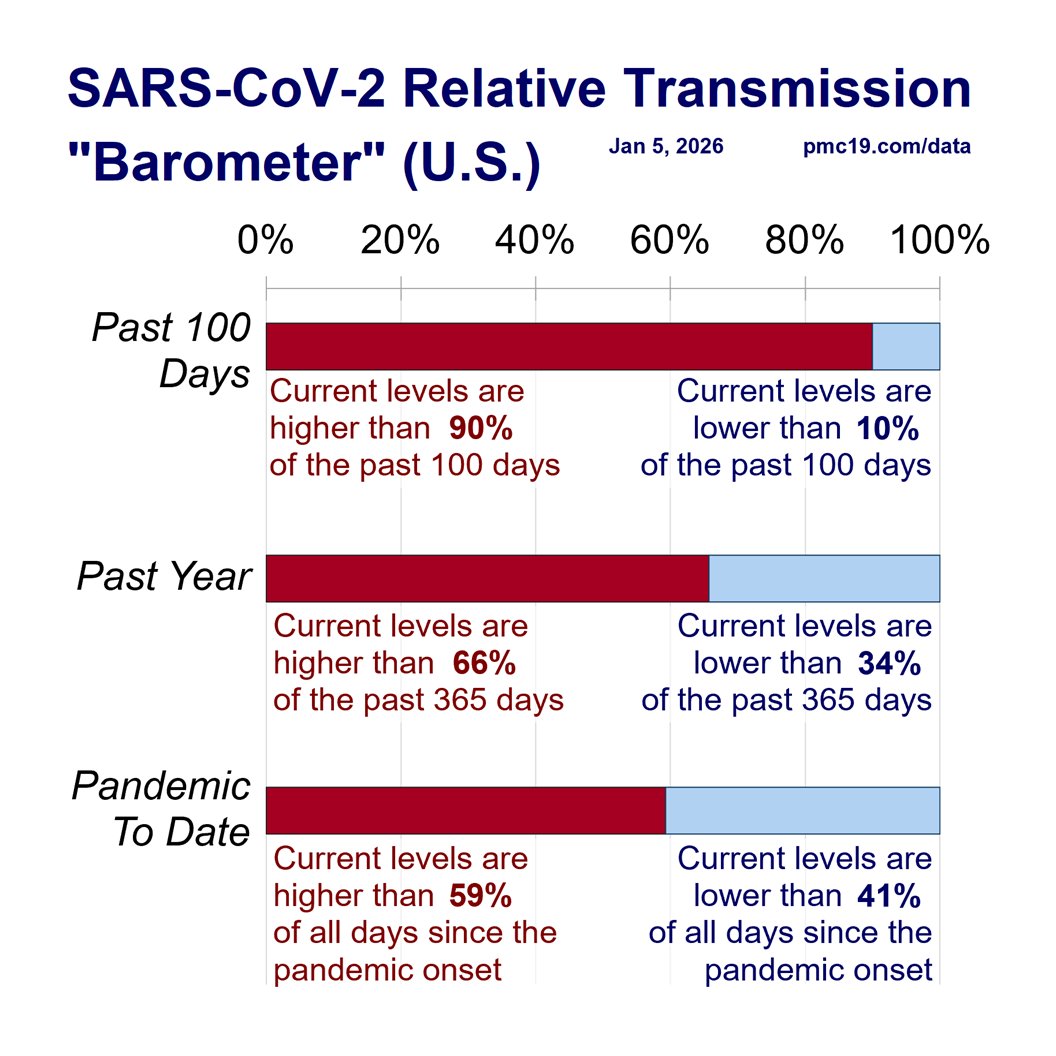
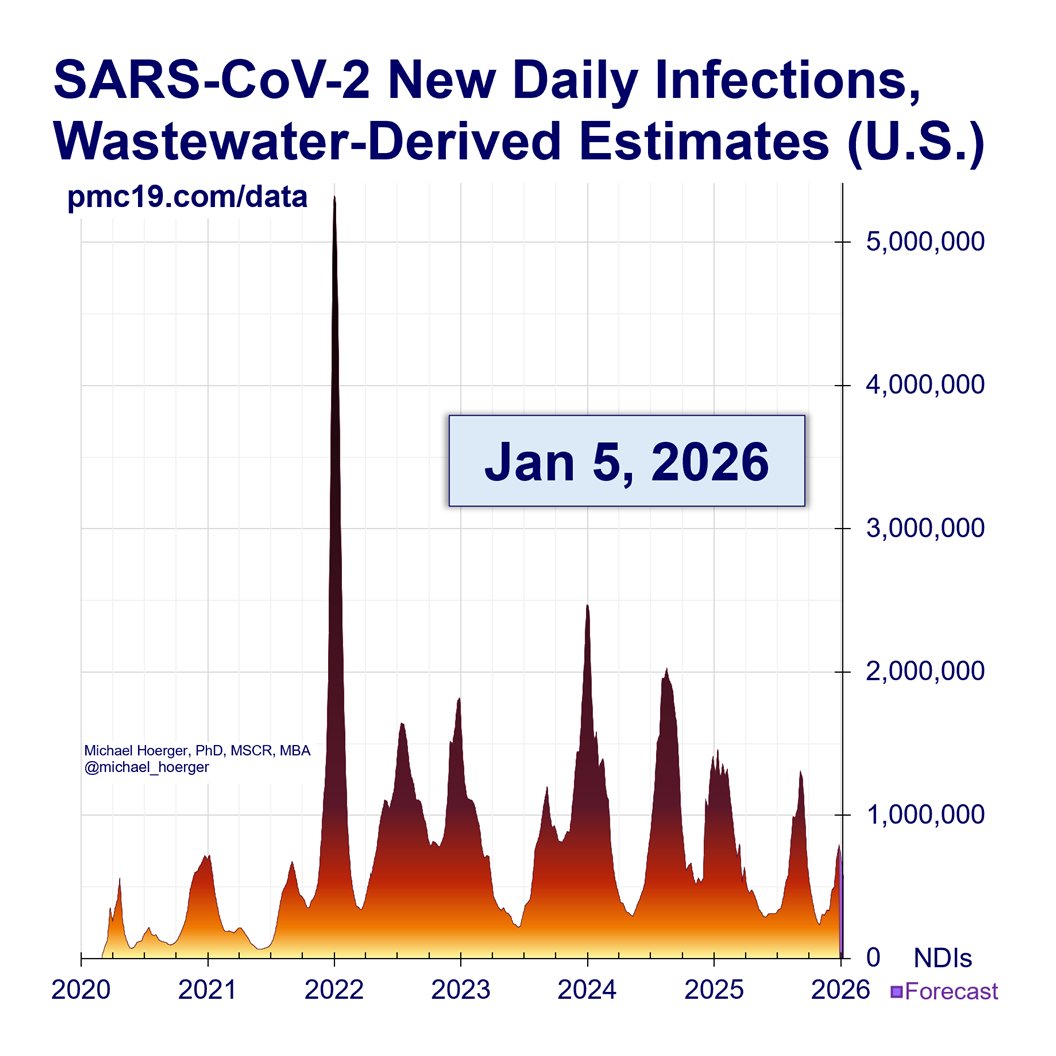
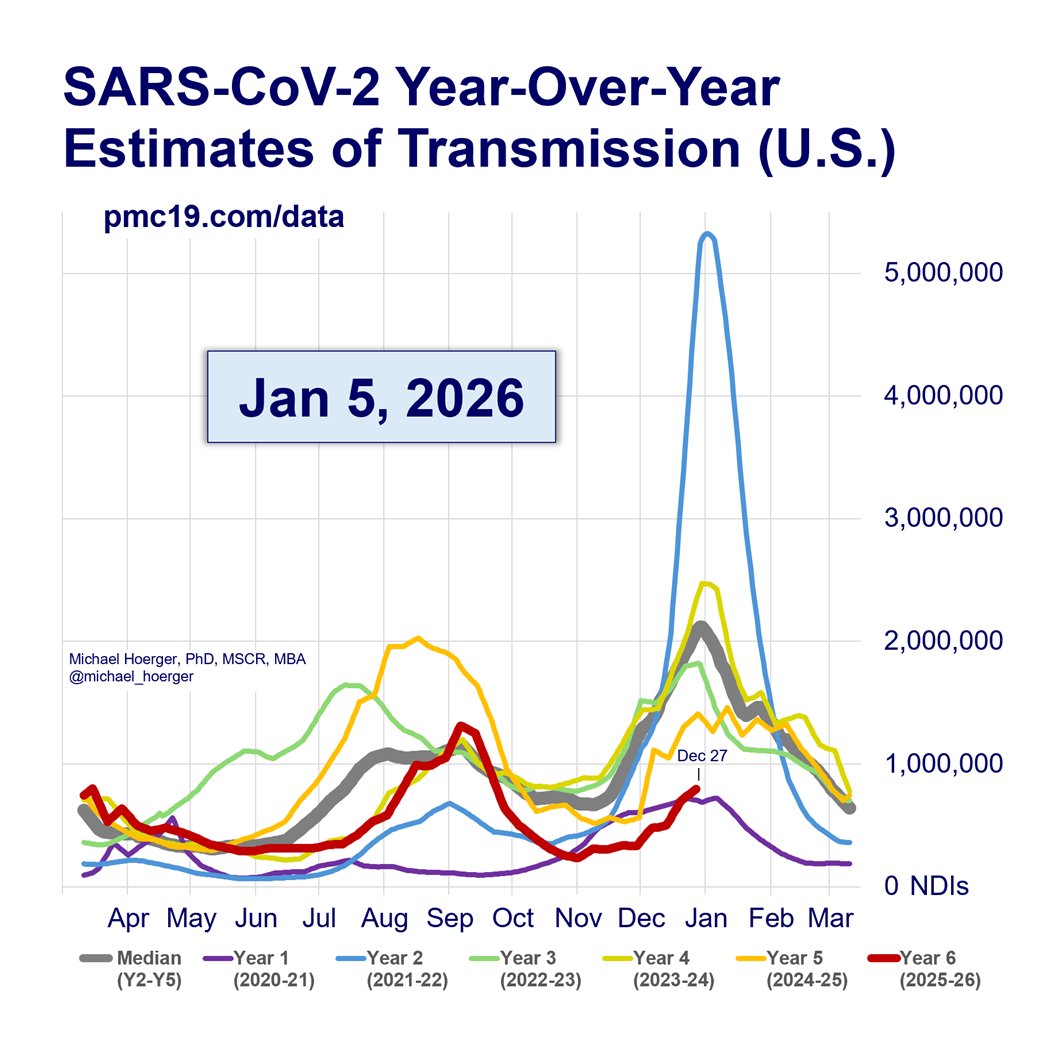
Zooming out, you'll see that we're in a very bad place historically. With the divergent forecasts, it's merely a matter of whether this is the 2nd biggest U.S. COVID surge or 4th biggest.
The #LongCOVID cases resulting from these infections may top 400,000/week.
3/
The #LongCOVID cases resulting from these infections may top 400,000/week.
3/

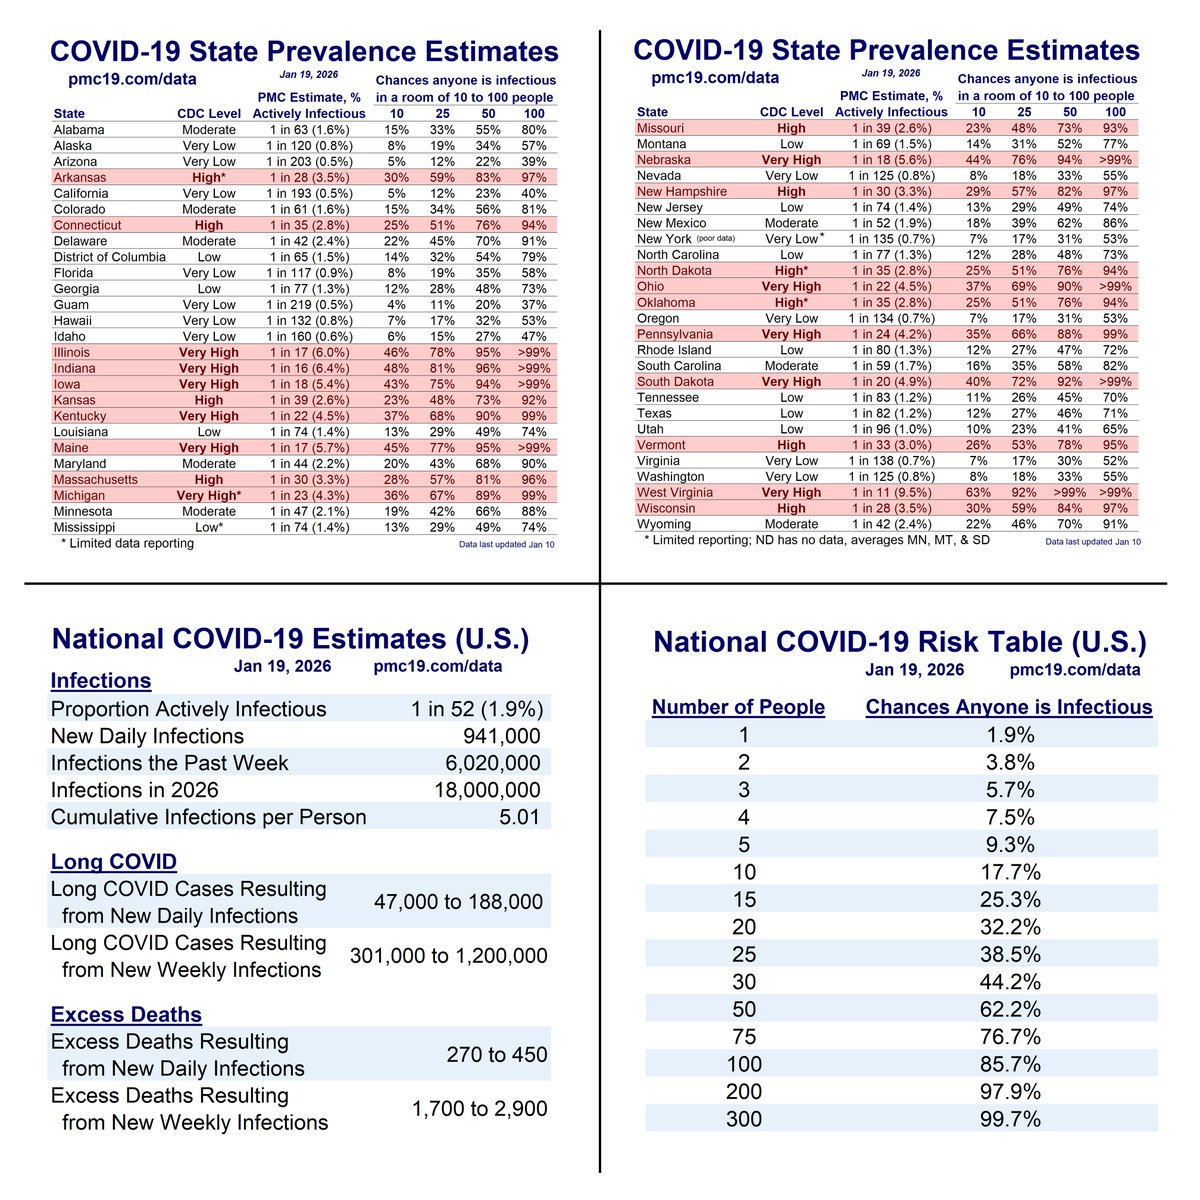
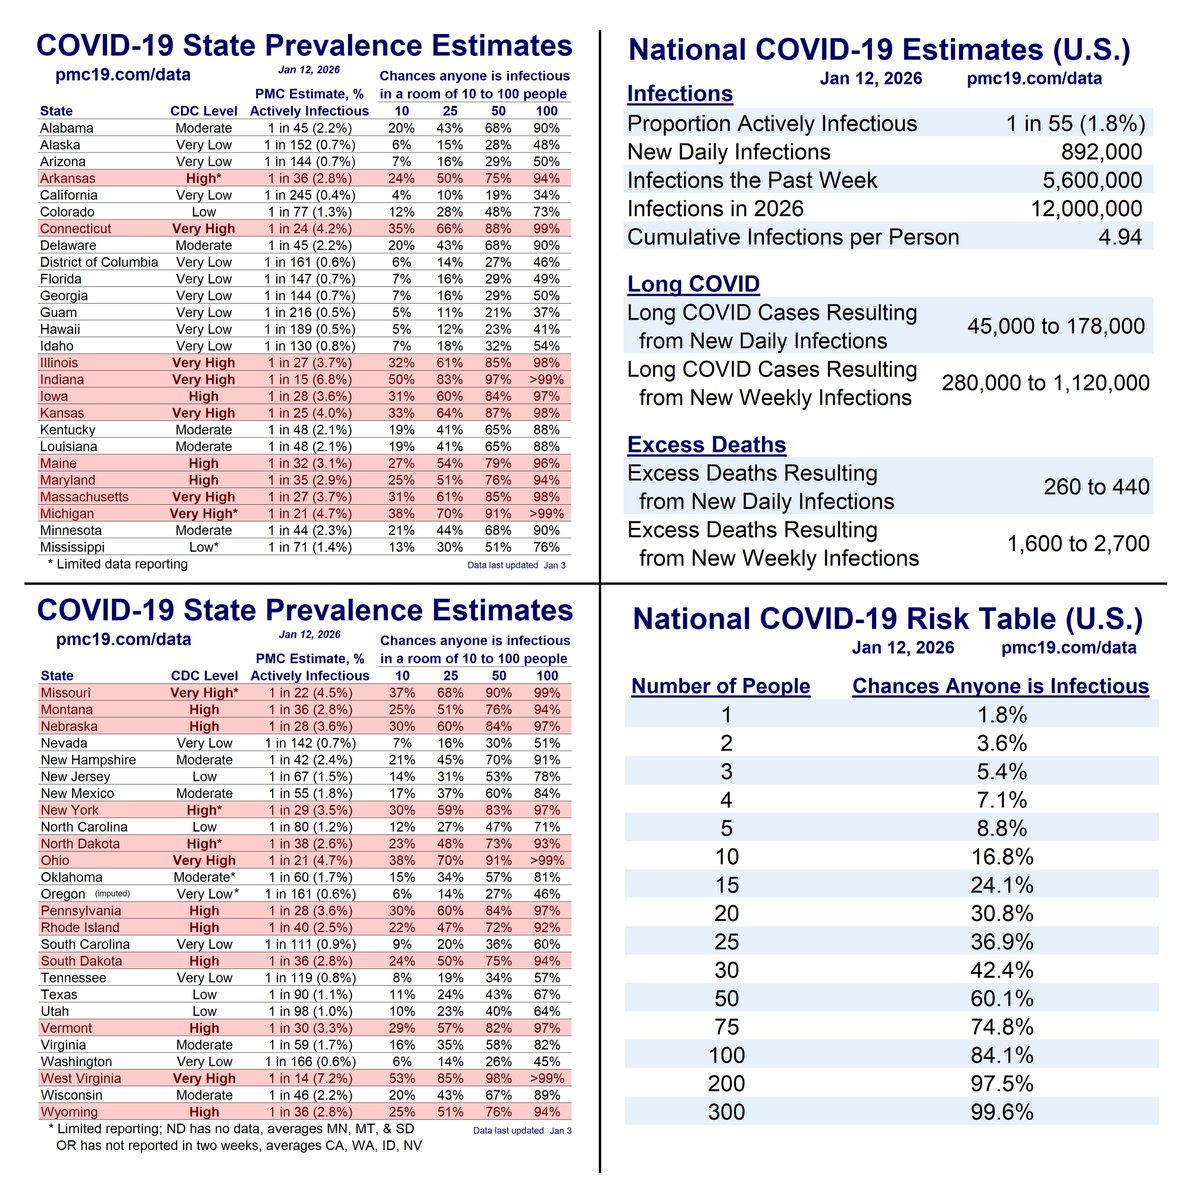
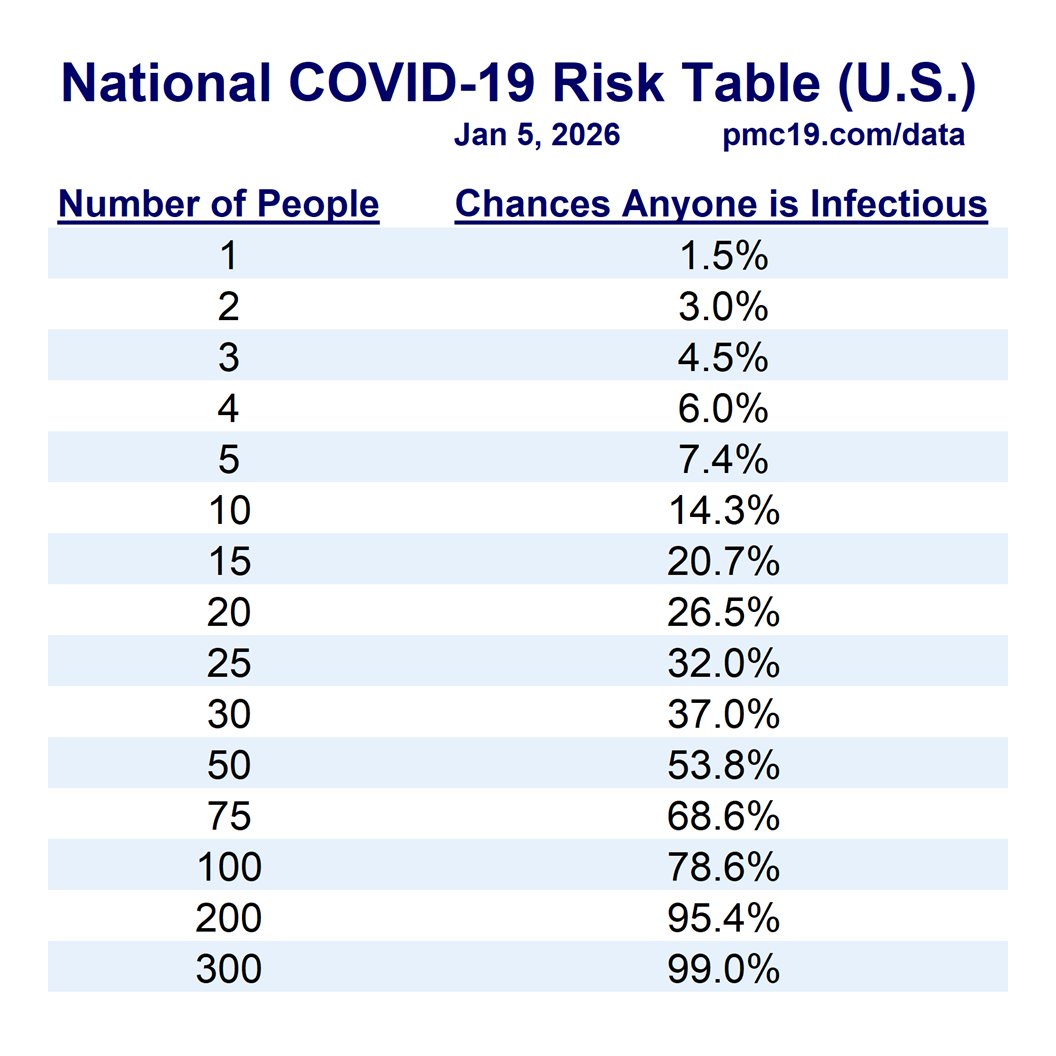
These are the chances of interacting with someone infectious on Dec 11, based on the total number of social contacts.
Interact with 10 people = 22% chance someone is infectious.
This helps explain why so many kids are getting sick at school lately.
4/
Interact with 10 people = 22% chance someone is infectious.
This helps explain why so many kids are getting sick at school lately.
4/

As of Dec 11, these are the updated chances of interacting with someone infectious on Christmas Day, based on the size of gathering(s).
At 6 people, the chances of interacting with someone infectious are the same as rolling a "1" on a die. At 20-25 people, it's a coin toss.
5/
At 6 people, the chances of interacting with someone infectious are the same as rolling a "1" on a die. At 20-25 people, it's a coin toss.
5/

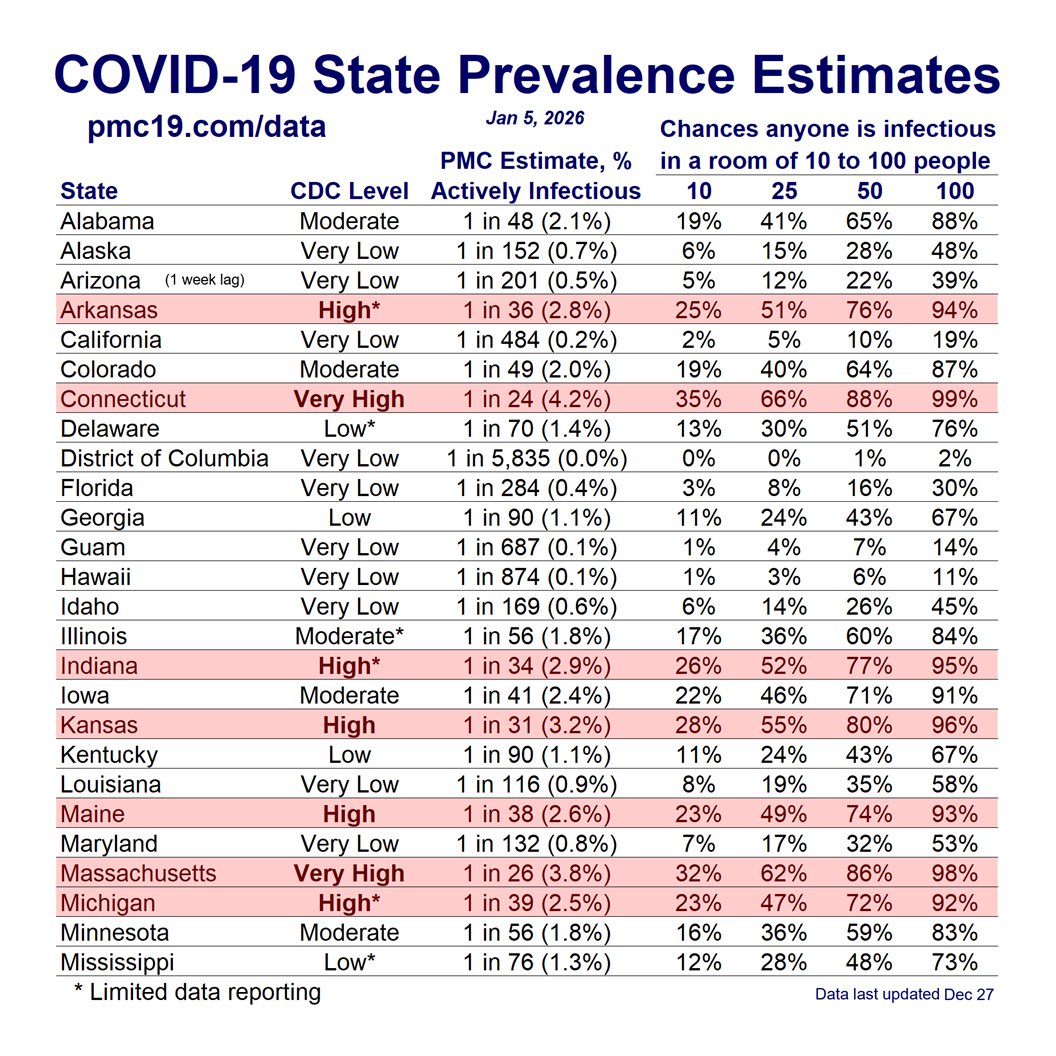
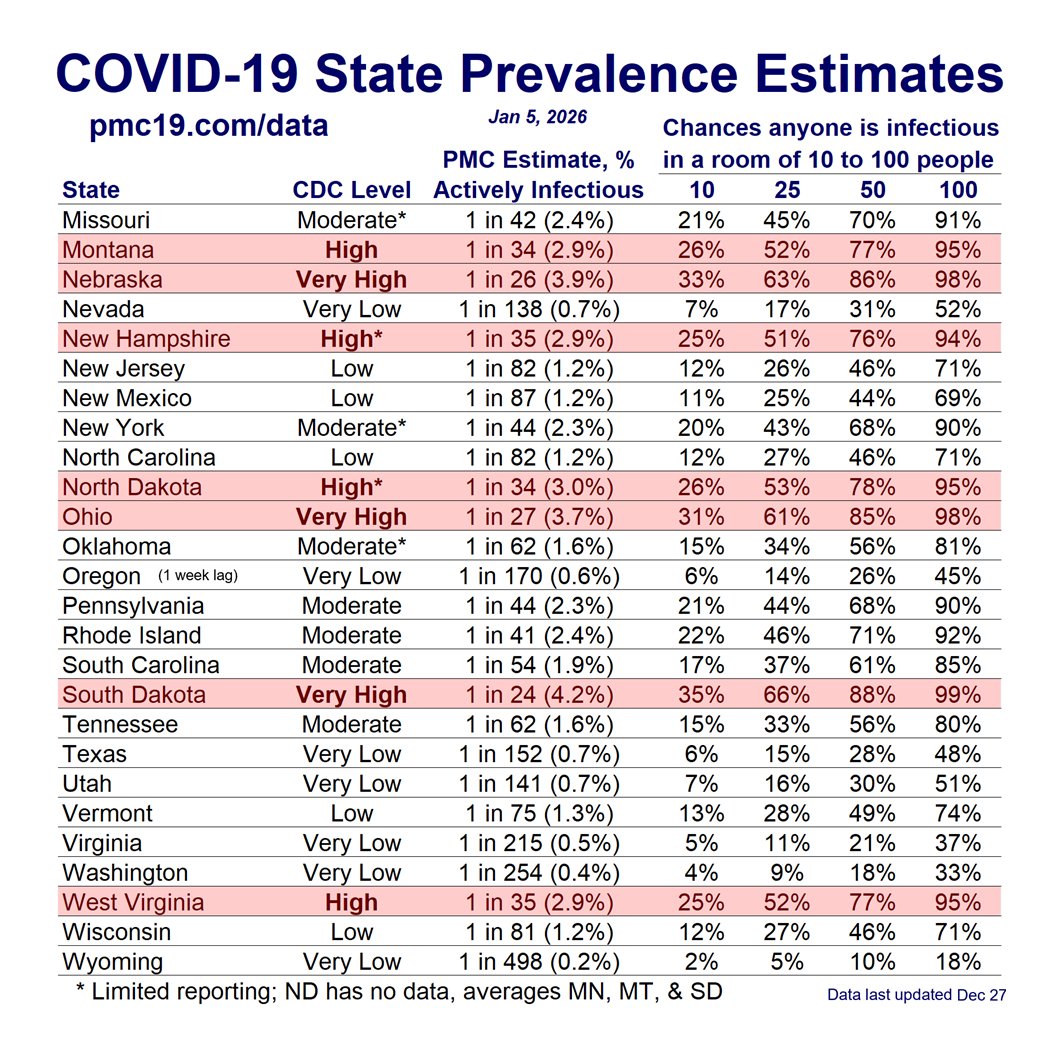
In the U.S., the current surge will peak sometime between Jan 1 and Jan 15. These are the chances of interacting with someone infectious around New Year's Day, near the peak.
6/
6/

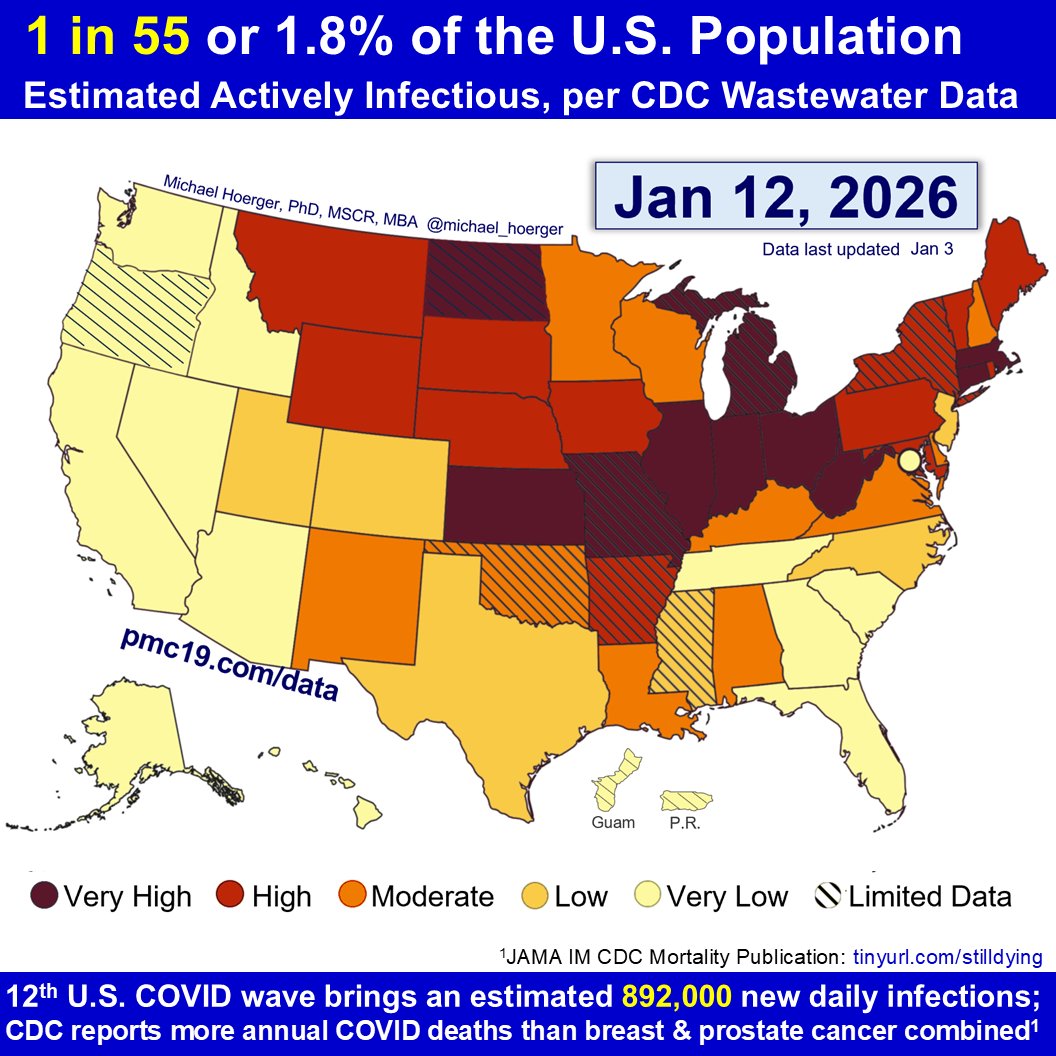
Here's the full PMC Dashboard for Dec 11 to Jan 8.
You can read the full report here:
Thank you for your continued questions, suggestions, gratitude, and sharing across other platforms. Please offer any success stories to encourage others.
7/ pmc19.com/data/

You can read the full report here:
Thank you for your continued questions, suggestions, gratitude, and sharing across other platforms. Please offer any success stories to encourage others.
7/ pmc19.com/data/

As a reminder, we have a contest to see who can use these data to help others. Please post success stories on the Tweet below.
8/
8/
https://twitter.com/michael_hoerger/status/1732517951993979376
• • •
Missing some Tweet in this thread? You can try to
force a refresh


