Glen Peters Profile picture
Dec 15 9 tweets 3 min read Twitter logo Read on Twitter
One of the key arguments that Norway uses to continue oil & gas developments, is that under BAU it is expected that oil & gas production will decline in line with <2°C scenarios, even with continued investment.

Let's look closer at these projections & reality...

1/ Image
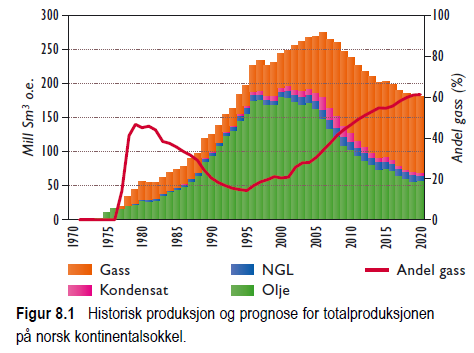
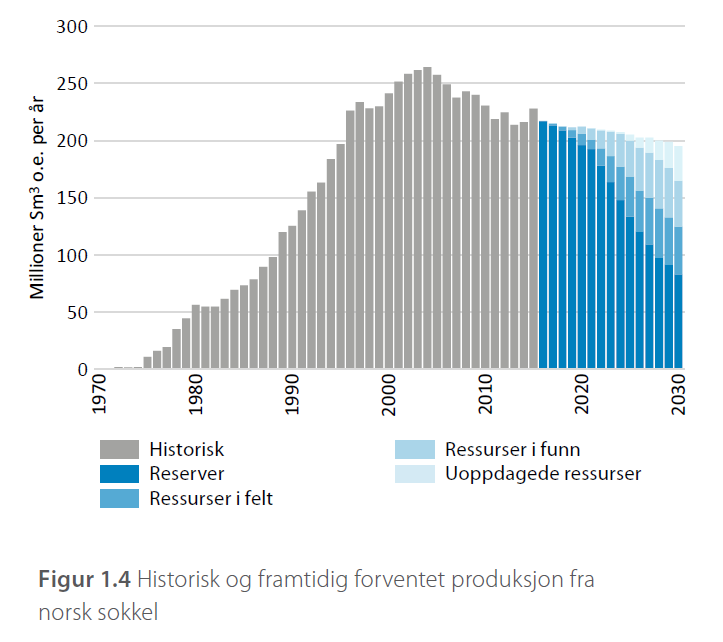
Here is the projections from the 2003 report from the petroleum agency.

In reality (tweet 1) there was a dip around 2010, but production is now up around 250 million cubic again.

The forecast was totally & utterly WRONG!

2/ Image
In 2011 there was a forecast for an increase in production to 2020, but then a decline. This is probably since they started to put the Johan Sverdrup field on the books.

The increase in production was way too low, again, they got it wrong.

3/ Image
In 2016, the forecast seemed to have lost the peak around 2020, but with a slower decline in production.

Again, according to history, they were wrong, even with a forecast window of only a few years!

4/ Image
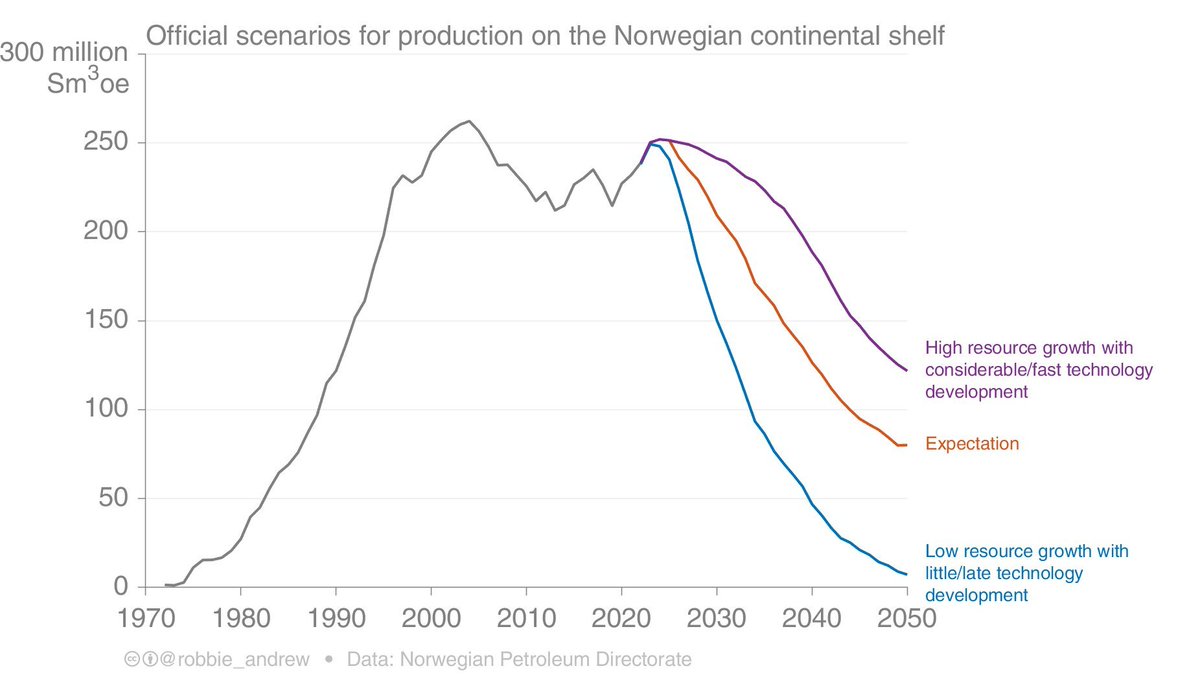
And here we are today. With a new high (local minima), currently over 250 million cubic, but an expectation of a decline afterwards.

The forecasts made have so far all been wrong!

Production has not declined as the petroleum agency has predicted.

5/ Image
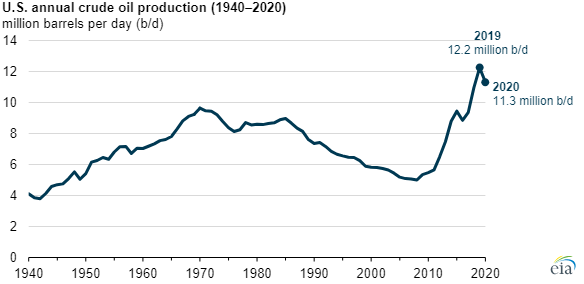
This is not uncommon, Norway is not alone. Everyone thought US oil production had peaked, until they found shale oil / gas.

6/ Image
The important point is that technology constantly proves these forecasts wrong.

Based on history, there is little evidence that Norwegian oil & gas production will fall as forecast.

Continued investment & technology evolution will make these forecasts wrong.

7/ Image
Norwegian climate policy is currently based on incorrectly telling people these forecasts are accurate, when they know they are not.

8/
See the thread by

and old resource reports can be found here


9/9
npd.no/aktuelt/publik…

• • •

Missing some Tweet in this thread? You can try to force a refresh
 

Keep Current with Glen Peters

Glen Peters Profile picture

Stay in touch and get notified when new unrolls are available from this author!

Read all threads

This Thread may be Removed Anytime!

PDF

Twitter may remove this content at anytime! Save it as PDF for later use!

Try unrolling a thread yourself!

how to unroll video
  1. Follow @ThreadReaderApp to mention us!

  2. From a Twitter thread mention us with a keyword "unroll"
@threadreaderapp unroll

Practice here first or read more on our help page!

More from @Peters_Glen

Dec 5
📢Global Carbon Budget 2023📢

Despite record growth in clean energy, global fossil CO2 emissions are expected to grow 1.1% [0-2.1%] in 2023.

Strong policies are needed to ensure fossil fuels decline as clean energy grows!


1/ essd.copernicus.org/articles/15/53…
Image
CO2 emissions by fossil fuel:
* We thought coal peaked in 2014. No, & up another 1.1% in 2023
* Oil up 1.5%, on the back of a 28% increase in international aviation & China, but oil remains below 2019 level. 🤞
* Has the golden age of gas come to an end thanks to Russia?

2/ Image
By top emitters:
* China up 4.0% & a peak this year would be a surprise
*US down 3.0%, with coal at 1903 levels
* India up 8.2%, with fossil CO2 clearly above the EU27
* EU27, down 7.4% with drops in all fuels
* Bunkers, up 11.9% due to exploding international aviation

3/ Image
Read 11 tweets
Nov 3
Is the new @DrJamesEHansen et al article an outlier, or rather mainstream?

At least in terms of the key headline numbers, it seems rather mainstream, particularly if you remember most headline key numbers have quite some uncertainty!


🧵1/ academic.oup.com/oocc/article/3…
Image
Equilibrium Climate Sensitivity of 4.8°C ± 1.2°C

IPCC best estimate 3°C
IPCC likely range: 2.5-4°C
IPCC very likely range: 2-5°C

Sure, Hansen et al are in the high end, but so are many others.

More details:

2/
Image
"...global warming will exceed 1.5°C in the 2020s & 2°C before 2050"

Here is the global warming from "Current Policies" in IPCC AR6 WGIII. Sorry folks, but Hansen is actually conservative.

Also, cast your eyes to 2020-2030: WARMING ACCELERATES

3/ Image
Read 7 tweets
Oct 31
The Remaining Carbon Budget for 1.5°C is now smaller because:
1) We have not reduced emissions in three years
2) Updated simple climate models because of updated historical aerosol emissions
3) Some new method choices


1/ nature.com/articles/s4155…
Image
The update for 2°C has similar changes for each component, but because the budget is much bigger, the changes don't seem that dramatic. Not Nature Climate Change worthy...

The changes to the 1.5°C budget seem dramatic, because the budget is basically gone.

2/ Image
These updates are not new. A few years back 1.5°C was considered "geophysically impossible", but not after a revised budget:


I wrote a post on the utility of 1.5°C budgets back then, obviously ignored. Also on non-CO2.


3/ nature.com/articles/ngeo3…
rdcu.be/0Tiv
Image
Read 5 tweets
Sep 7
ATTENTION

What is one of the most important decisions in climate science?

The selection of scenarios that will dominate climate research for the next 7+ years.

So, we wrote a perspective...

Here is the preprint:

1/ gmd.copernicus.org/preprints/gmd-…
Image
To illustrate the importance, here is ScenarioMIP from CMIP6/AR6!

This is where SSP5-85 is chosen, & in fact, "considered the highest priority".

Where is SSP1-19, perhaps the most important scenario in climate policy? It was 'forced' in afterwards!


2/ gmd.copernicus.org/articles/9/346…
Image
Following an @IPCC_CH workshop on scenarios in April 2023 (Bangkok), a few of us decided to put together a peer-reviewed paper to feed into ScenarioMIP. We invited more authors to contribute.

This is eminently sensible & I would encourage other communities as well!

3/
Read 17 tweets
Sep 6
My father was born in 1921 & it warmed 1°C in his life, but his life improved immensely in 100 years.

The world is on track (currently) to warm another 1°C in 100 years, does that mean a kid born in 2021 will have (similar) improvements in life?

Bold thinking. But why?

1/
I think the first paragraph of Brian's article highlights a problem.

First, reference 6, @OurWorldInData does not support this statement, only the last phrase.

Second, our current modelling framework simply cannot answer the question, & is arguably unable to.

2/ Image
Nearly all emission scenarios assessed by the IPCC use the principle of the Shared Socioeconomic Pathways (in fact, >90% use SSP2, but that is another story).

The SSP structure makes socioeconomic development, climate policy, & climate impacts completely independent.

3/
Read 10 tweets
Aug 17
To get to net zero CO2 emissions in 2050, the @IEA laid out a range of key milestones. There is so much work to do, in so many sectors. We know what to do.

There is also some Carbon Dioxide Removal. The IEA had ~2GtCO2 removed & stored, different to the 7.6GtCO2 'captured'.

1/ Image
The IEA has key pillars:
* energy efficiency
* behaviour (yes, even the IEA)
* electrification
* renewables
* hydrogen
* bioenergy
* CCUS

An industry like steel will have measures in all these pillars.

2/ Image
The IEA scenario uses quite some CCS, though, only a small amount of that is BECCS & DACCS (CDR). Of the 7.6GtCO2 CCS, only 1.9GtCO2 is CDR (with storage).

3/ Image
Read 6 tweets

Did Thread Reader help you today?

Support us! We are indie developers!


This site is made by just two indie developers on a laptop doing marketing, support and development! Read more about the story.

Become a Premium Member ($3/month or $30/year) and get exclusive features!

Become Premium

Don't want to be a Premium member but still want to support us?

Make a small donation by buying us coffee ($5) or help with server cost ($10)

Donate via Paypal

Or Donate anonymously using crypto!

Ethereum

0xfe58350B80634f60Fa6Dc149a72b4DFbc17D341E copy

Bitcoin

3ATGMxNzCUFzxpMCHL5sWSt4DVtS8UqXpi copy

Thank you for your support!

Follow Us on Twitter!

:(