Google "algorithmic trading" and get 88,300,000 results.
Google "python tutorial" and get 717,000,000 results.
Utterly exhausting.
Impossible to navigate.
So I took 805,300,000 search results, added in 22+ years of experience, and had a baby.
This is what I named it:
Google "python tutorial" and get 717,000,000 results.
Utterly exhausting.
Impossible to navigate.
So I took 805,300,000 search results, added in 22+ years of experience, and had a baby.
This is what I named it:

Getting Started With Python for Quant Finance.
Get up and running with Python fast:
• Copy-paste code to apply immediately
• Help to debug code and ask questions
• Practical experience you can use now
• Get the Python Quant Stack installed
Here's what's packed inside:
Get up and running with Python fast:
• Copy-paste code to apply immediately
• Help to debug code and ask questions
• Practical experience you can use now
• Get the Python Quant Stack installed
Here's what's packed inside:
On top of $4,500 in BONUSES, you'll:
• Install the Python quant stack
• Get the Python basics right
• Assess trading strategies
• Compete in algo trading
• Backtest strategies
• Automate trades
• Engineer alpha
And here are some of the Notebooks:
• Install the Python quant stack
• Get the Python basics right
• Assess trading strategies
• Compete in algo trading
• Backtest strategies
• Automate trades
• Engineer alpha
And here are some of the Notebooks:
Backtest a trading strategy
When you're ready, use a backtesting framework to analyze the risk and performance metrics of your strategy.
This Notebook shows you how to backtest a strategy.
When you're ready, use a backtesting framework to analyze the risk and performance metrics of your strategy.
This Notebook shows you how to backtest a strategy.

Price options with the Edgeworth model
Pricing models assume stock returns are normally distributed. They're not. The Edgeworth model introduces skew and kurtosis.
This Notebook shows you how to price an option with the Edgeworth model.
Pricing models assume stock returns are normally distributed. They're not. The Edgeworth model introduces skew and kurtosis.
This Notebook shows you how to price an option with the Edgeworth model.

Use GARCH to forecast volatility
Quants use volatility forecasting to find market mispricings. Most volatility forecasts start with GARCH.
This Notebook shows you how you find market mispricings.
Quants use volatility forecasting to find market mispricings. Most volatility forecasts start with GARCH.
This Notebook shows you how you find market mispricings.

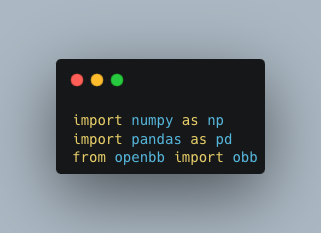
Python basics tutorial and walkthrough
If you're just getting started with Python, you need a good walkthrough of the basics.
This Notebook shows you how to get started with Python.
If you're just getting started with Python, you need a good walkthrough of the basics.
This Notebook shows you how to get started with Python.

pandas tutorial and walkthrough
Working with data starts with pandas. It's the standard tool for data manipulation in Python. It was started by a hedge fund.
This Notebook walks through the most important parts of pandas.
Working with data starts with pandas. It's the standard tool for data manipulation in Python. It was started by a hedge fund.
This Notebook walks through the most important parts of pandas.

SciPy tutorial and walkthrough
The statistical functions like probability distributions that underpin quant finance are in SciPy.
This Notebook shows you what you need to use SciPy for quant finance.
The statistical functions like probability distributions that underpin quant finance are in SciPy.
This Notebook shows you what you need to use SciPy for quant finance.

yfinance tutorial and walkthrough
To build trading algorithims, you need stock and options data. yfinance is your gateway to free market data.
This Notebook walks you through the basics of using yfinance.
To build trading algorithims, you need stock and options data. yfinance is your gateway to free market data.
This Notebook walks you through the basics of using yfinance.

Theta Data tutorial and walkthrough
Historic and real time options data is expensive and hard to find. Theta Data gives you an API to access historic and real time options data.
This Notebook shows you how to use the API.
Historic and real time options data is expensive and hard to find. Theta Data gives you an API to access historic and real time options data.
This Notebook shows you how to use the API.

Riskfolio-Lib tutorial and walkthrough
Teams of Ph.D.s spent decades refining the portfolio optimization. Riskfolio-Lib wraps up dozens of portfolio and risk optimizations in one library.
This Notebook walks you through an example of how to use it.
Teams of Ph.D.s spent decades refining the portfolio optimization. Riskfolio-Lib wraps up dozens of portfolio and risk optimizations in one library.
This Notebook walks you through an example of how to use it.

QuantStats tutorial and walkthrough
Don't rebuild the statistical functions you need for risk and performance reporting. QuantStats gives you a library of common risk and performance metrics ready to use.
This Notebook outlines common use cases.
Don't rebuild the statistical functions you need for risk and performance reporting. QuantStats gives you a library of common risk and performance metrics ready to use.
This Notebook outlines common use cases.

Connect to Interactive Brokers with Python
The first step in automatic execution is connecting to your broker.
This Notebook gives you the code to make the connection.
The first step in automatic execution is connecting to your broker.
This Notebook gives you the code to make the connection.

Risk management with value at risk
Hedge funds and trading firms value at risk to capture probability of losing money. You can use it too.
This Notebook shows you how to build your own value at risk measure.
Hedge funds and trading firms value at risk to capture probability of losing money. You can use it too.
This Notebook shows you how to build your own value at risk measure.

Risk management with drawdown analysis
Drawdown is an important factor to consider when analyzing trading strategies. It's used to help undertand risk of going broke.
This Notebook calculates drawdown for a stock or portfolio.
Drawdown is an important factor to consider when analyzing trading strategies. It's used to help undertand risk of going broke.
This Notebook calculates drawdown for a stock or portfolio.

Simulate stock prices with Geometric Brownian Motion
The foundation of all derivative pricing is asset price simulation. One of the most common methods is Geometric Brownian Motion.
This Notebook shows you how to simulate stock prices.
The foundation of all derivative pricing is asset price simulation. One of the most common methods is Geometric Brownian Motion.
This Notebook shows you how to simulate stock prices.

Simple order execution on Interactive Brokers with Python
Once you connect, you need to test simple trade execution.
This Notebook shows you how to send simple buy orders to Interactive Brokers.
Once you connect, you need to test simple trade execution.
This Notebook shows you how to send simple buy orders to Interactive Brokers.

Advanced algo trading on Interactive Brokers with Python
Once you get the connection set and a trade done, add complexity to your trading algorithms.
This Notebook demonstrates an advanced trading strategy executing on Interactive Brokers.
Once you get the connection set and a trade done, add complexity to your trading algorithms.
This Notebook demonstrates an advanced trading strategy executing on Interactive Brokers.

Store real time market data from Interactive Brokers with Python
All quants need data. The free sources are ok, but if you need something more complex, save it from Interactive Brokers.
This Notebook shows you how to save market data directly from the market.
All quants need data. The free sources are ok, but if you need something more complex, save it from Interactive Brokers.
This Notebook shows you how to save market data directly from the market.

• • •
Missing some Tweet in this thread? You can try to
force a refresh