Poverty and crime.
In the public imagination, these things go hand-in-hand.
But the link between poverty and crime is much weaker than people might imagine. It might not even be causal.
A new lottery study shows us just that:
🧵
In the public imagination, these things go hand-in-hand.
But the link between poverty and crime is much weaker than people might imagine. It might not even be causal.
A new lottery study shows us just that:
🧵

To understand the causes of crime, there are other things you need to understand first.
For example, you need to understand the roles of sex and age.
In the whole country the lottery study results came from, you get this result when you plot both variables.
For example, you need to understand the roles of sex and age.
In the whole country the lottery study results came from, you get this result when you plot both variables.
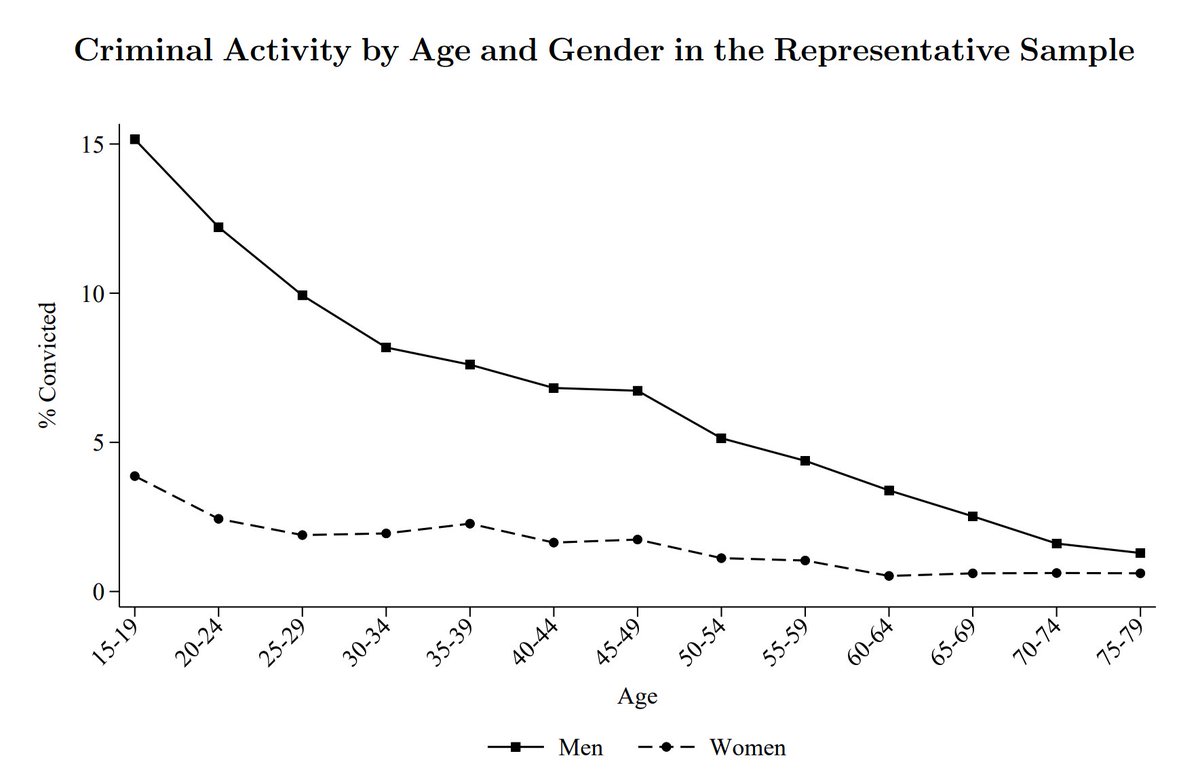
The collapse in criminal offending from adolescence is the crux of the "age-crime curve". The gap between men and women that declines with age is another important part.
Unlike age and crime, income and crime are nonlinearly related: after a certain level, income barely matters.
Unlike age and crime, income and crime are nonlinearly related: after a certain level, income barely matters.

To understand why crime and income relate, we must realize they aren't related randomly.
For example, schizophrenia is marked by premorbid cognitive deficits and it increases criminality while reducing socioeconomic attainment
For example, schizophrenia is marked by premorbid cognitive deficits and it increases criminality while reducing socioeconomic attainment
https://twitter.com/cremieuxrecueil/status/1703516702523154816
https://twitter.com/cremieuxrecueil/status/1703525540022321632
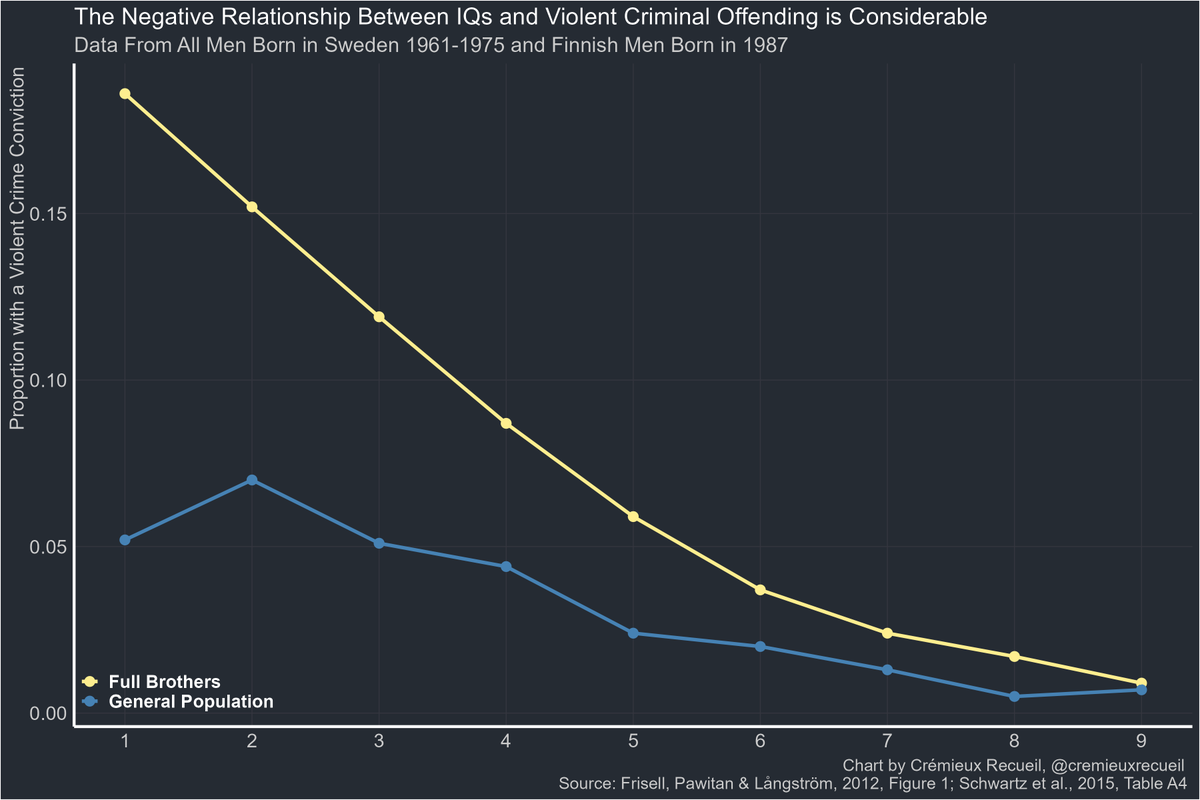
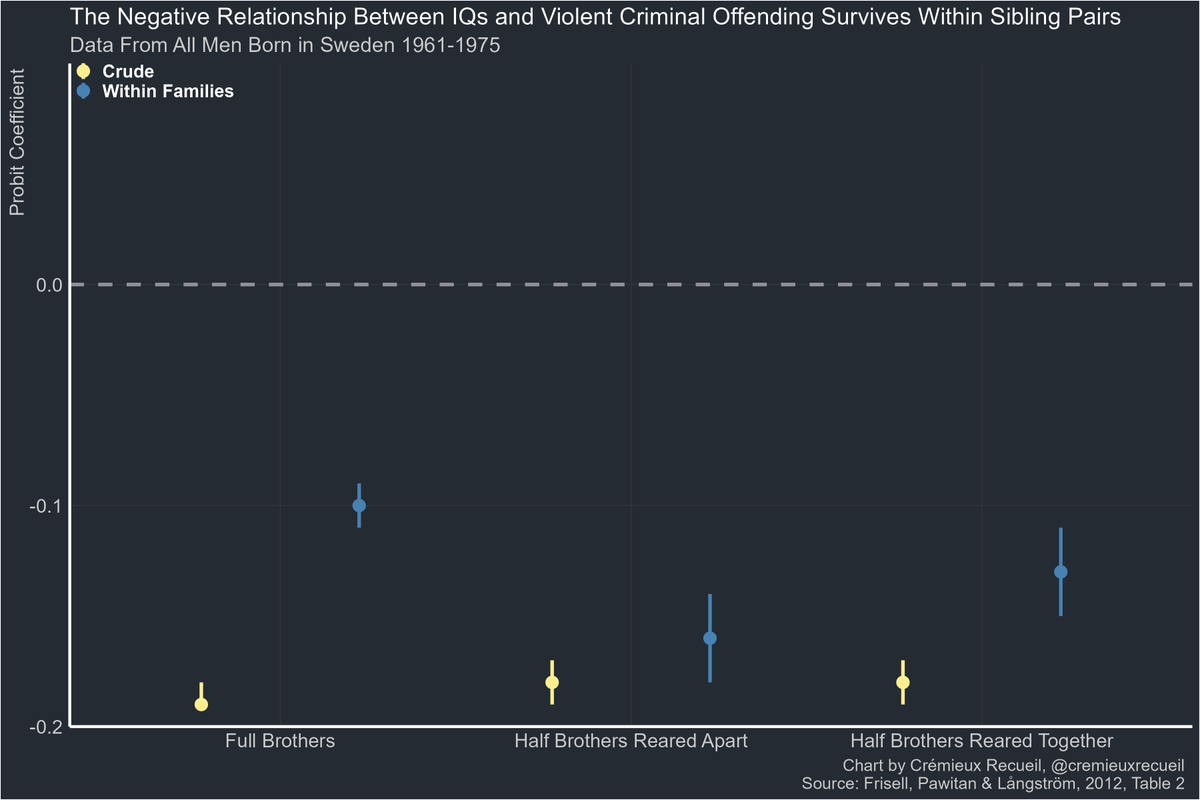
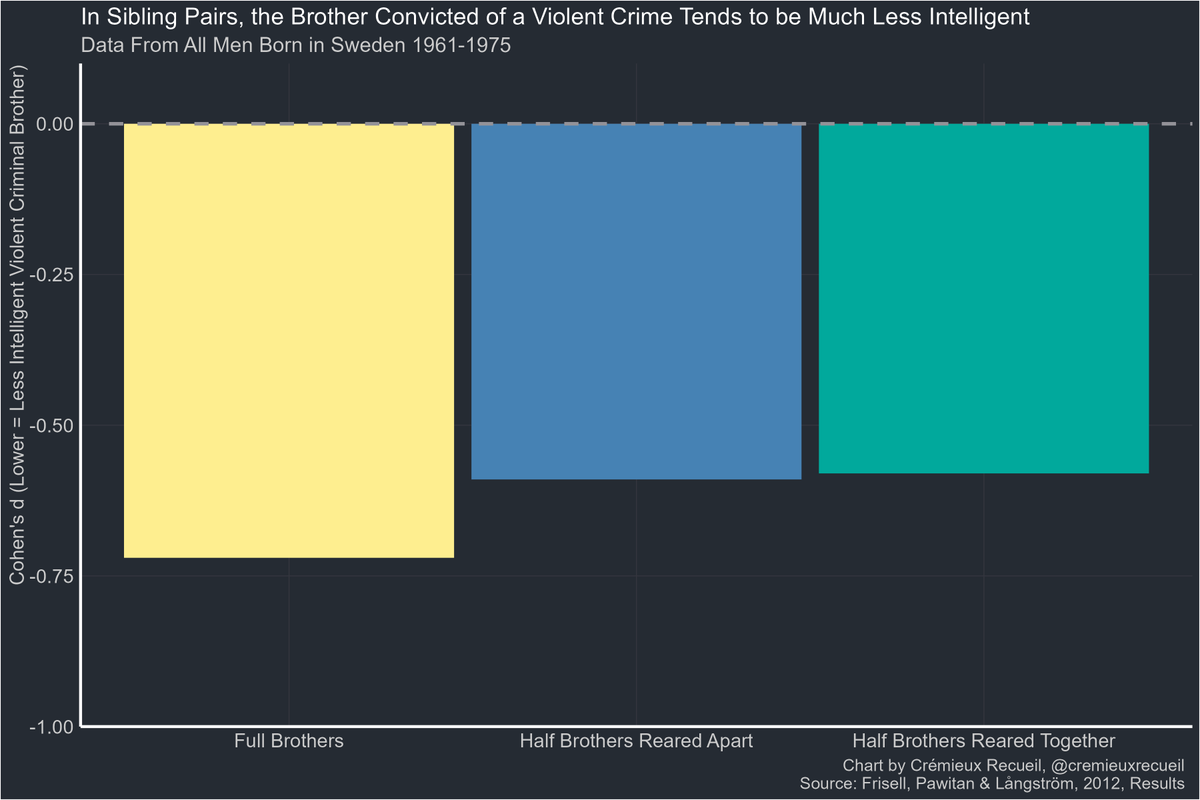
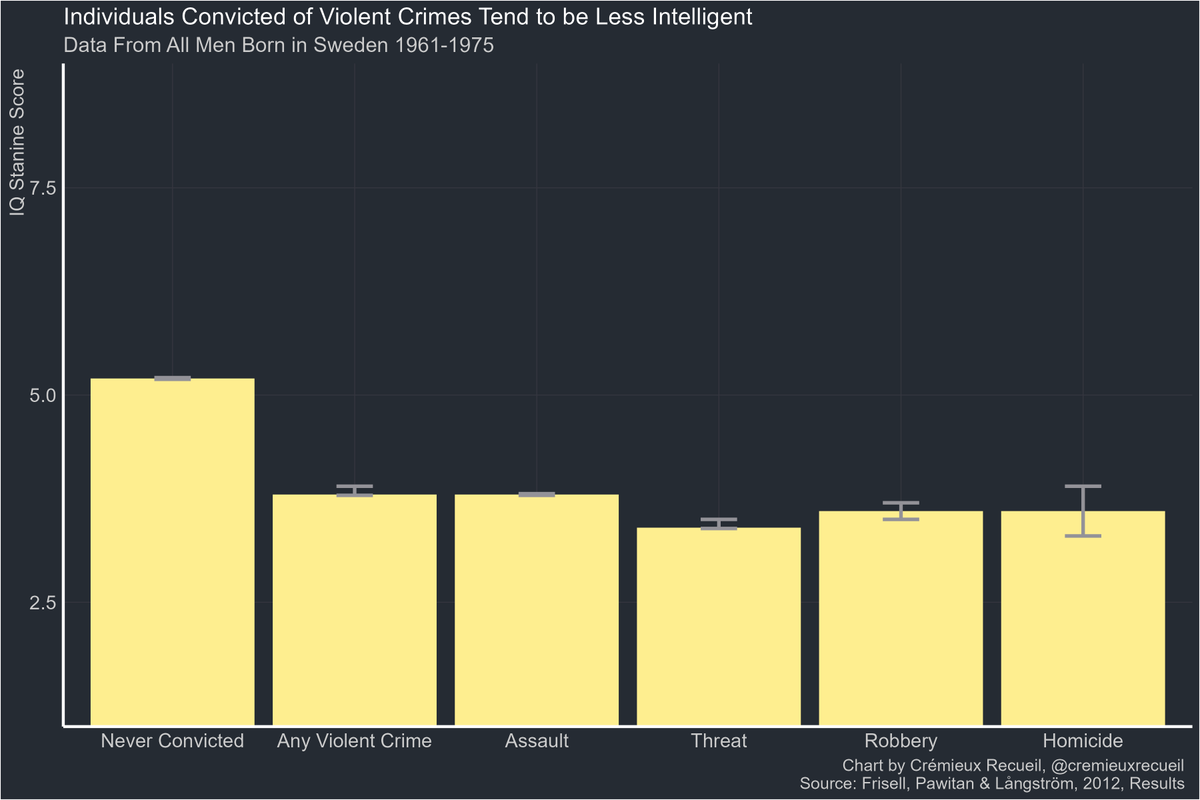
Moreover, other crime-disposing factors like intelligence appear to be causal.
As an example, consider how within families, the less intelligent sibling is more likely to become a criminal.
As an example, consider how within families, the less intelligent sibling is more likely to become a criminal.
This is where lotteries come in: they create a quasi-random sample of people whose traits are unrelated to their wealth.
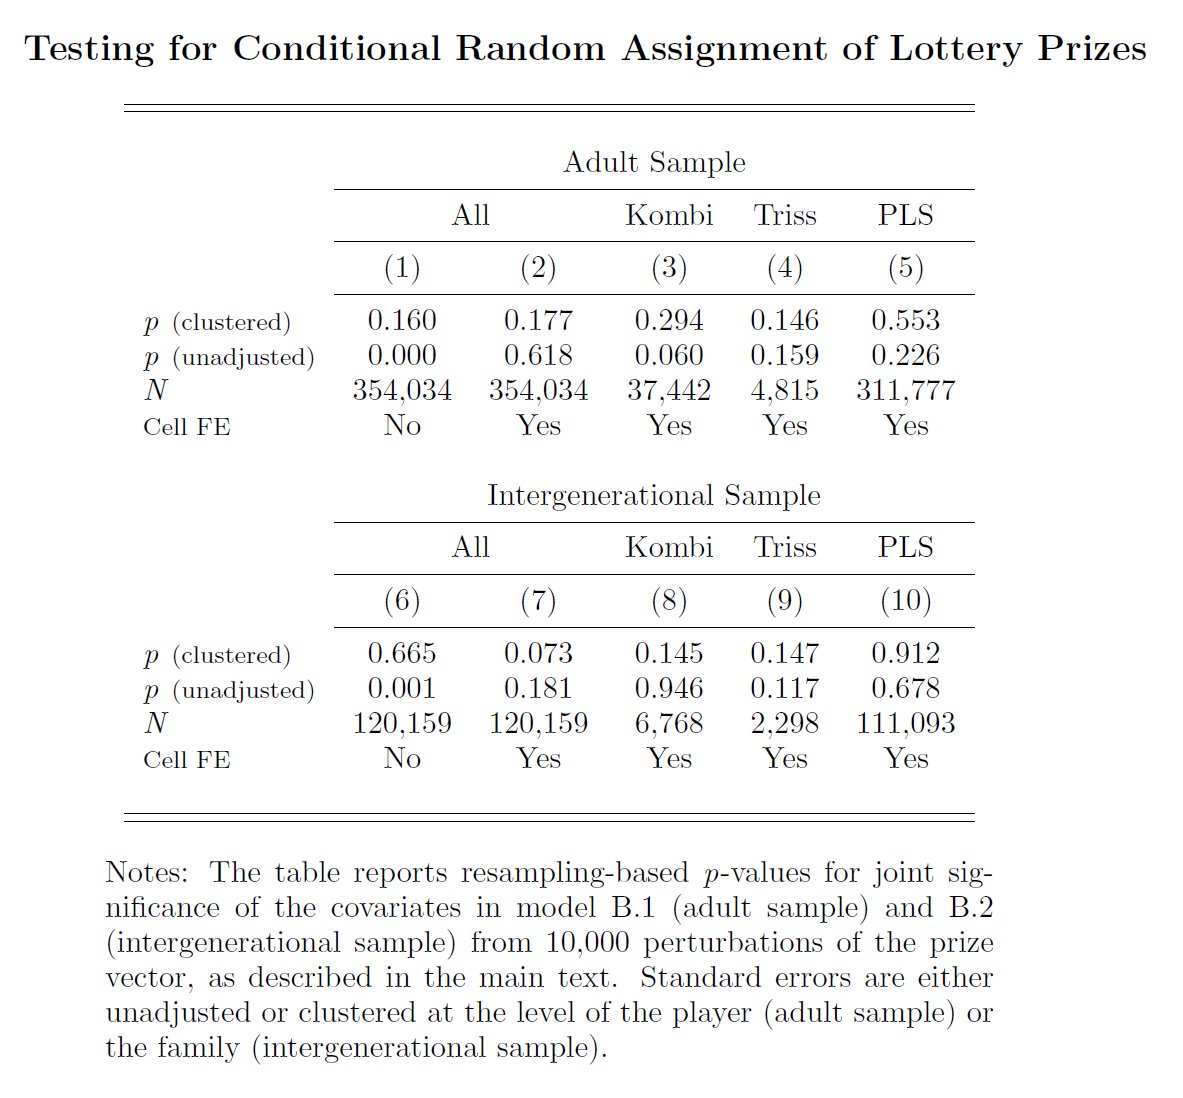
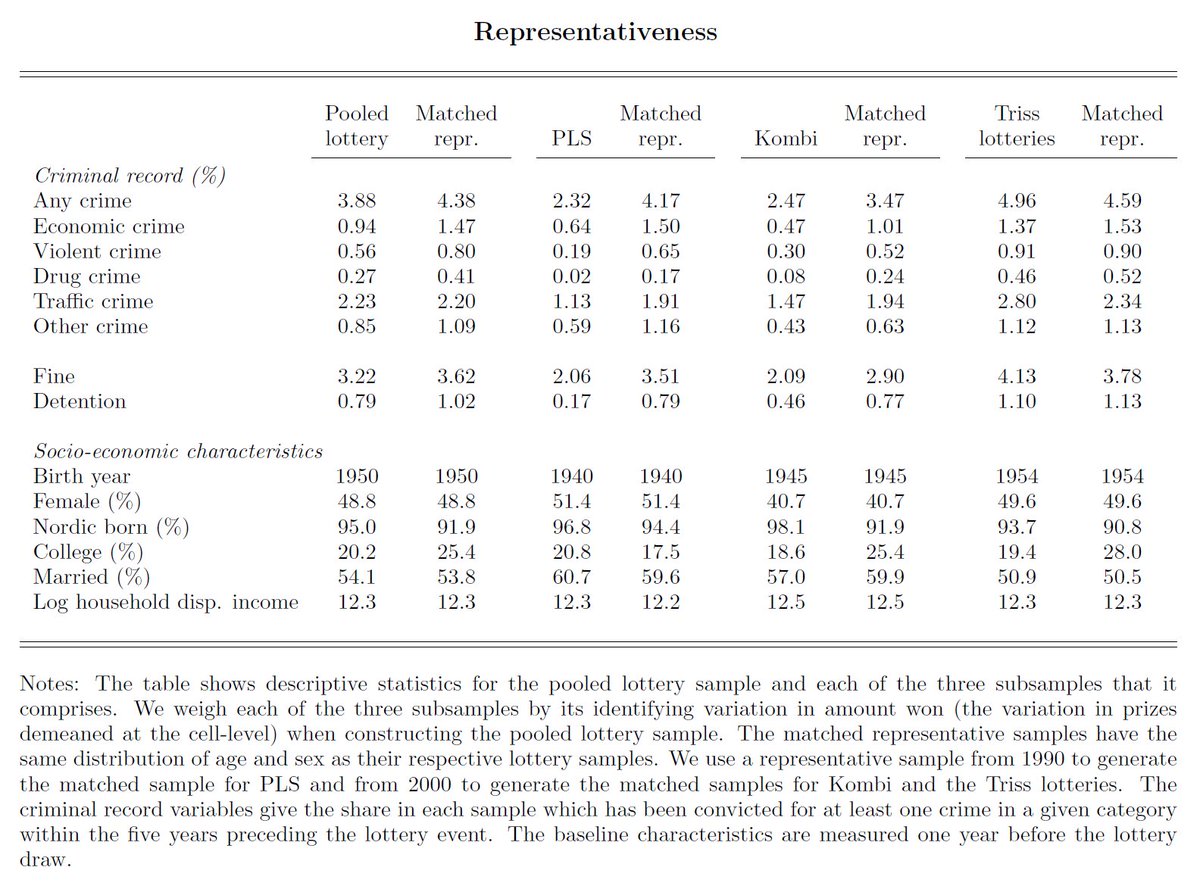
This leads to good causal identification because winning the lottery, among players, is random, and playing the lottery doesn't seem to be selective either:
This leads to good causal identification because winning the lottery, among players, is random, and playing the lottery doesn't seem to be selective either:
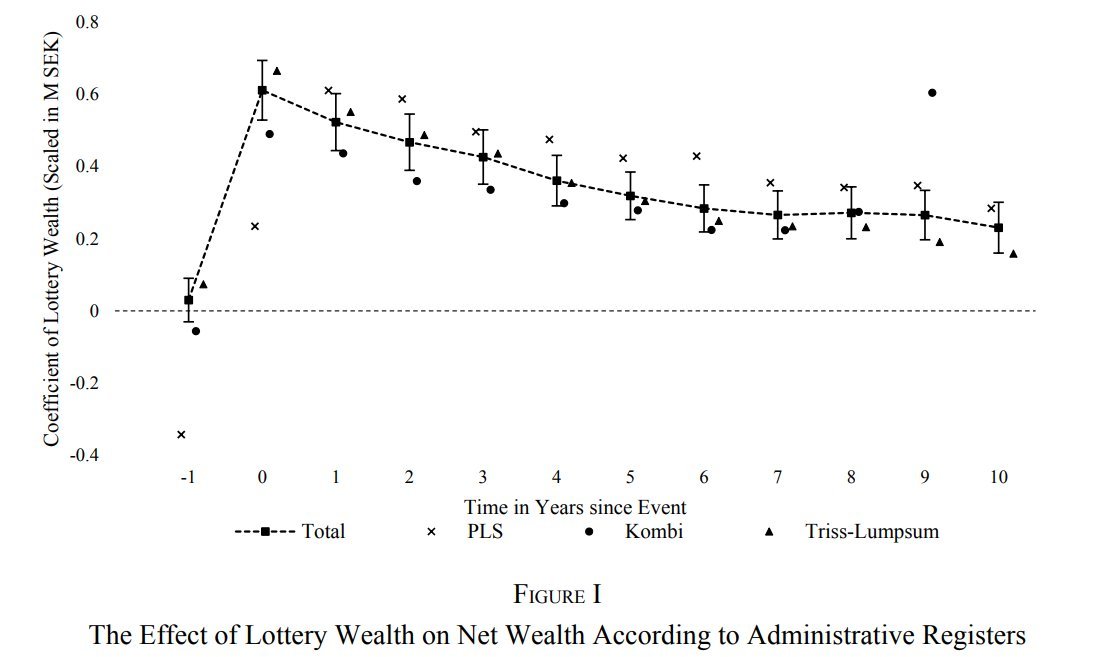
The other condition we need for causal inference is that lottery winnings aren't rapidly dissipated. As it turns out, these practically random samples have durably increased wealth as a result of winning the lottery.
So all are conditions are met for powerful causal inference.
So all are conditions are met for powerful causal inference.
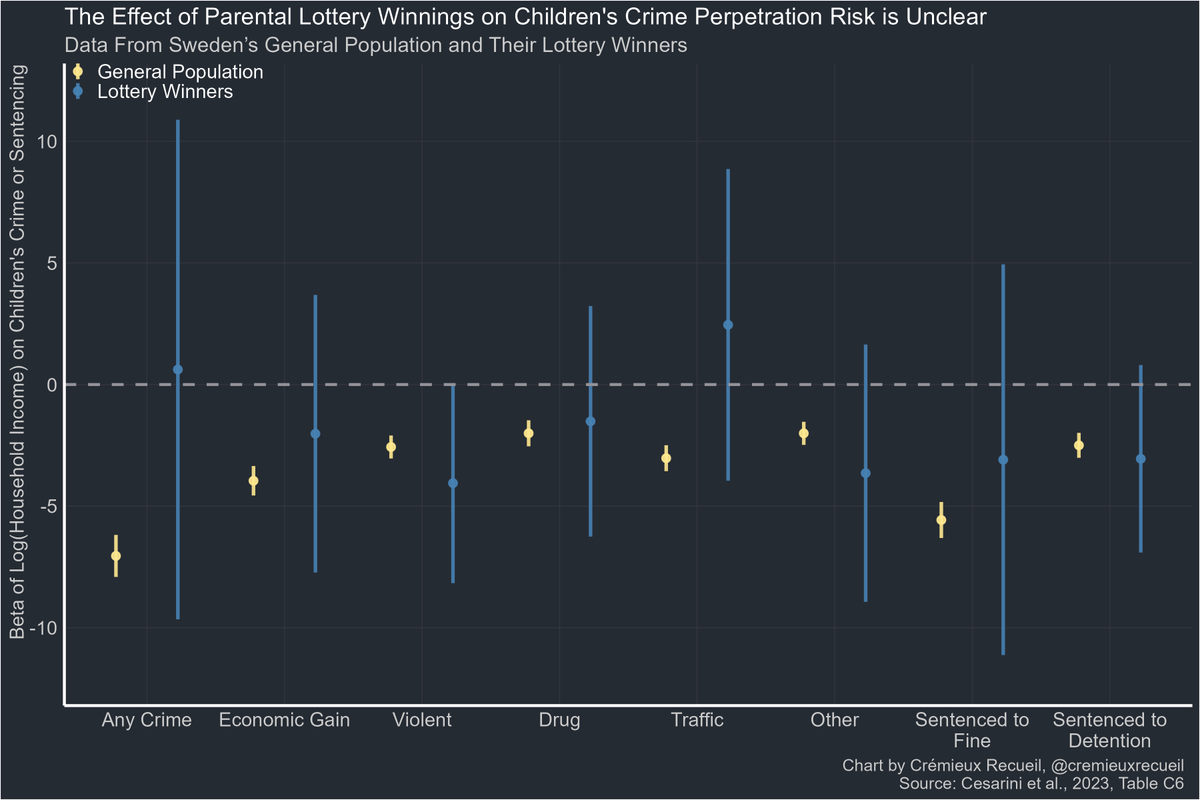
As you can see in the OP, the effect of lottery wealth is distinct from the one for wealth in the general pop.
Lottery wealth was not significantly related to any category of crime or sentencing and it significantly differed from the gen pop effect in all but one case (traffic).
Lottery wealth was not significantly related to any category of crime or sentencing and it significantly differed from the gen pop effect in all but one case (traffic).
This effect is not especially related to time.
Consider the effect on perpetrating any crime over a time period of ten whole years.
It's bupkis, in terms of significance, scale, and trend.
Consider the effect on perpetrating any crime over a time period of ten whole years.
It's bupkis, in terms of significance, scale, and trend.

If you read the conditional random assignment table, you might have seen that there were also intergenerational results: results for effects on kids' risk of crime.
Those results were ambiguous due to low power, so it's not clear what to make of them.
Those results were ambiguous due to low power, so it's not clear what to make of them.
With that said, it's not like this is the only time the relationship between crime and poverty, wealth, income, neighborhood quality, recidivism—anything like that—has been investigated.
So let's look through some other designs and results.
So let's look through some other designs and results.
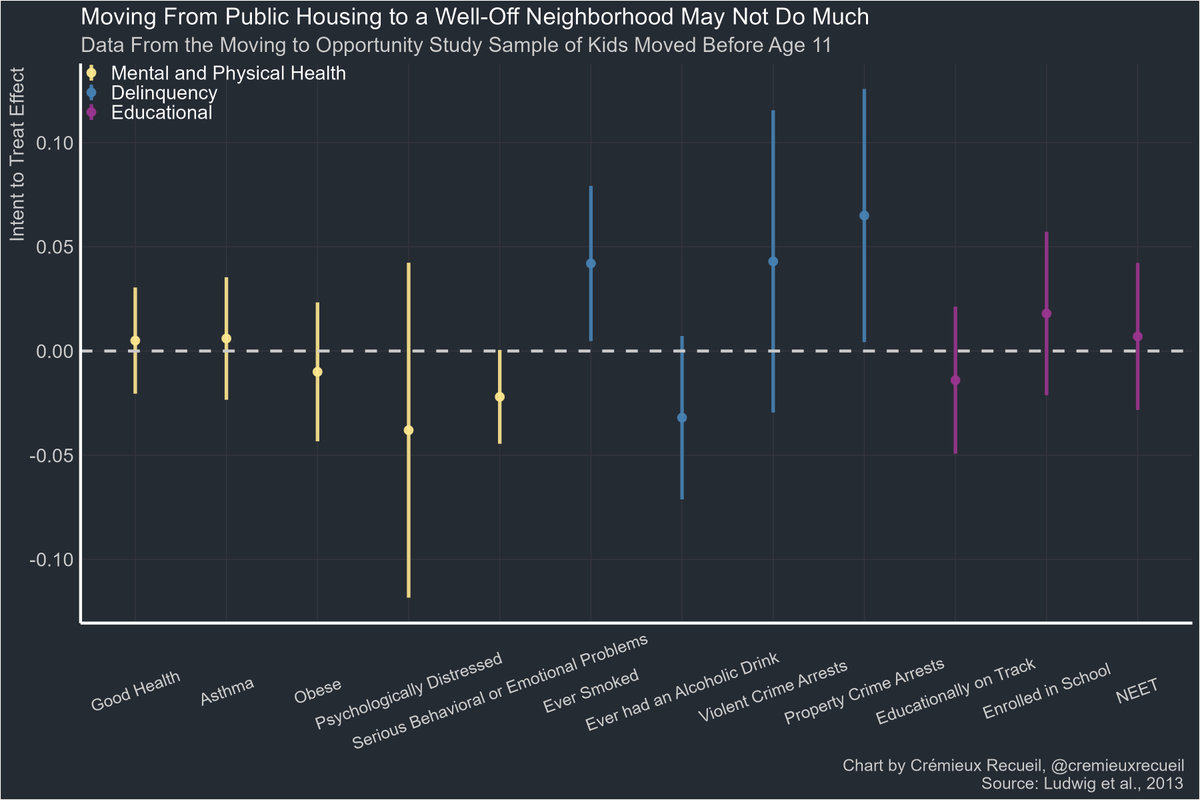
In Moving to Opportunity (MTO), families were given vouchers to move to good neighborhoods.
The result for people who moved at a young age? Not much, but marginally higher violent crime perpetration.
The result for people who moved at a young age? Not much, but marginally higher violent crime perpetration.
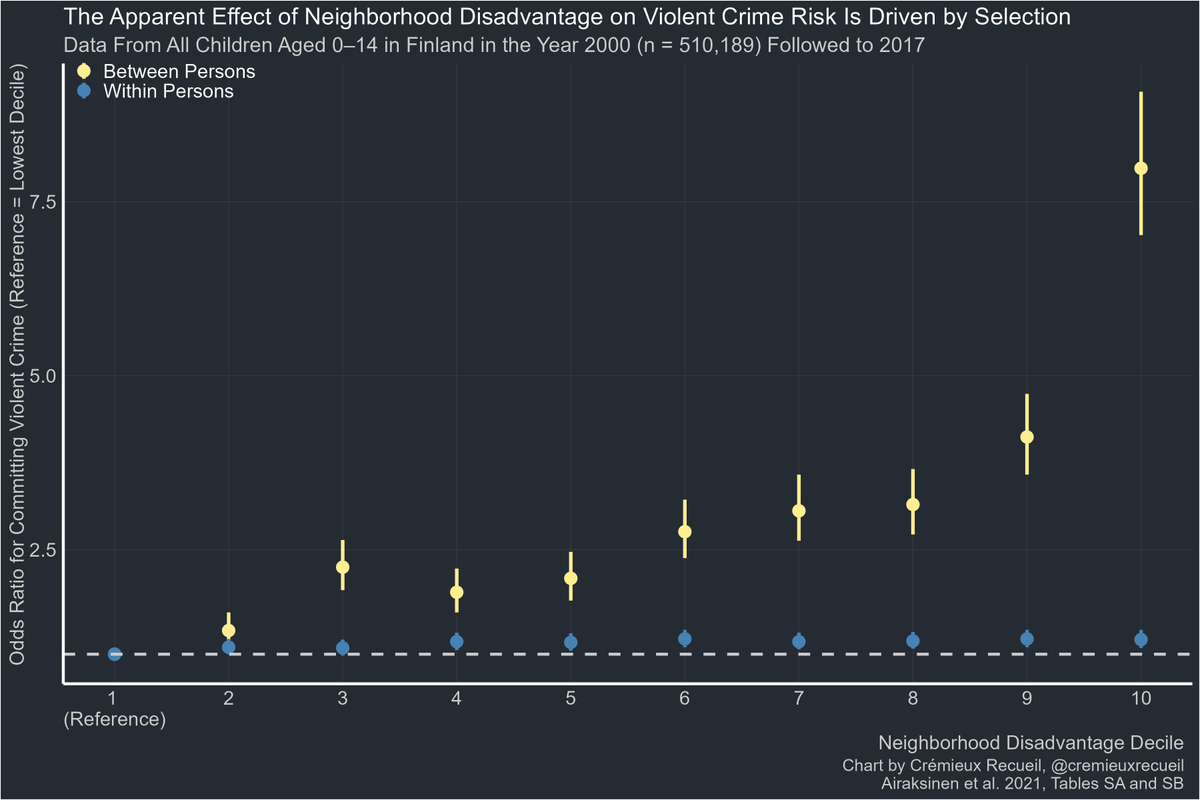
If we watch the same people over time, we can see why, for example, neighborhood deprivation and the risk of being a violent criminal are associated.
Between persons, bad neighborhoods, more criminals.
Within persons, going to a bad or good neighborhood doesn't affect risk.
Between persons, bad neighborhoods, more criminals.
Within persons, going to a bad or good neighborhood doesn't affect risk.
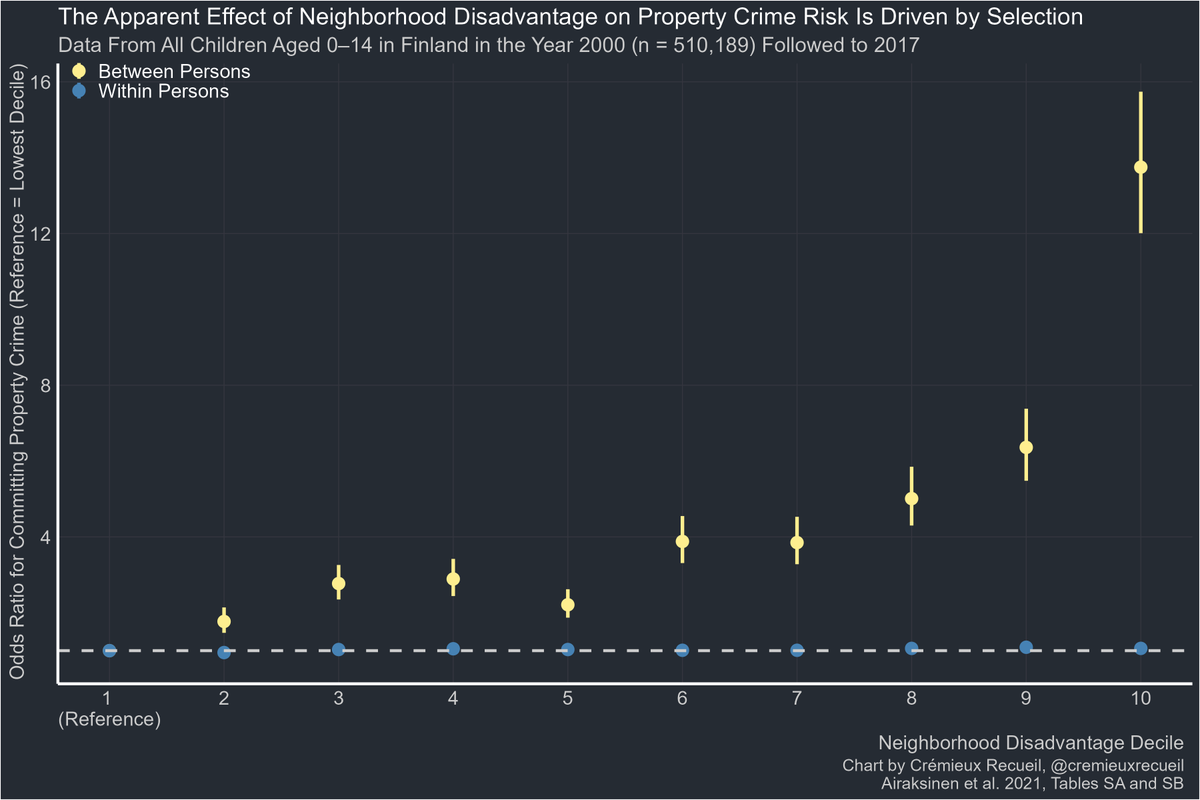
If we apply this same logic to property crimes, we get a similar result.
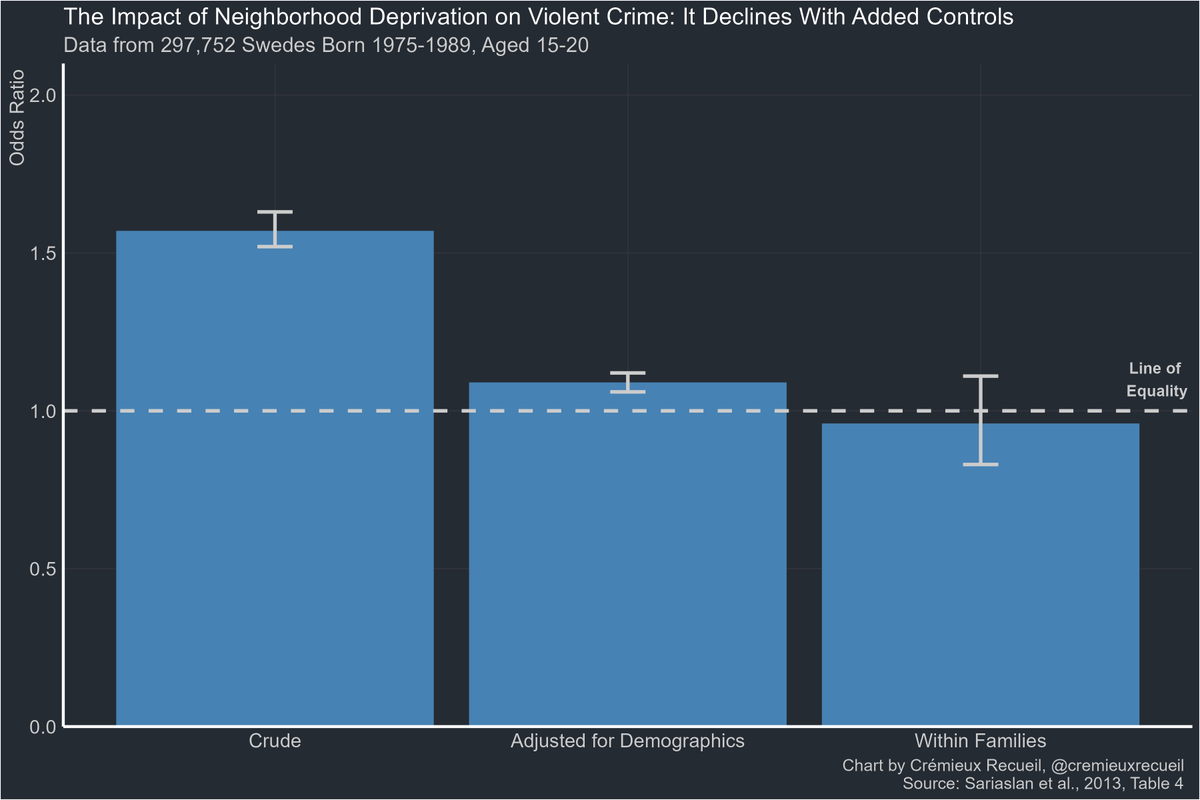
You can even do within-family designs, where siblings with different levels of neighborhood deprivation exposure are compared.
The confounding of the effect of neighborhood deprivation becomes obvious with these designs.
The confounding of the effect of neighborhood deprivation becomes obvious with these designs.
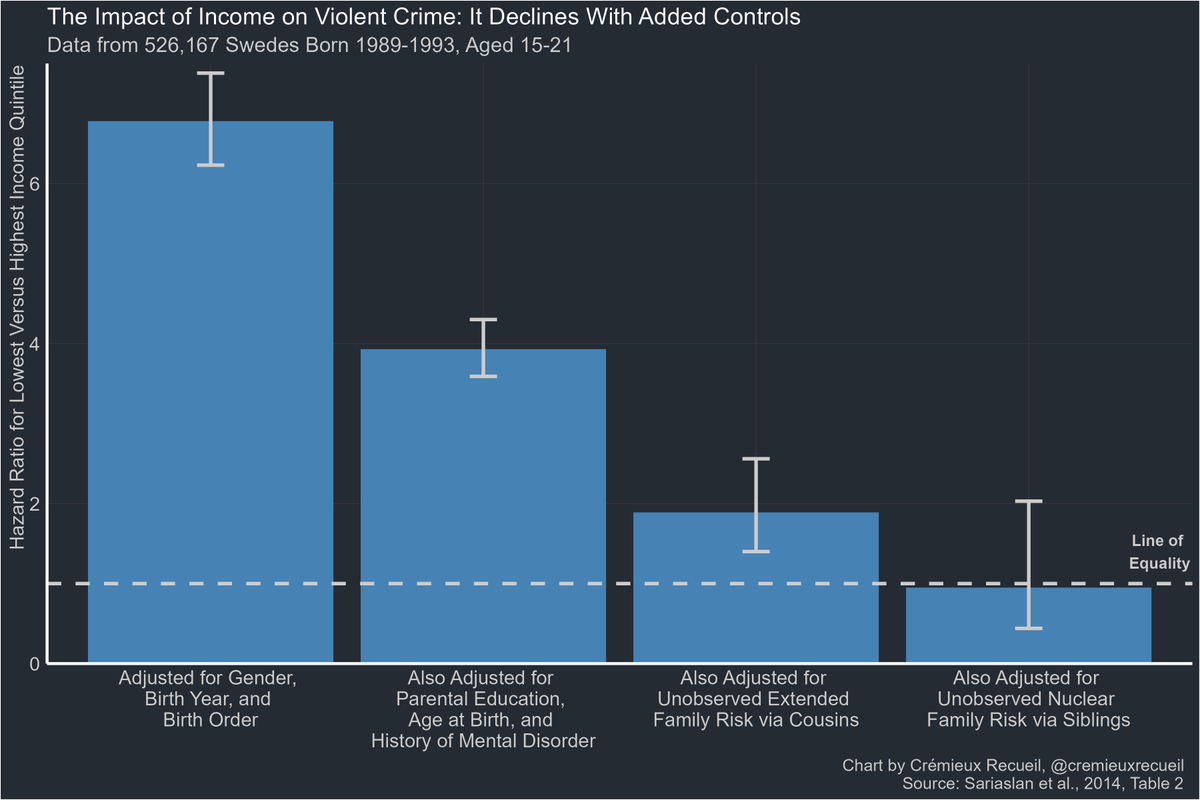
The same method has been applied to family income.
Siblings are exposed to different income levels because they aren't generally the same ages and parents' incomes vary over the lifespan.
So, with big registers, we see the cross-sectional relationship disappears.
Siblings are exposed to different income levels because they aren't generally the same ages and parents' incomes vary over the lifespan.
So, with big registers, we see the cross-sectional relationship disappears.
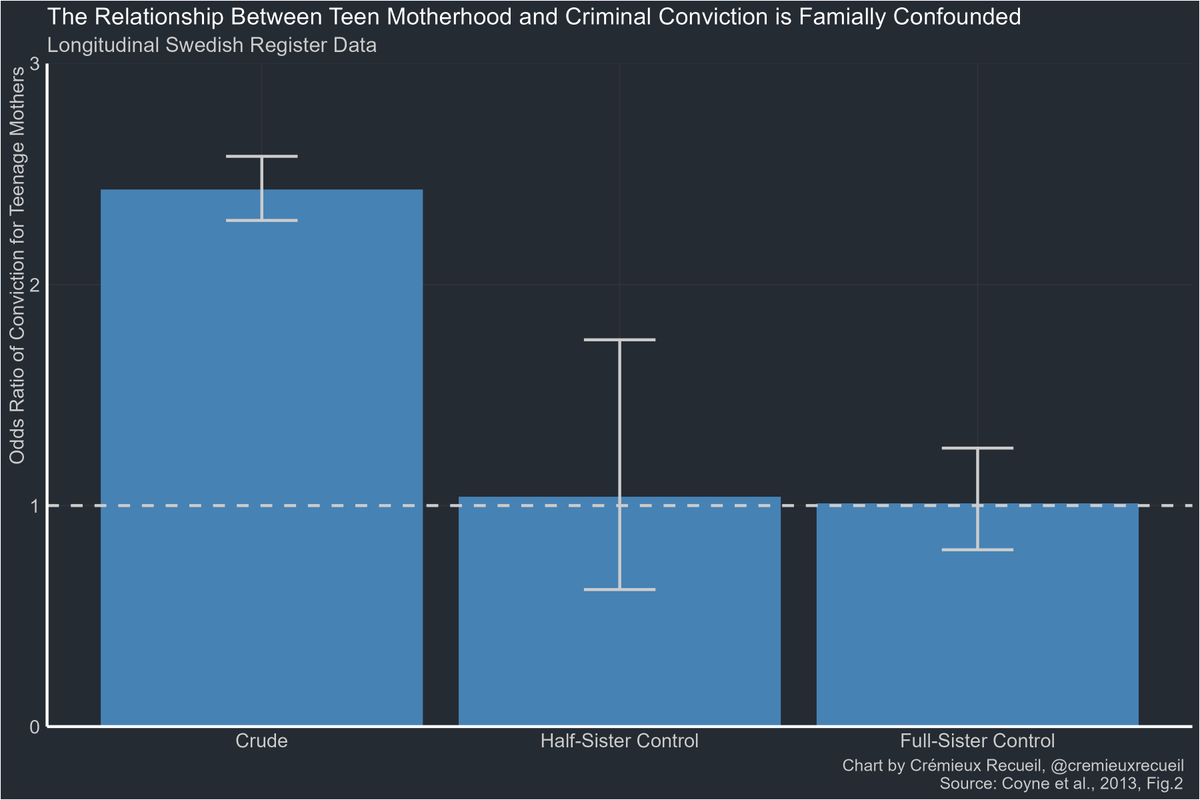
It's not always genetic confounding that matters.
For example, in the case of teen motherhood predicting someone's own criminal conviction, that's due to shared environmental confounding.
For example, in the case of teen motherhood predicting someone's own criminal conviction, that's due to shared environmental confounding.
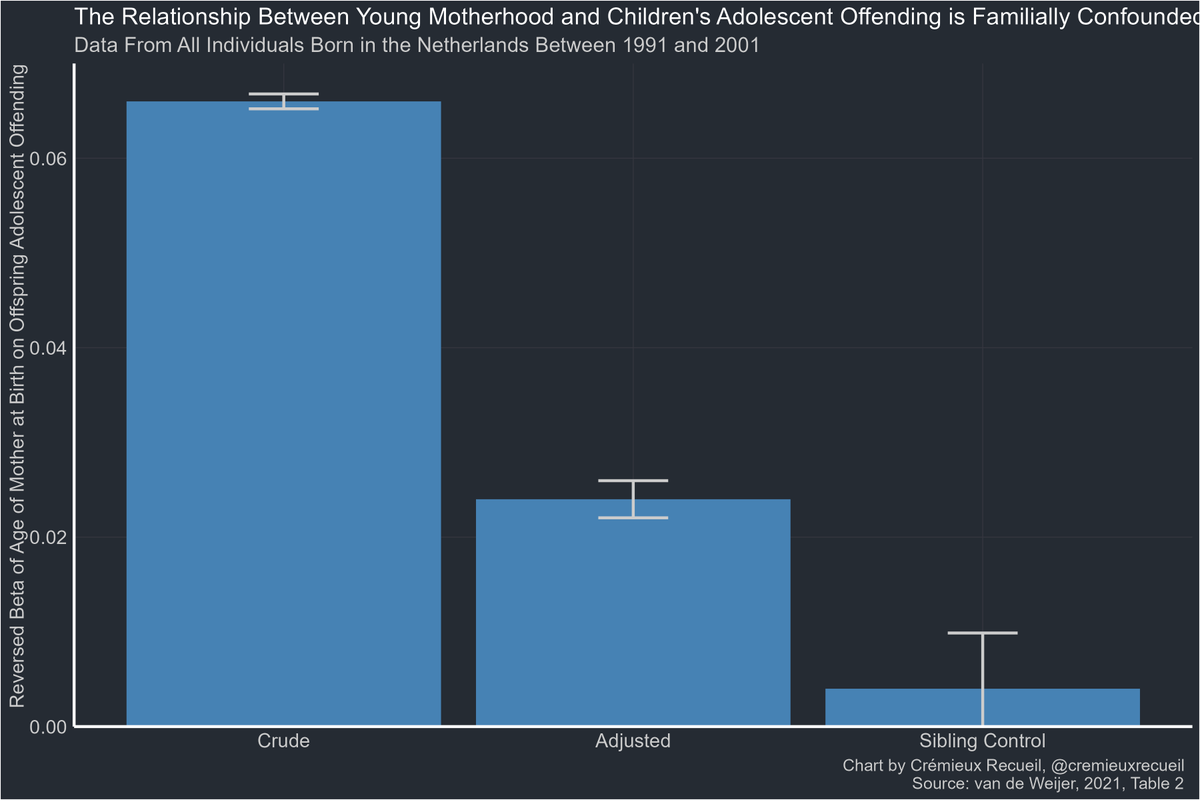
The apparent effect of having a young mother on children's adolescent offending seems to also be driven by familial confounding.
What about when someone has a parent who goes to jail? That's obviously related to socioeconomic status, and some have suggested it's actually good for kids when a bad parent or sibling is arrested.
But there really doesn't seem to be an effect in large studies.
But there really doesn't seem to be an effect in large studies.

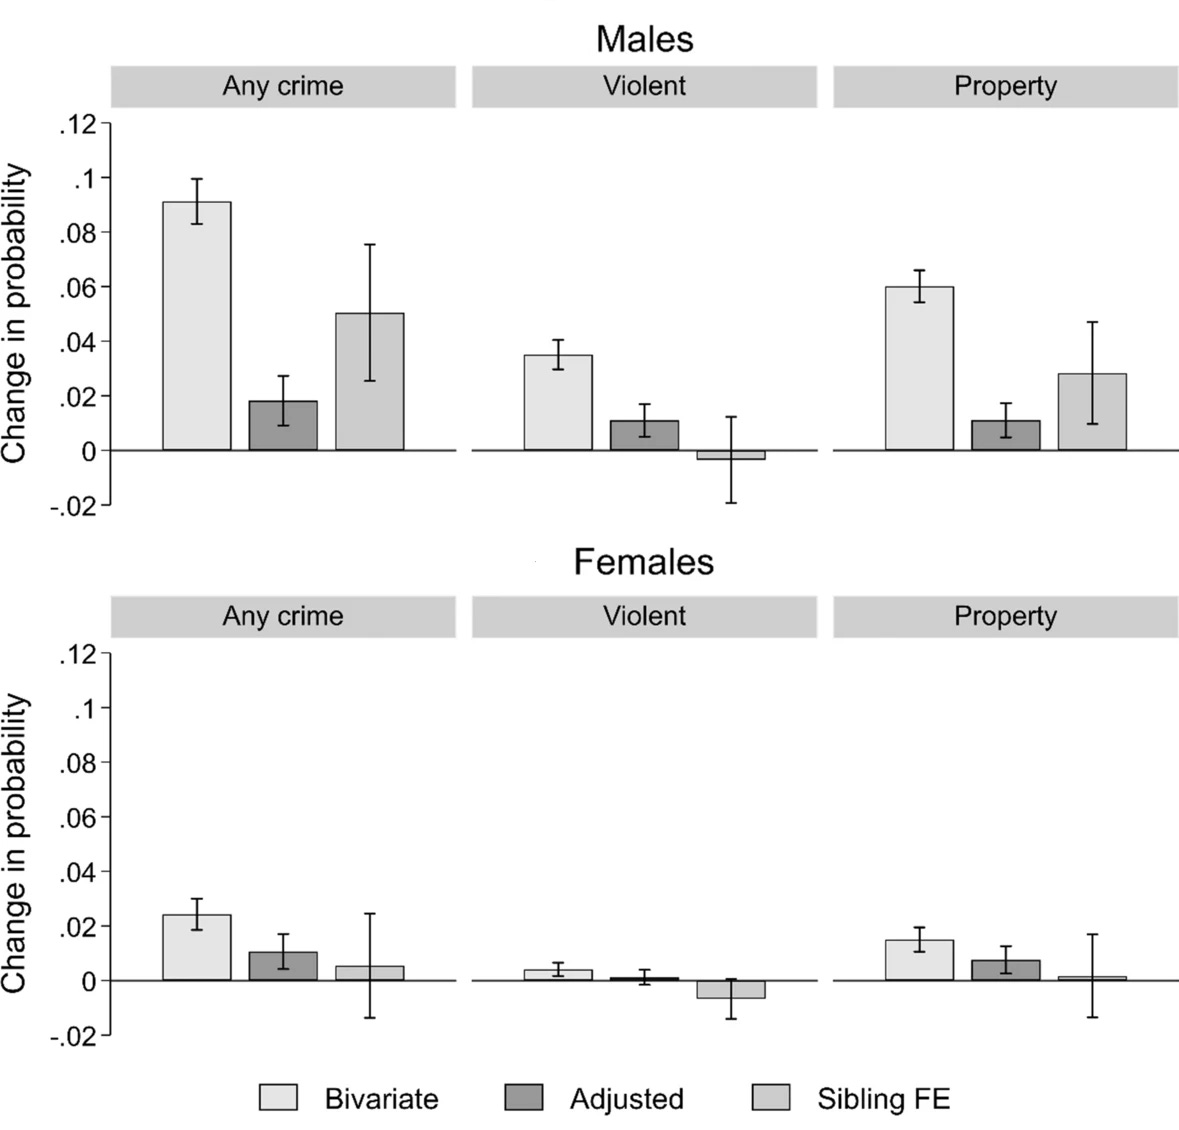
This replicates.
The effect of paternal conviction on the risk of violent crime disappears for men and women, while an effect on property crime remains for males.
The effect of paternal conviction on the risk of violent crime disappears for men and women, while an effect on property crime remains for males.
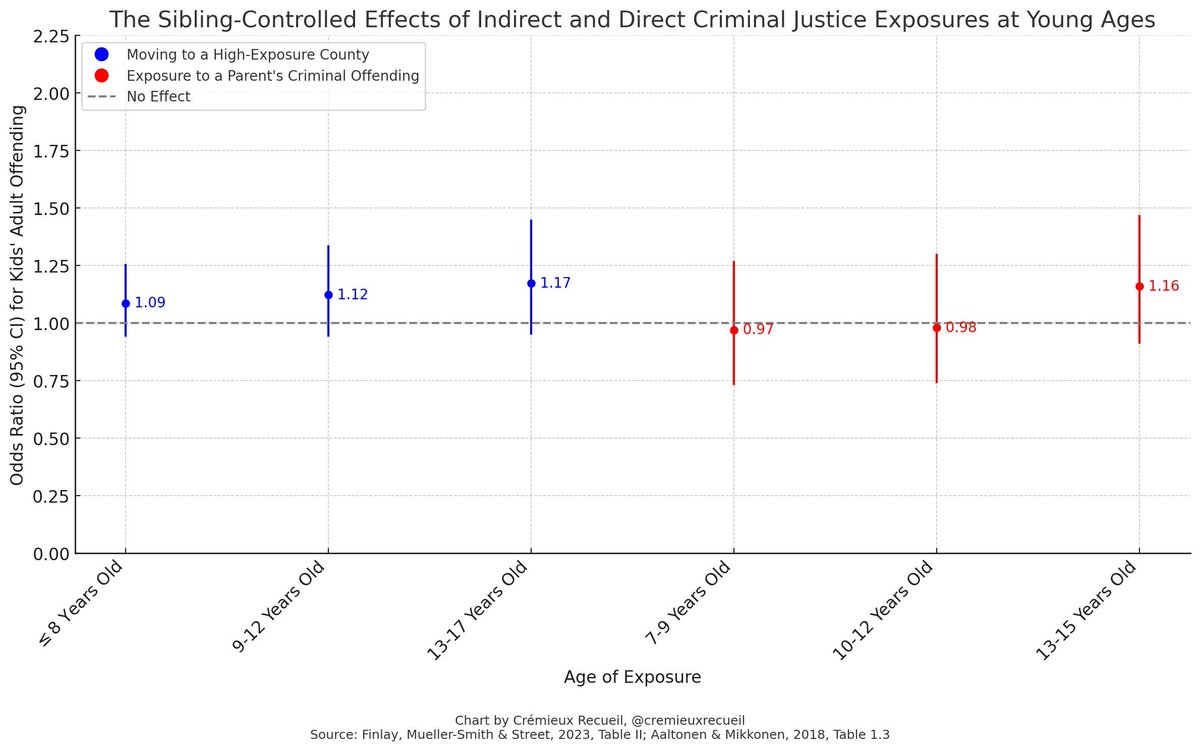
The sibling-controlled effects of many types of other socioeconomic status measures also don't seem relevant.

The effects of exposure to paternal criminal offending (Scandinavia) and high-crime counties (America) are estimated to be similarly low as well.
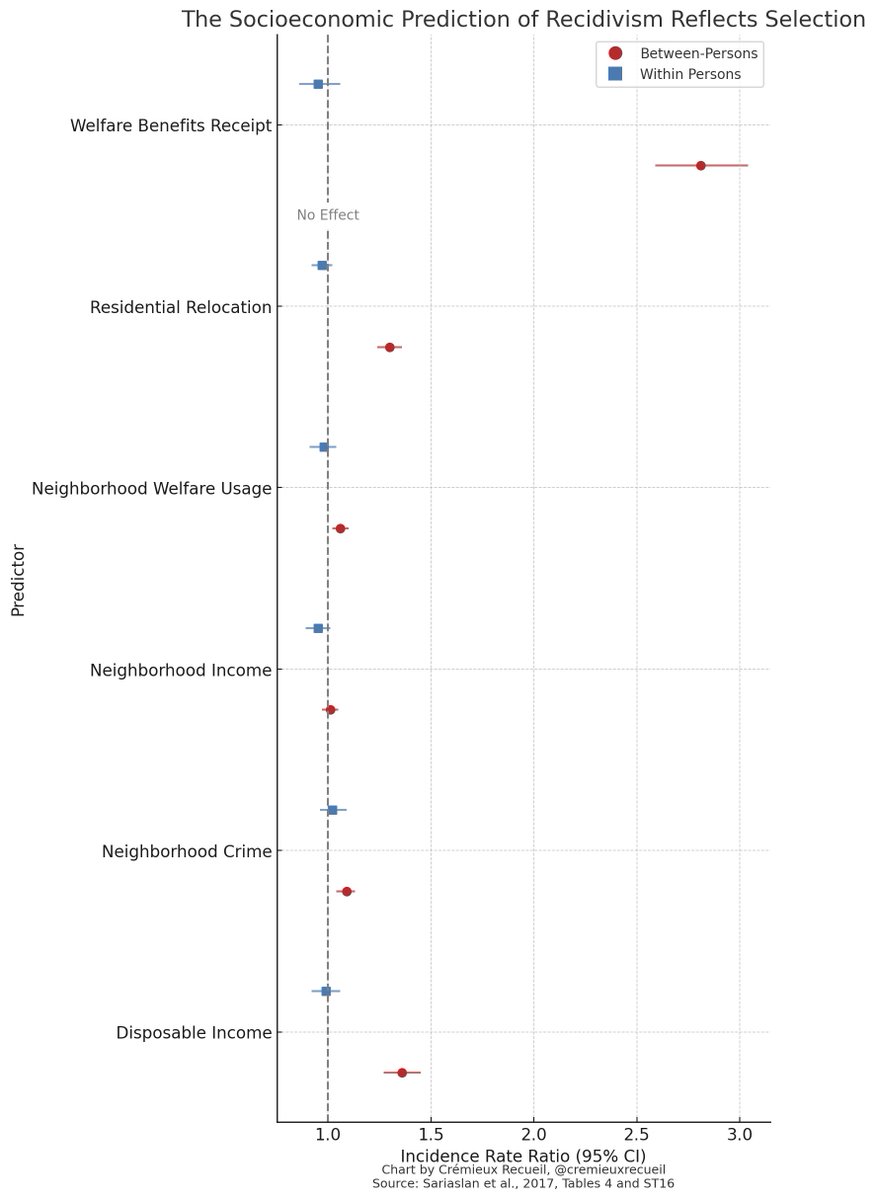
The majority of many types of crime is just recidivism.
Thanks to Scandinavia's monitoring of their population with registers, we also know that recidivism's association with socioeconomic status and neighborhood deprivation is at least majorly driven by self-selection.
Thanks to Scandinavia's monitoring of their population with registers, we also know that recidivism's association with socioeconomic status and neighborhood deprivation is at least majorly driven by self-selection.
The absence of a strong link between poverty and crime is replicable and unsurprising.
Those who believe in a strong link are engaging in what seems to be wishful thinking.
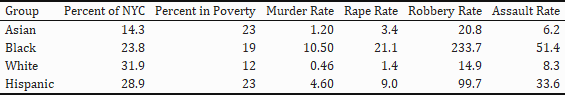
All it takes to really get this is statistics like these.
Those who believe in a strong link are engaging in what seems to be wishful thinking.
All it takes to really get this is statistics like these.
Sources:
The more intensive version of MTO didn't do anything wrt incarceration:
nber.org/papers/w31962
cremieux.xyz/i/118965416/po…
cremieux.xyz/i/103294806/so…
aporiamagazine.com/p/jailbirds-of…
The more intensive version of MTO didn't do anything wrt incarceration:
nber.org/papers/w31962
https://twitter.com/cremieuxrecueil/status/1641509200692928530
https://twitter.com/cremieuxrecueil/status/1641495639459520540
https://twitter.com/cremieuxrecueil/status/1680414312576196609
https://twitter.com/cremieuxrecueil/status/1657127171373117440
https://twitter.com/cremieuxrecueil/status/1668514274178654210
https://twitter.com/cremieuxrecueil/status/1661894011831869441
cremieux.xyz/i/118965416/po…
cremieux.xyz/i/103294806/so…
aporiamagazine.com/p/jailbirds-of…
• • •
Missing some Tweet in this thread? You can try to
force a refresh