Crémieux Profile picture
Dec 19 2 tweets 1 min read Twitter logo Read on Twitter
Increasingly many people report not feeling free to speak their minds.

This is more common among more conservative people.
Image
Image

• • •

Missing some Tweet in this thread? You can try to force a refresh

 

Keep Current with Crémieux

Crémieux Profile picture

Stay in touch and get notified when new unrolls are available from this author!

Read all threads

This Thread may be Removed Anytime!

PDF

Twitter may remove this content at anytime! Save it as PDF for later use!

Try unrolling a thread yourself!

how to unroll video
  1. Follow @ThreadReaderApp to mention us!

  2. From a Twitter thread mention us with a keyword "unroll"
@threadreaderapp unroll

Practice here first or read more on our help page!

More from @cremieuxrecueil

Dec 19
Poverty and crime.

In the public imagination, these things go hand-in-hand.

But the link between poverty and crime is much weaker than people might imagine. It might not even be causal.

A new lottery study shows us just that:

🧵 Image
To understand the causes of crime, there are other things you need to understand first.

For example, you need to understand the roles of sex and age.

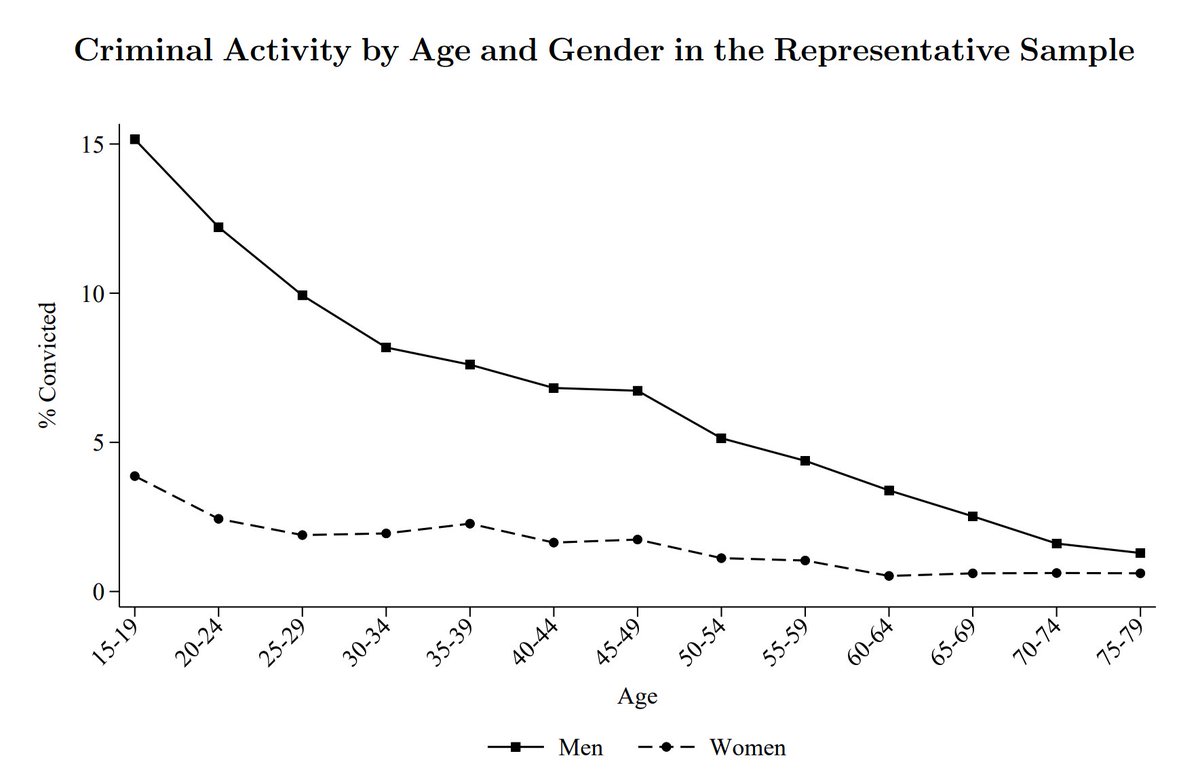
In the whole country the lottery study results came from, you get this result when you plot both variables. Image
The collapse in criminal offending from adolescence is the crux of the "age-crime curve". The gap between men and women that declines with age is another important part.

Unlike age and crime, income and crime are nonlinearly related: after a certain level, income barely matters. Image
Read 25 tweets
Dec 17
The ACT has released their scores for 2023, so I thought I'd put everything in familiar terms and make some plots.

This thread will include lots of pictures!

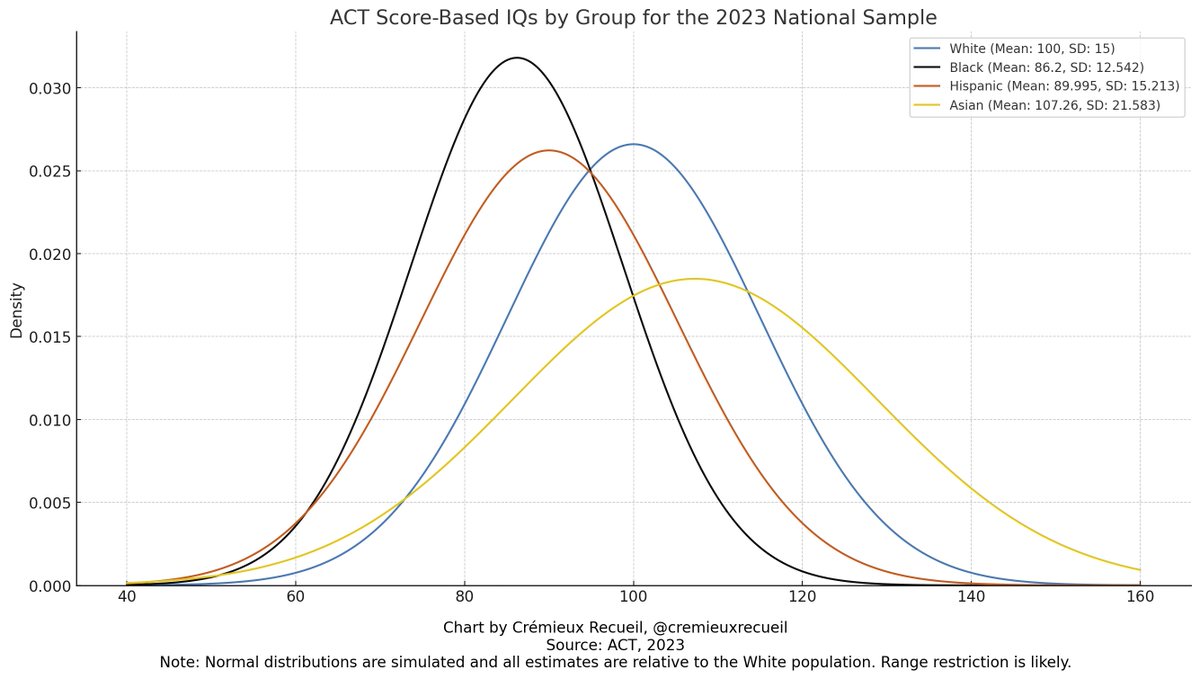
So, how did everyone do nationally? Image
Differences were fairly typical.

Assuming Whites had a mean of 100 and an SD of 15

- Asians had a mean of 107.26 and an SD of 21.58
- Blacks had a mean of 86.20 and an SD of 12.54
- Hispanics had a mean of 90 and an SD of 15.21

Here are their scaled densities: Image
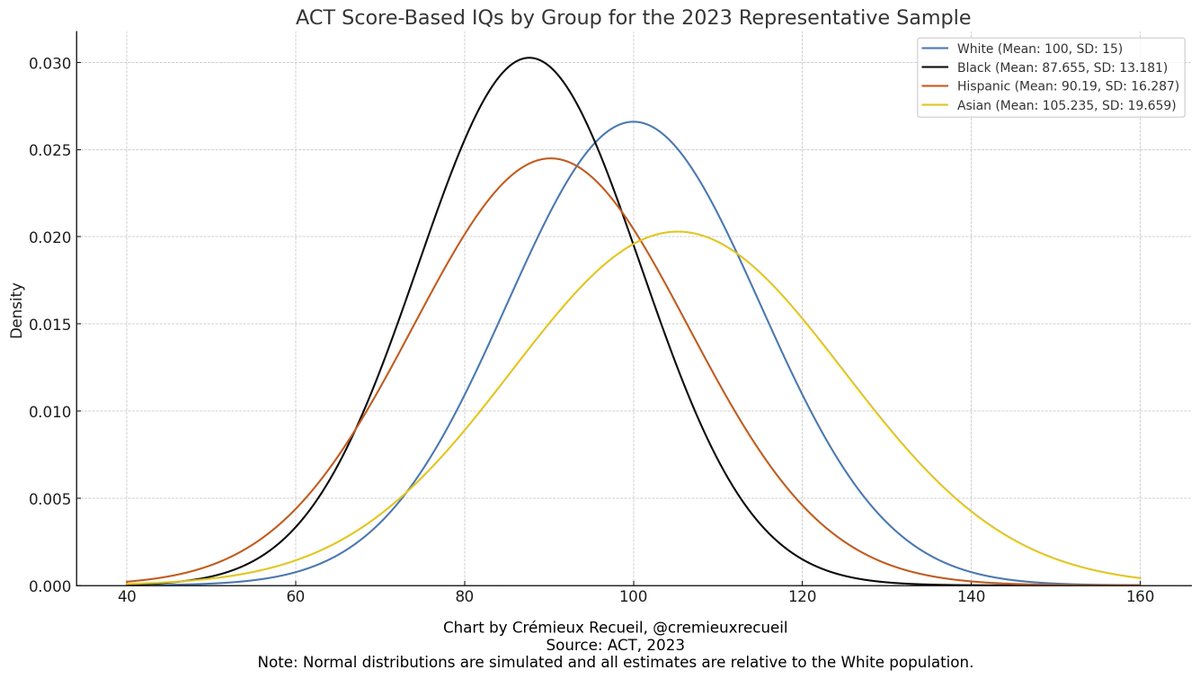
But we know that state-level participation rates and scores are correlated, so taking the ACT is selective.

However, in a few states, every kid took the ACT. These were Alabama, Kentucky, Louisiana, Mississippi, Nevada, Oklahoma, Tennessee, and Wyoming.

So, how did they do? Image
Read 17 tweets
Dec 16
What happens when you assign groups of people to

- Exercise without steroids
- Exercise with steroids
- Not exercise without steroids
- Not exercise with steroids

The guys who take steroids and don't exercise gain more muscle than the guys who exercise without steroids!Image
The above is the familiar outcome from this study. But they measured more things than just fat-free mass gains.

For example, they also measured bench presses.

People who exercised without steroids gained about the same amount as people who didn't exercise, with steroids. Image
Squats were also measured, and in that one, the people who exercised beat the people who didn't exercise but did take steroids, but both beat the ones who neither exercised nor took roids. Image
Read 7 tweets
Dec 9
The effect of adding together normal distributions is unintuitive.

If there's a 1 d difference between two groups with equal variances, you might think the result would be a bimodal distribution.

You would be wrong.

Short🧵 Image
So if we widen the gap, say, to 2 d, then we get a distribution that looks rather flat.

Even though the groups were strongly differentiated, the result of throwing them together still wasn't. Image
Once we make the difference very large, say, 3 d, that's when we finally get to a bimodal combined distribution. Image
Read 8 tweets
Dec 7
December 7th, a day that will live in infamy, is the day Japan decided to ensure the Axis Powers would lose World War II.

Prior to today's date, many Americans were wishy-washy on joining the war, but Japan changed their tune.

Let's go through the timeline, starting with Sept.: Image
Initially, America seems narrowly against getting involved.

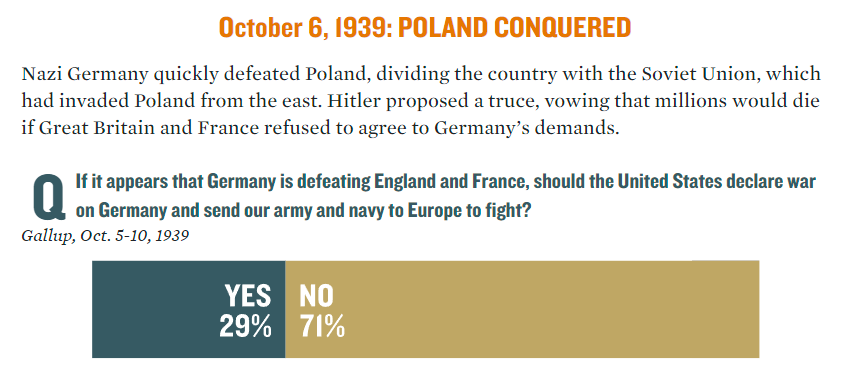
After Poland fell, sentiment shifted strongly against involvement. Image
The nadir of American sentiment was when the airwaves became flooded with news about German assaults on the Netherlands, Belgium, and France.

America wanted nothing to do with the war. Image
Read 13 tweets
Dec 6
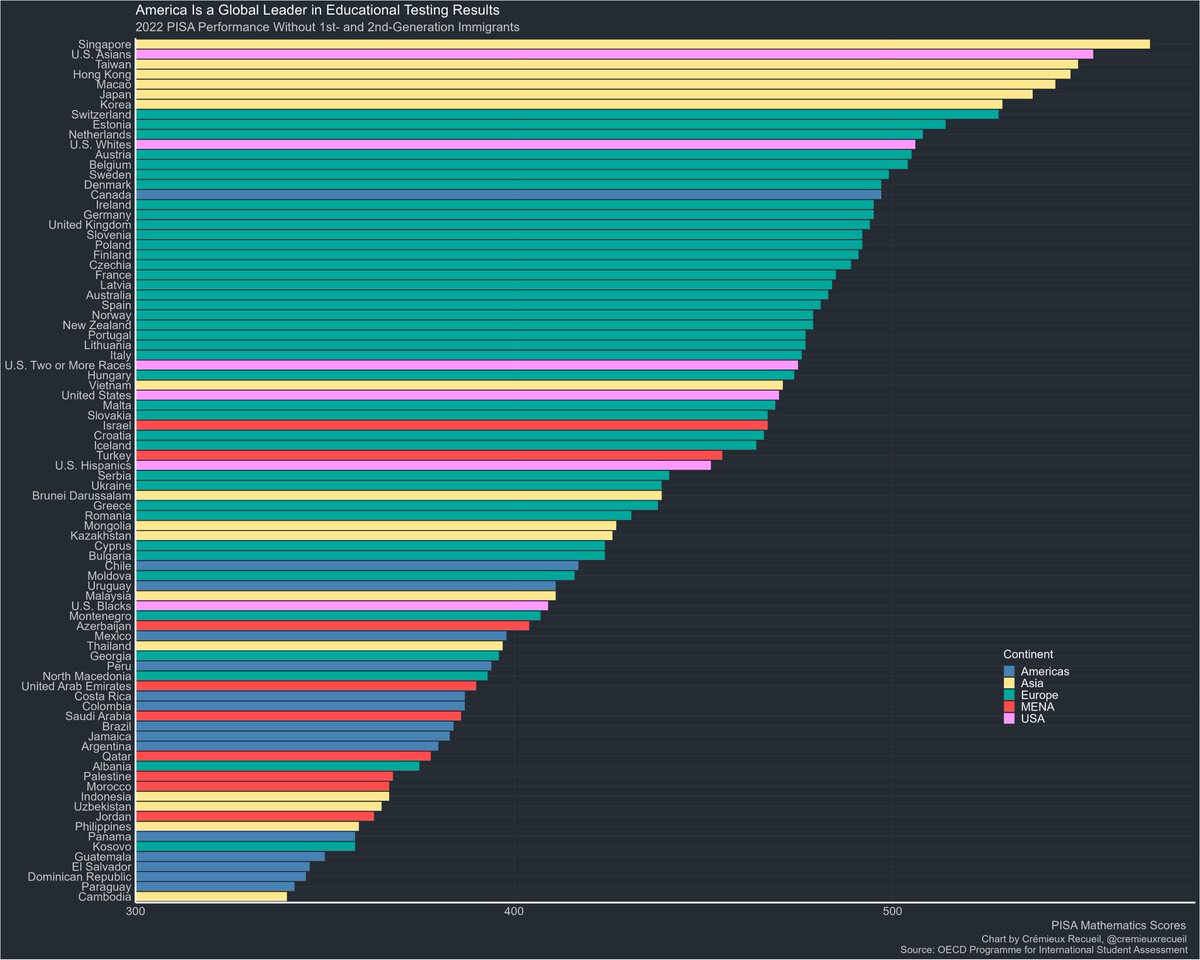
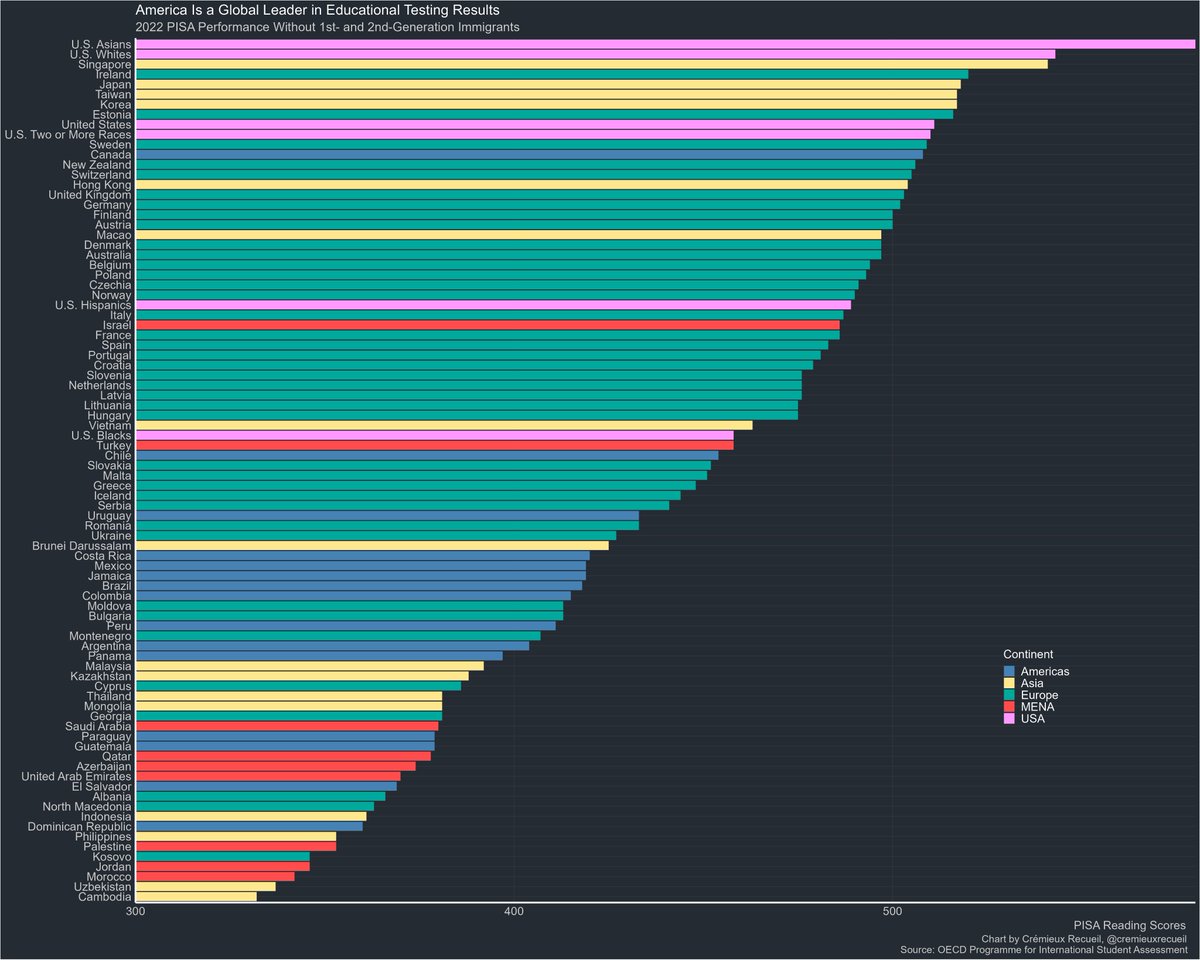
Do European countries appear to perform worse than White Americans in standardized tests because of low-performing immigrants?

Probably not. Removing 1st- and 2nd-generation immigrants from the 2022 PISA sample, America still outperforms.

🧵

First, mean scores: Image
Now, let's take a look at mathematics scores.

The Netherlands did jump ahead of American Whites here, but that's about it. Notably, U.S. Asians jumped from 4th to 2nd place! Image
What about reading? That should be the most impacted, since immigrants are language learners.

While true, this also impacted U.S. Whites. I assume this is due to "White Hispanics" who are English second-language learners, but it's hard to tell. Image
Read 7 tweets

Did Thread Reader help you today?

Support us! We are indie developers!


This site is made by just two indie developers on a laptop doing marketing, support and development! Read more about the story.

Become a Premium Member ($3/month or $30/year) and get exclusive features!

Become Premium

Don't want to be a Premium member but still want to support us?

Make a small donation by buying us coffee ($5) or help with server cost ($10)

Donate via Paypal

Or Donate anonymously using crypto!

Ethereum

0xfe58350B80634f60Fa6Dc149a72b4DFbc17D341E copy

Bitcoin

3ATGMxNzCUFzxpMCHL5sWSt4DVtS8UqXpi copy

Thank you for your support!

Follow Us on Twitter!

:(