⭐ Time Series is an essential skill in Data Science.
You don't know where to start?
Here you have a roadmap for you to start on the right foot!
Have a look 👇 🧵
You don't know where to start?
Here you have a roadmap for you to start on the right foot!
Have a look 👇 🧵

1️⃣ Statistical Models:
• ARIMA: Handles trend and seasonality with autoregressive, moving average components.
• ETS: Exponential smoothing models capturing error, trend, and seasonality for forecasting time series data.
• ARIMA: Handles trend and seasonality with autoregressive, moving average components.
• ETS: Exponential smoothing models capturing error, trend, and seasonality for forecasting time series data.
2️⃣ Decomposition Models:
• STL (Seasonal-Trend decomposition using LOESS): Robust decomposition method emphasizing local patterns.
• Prophet: Intuitive model accommodating holidays and special events for accurate time series forecasting.
• STL (Seasonal-Trend decomposition using LOESS): Robust decomposition method emphasizing local patterns.
• Prophet: Intuitive model accommodating holidays and special events for accurate time series forecasting.
3️⃣ ML Models:
• Random Forest: Ensemble method leveraging decision trees for robust predictions.
• XGBoost: algorithm with regularization for improved accuracy and efficiency.
• SVM: Non-linear model for time series forecasting, excelling in high-dimensional spaces.
• Random Forest: Ensemble method leveraging decision trees for robust predictions.
• XGBoost: algorithm with regularization for improved accuracy and efficiency.
• SVM: Non-linear model for time series forecasting, excelling in high-dimensional spaces.
4️⃣ Neural Network Methods:
• LSTM (Long Short-Term Memory): RNNs capturing long-range dependencies.
• GRU (Gated Recurrent Unit): RNN variant balancing model complexity and efficiency.
• CNN (Convolutional Neural Network): Extracts temporal features through convolution.
• LSTM (Long Short-Term Memory): RNNs capturing long-range dependencies.
• GRU (Gated Recurrent Unit): RNN variant balancing model complexity and efficiency.
• CNN (Convolutional Neural Network): Extracts temporal features through convolution.
5️⃣ Advanced Models:
• Gaussian Processes: Probabilistic model capturing uncertainty.
• TCN (Temporal Convolutional Network): Leverages convolutional layers for parallelized temporal modeling.
• Transformers: Attention-based architecture handling sequences with global context.
• Gaussian Processes: Probabilistic model capturing uncertainty.
• TCN (Temporal Convolutional Network): Leverages convolutional layers for parallelized temporal modeling.
• Transformers: Attention-based architecture handling sequences with global context.
Being aware of these models will allow you to start your path to mastering Time Series Analysis and Forecasting!
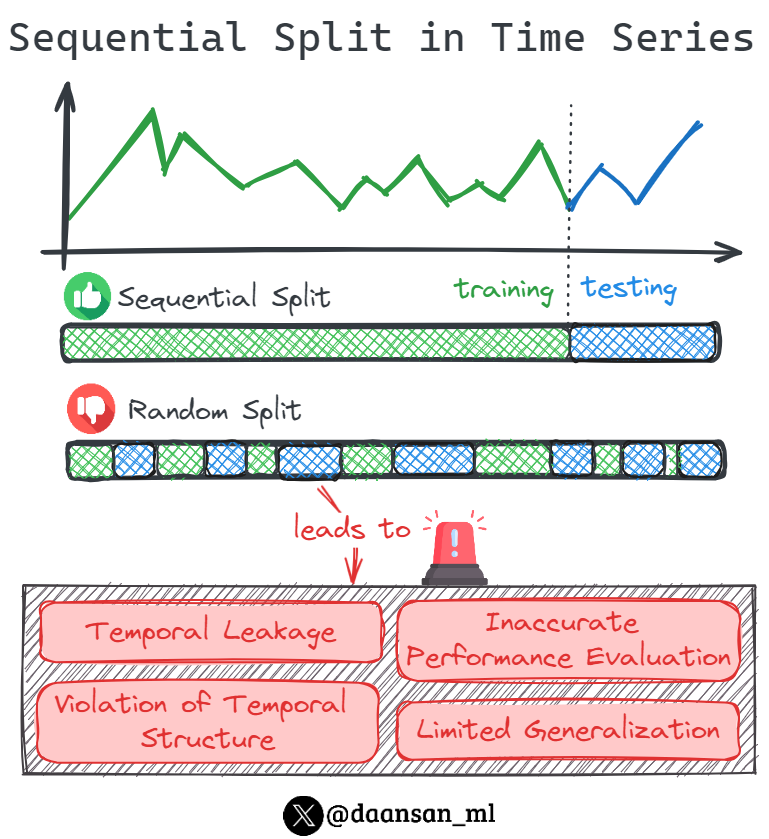
But Time Series is not just about models... The processing and evaluation stages are critical here!
But Time Series is not just about models... The processing and evaluation stages are critical here!
Join more than 4k 💊MLPills subscribers and enjoy free Machine Learning and Data Science content straight to your email every Thursday!
mlpills.dev/subscribe/
mlpills.dev/subscribe/
You should also join our newsletter, DSBoost🚀
Every week we share:
🔹Interviews
🔹Podcast notes
🔹Learning resources
🔹Interesting collections of content
Subscribe for free👇👇
dsboost.dev
Every week we share:
🔹Interviews
🔹Podcast notes
🔹Learning resources
🔹Interesting collections of content
Subscribe for free👇👇
dsboost.dev
• • •
Missing some Tweet in this thread? You can try to
force a refresh