Struggling with Machine Learning algorithms? 🤖
Then you better stay with me! 🤓
Today we'll focus on the Simple Linear Regression Cost Function! 👇🏻
Then you better stay with me! 🤓
Today we'll focus on the Simple Linear Regression Cost Function! 👇🏻
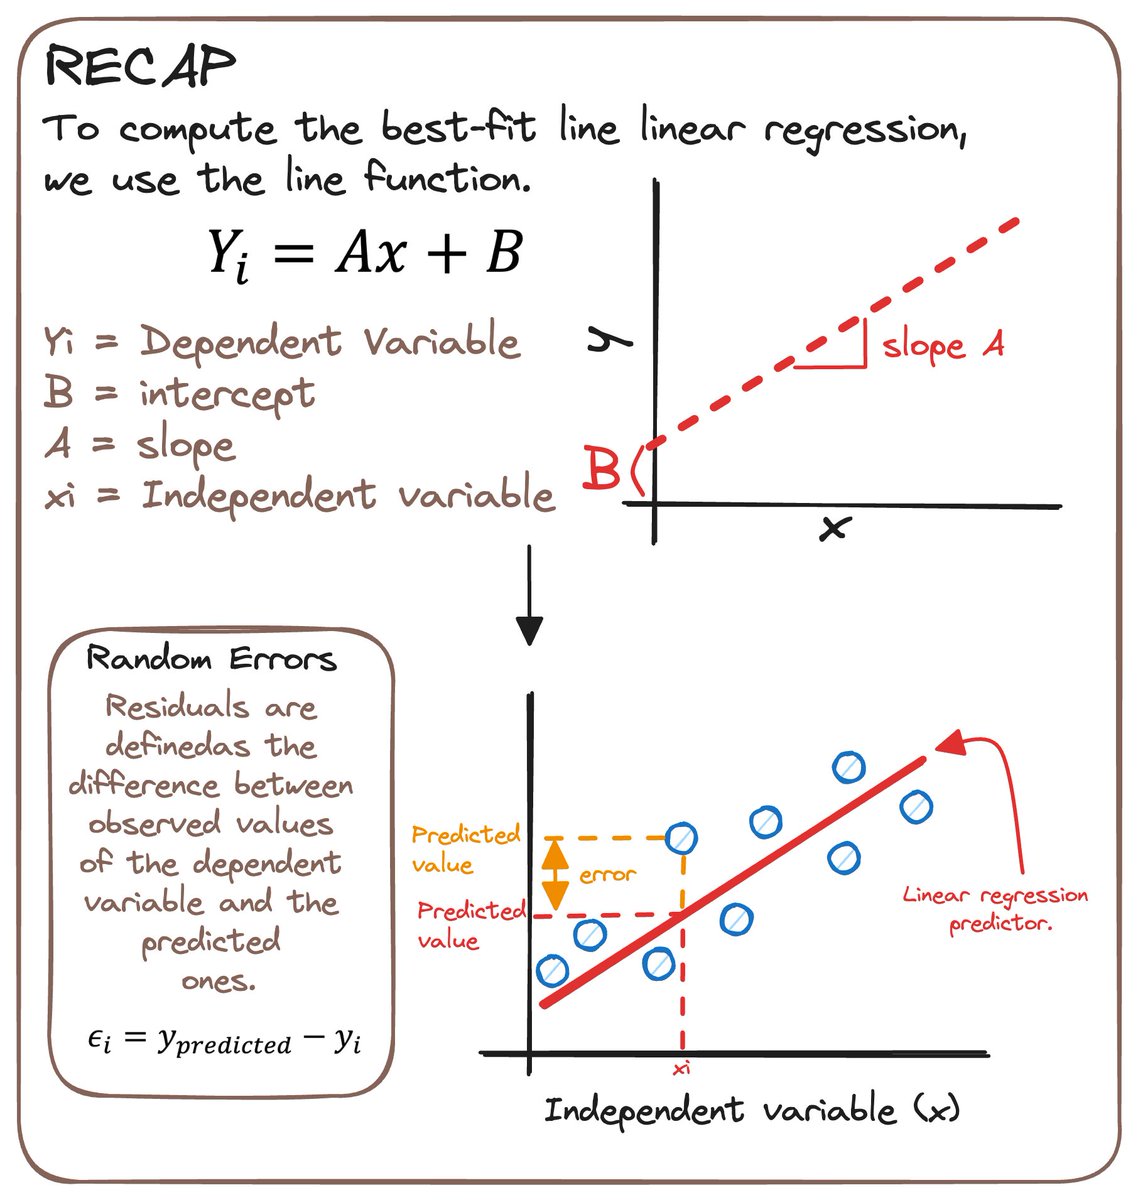
0️⃣ 𝗥𝗘𝗖𝗔𝗣
In Simple Linear Regression, we use one independent variable to predict a dependent one.
It takes advantage of a line to calculate the slope (A) and intercept (B)
We need:
- A dependent and an independent variable.
- A linear dependency between them.
In Simple Linear Regression, we use one independent variable to predict a dependent one.
It takes advantage of a line to calculate the slope (A) and intercept (B)
We need:
- A dependent and an independent variable.
- A linear dependency between them.
1️⃣ 𝗪𝗛𝗔𝗧 𝗜𝗦 𝗔 𝗖𝗢𝗦𝗧 𝗙𝗨𝗡𝗖𝗧𝗜𝗢𝗡?
A cost function helps us work out the optimal values for A and B.
Understand it as a way to find the optimal values for our predictor.
A cost function helps us work out the optimal values for A and B.
Understand it as a way to find the optimal values for our predictor.
2️⃣ 𝗛𝗢𝗪 𝗗𝗢 𝗪𝗘 𝗢𝗕𝗧𝗔𝗜𝗡 𝗜𝗧 𝗠𝗔𝗧𝗛𝗘𝗠𝗔𝗧𝗜𝗖𝗔𝗟𝗟𝗬?
In linear regression, this cost function is Mean Squared Errors (MSE).
It is the average of the squared errors.
In linear regression, this cost function is Mean Squared Errors (MSE).
It is the average of the squared errors.

✚ 𝗕𝗢𝗡𝗨𝗦
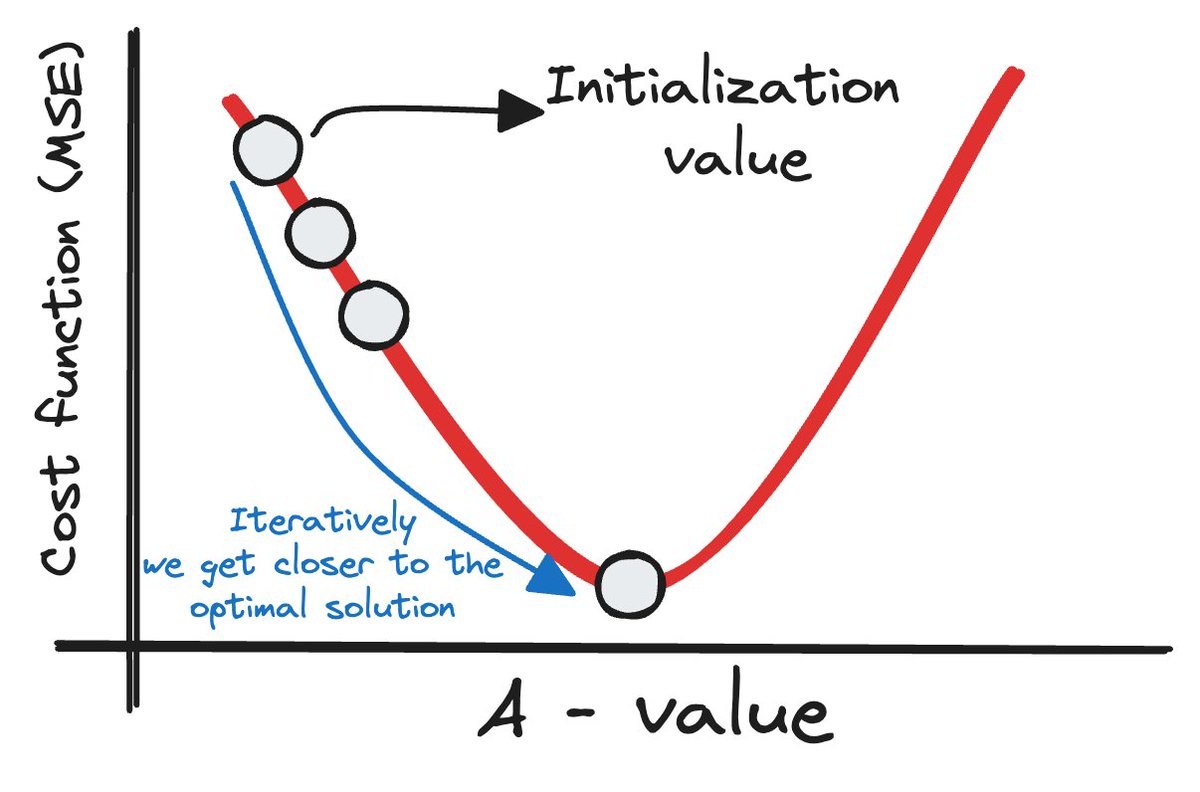
To find our optimal solutions, we use the gradient descent.
It is one of the optimization algorithms that optimizes the cost function.
To obtain the optimal solution, we need to reduce MSE for all data points.
Iteratively we get closer to the optimal solution.
To find our optimal solutions, we use the gradient descent.
It is one of the optimization algorithms that optimizes the cost function.
To obtain the optimal solution, we need to reduce MSE for all data points.
Iteratively we get closer to the optimal solution.

3️⃣ 𝗘𝗩𝗔𝗟𝗨𝗔𝗧𝗜𝗢𝗡
The most used metrics are:
- Coefficient of Determination or R-Squared (R2)
- Root Mean Squared Error (RMSE)
The most used metrics are:
- Coefficient of Determination or R-Squared (R2)
- Root Mean Squared Error (RMSE)

4️⃣ 𝗔𝗦𝗦𝗨𝗠𝗣𝗧𝗜𝗢𝗡𝗦 𝗧𝗢 𝗔𝗣𝗣𝗟𝗬 𝗜𝗧
Linear Regression isn't just about drawing lines.
It assumes certain conditions like linearity, independence, and normal distribution of residuals.
Ensuring these make our model more reliable.
Linear Regression isn't just about drawing lines.
It assumes certain conditions like linearity, independence, and normal distribution of residuals.
Ensuring these make our model more reliable.

And this is all for now... I'll be posting the whole theory part next Sunday, so stay tuned! 🤓
Linear Regression is more than just a statistical method.
It's the simplest tool that helps us predict and understand our world better.
Linear Regression is more than just a statistical method.
It's the simplest tool that helps us predict and understand our world better.
And that's all for now
If you liked this thread, I am sharing Data Science and AI content.
So don't forget to follow me to get more content like this! (@rfeers)
RT the tweet below to help me share the word! :D
If you liked this thread, I am sharing Data Science and AI content.
So don't forget to follow me to get more content like this! (@rfeers)
RT the tweet below to help me share the word! :D
https://twitter.com/rfeers/status/1737760242618818852
• • •
Missing some Tweet in this thread? You can try to
force a refresh