
Data Scientist & Tech Writer @KDnuggets @DataCamp @Medium
| Outstand using data |
Join 8k data professionals on https://t.co/VdsUvb9SKu 🧩
How to get URL link on X (Twitter) App

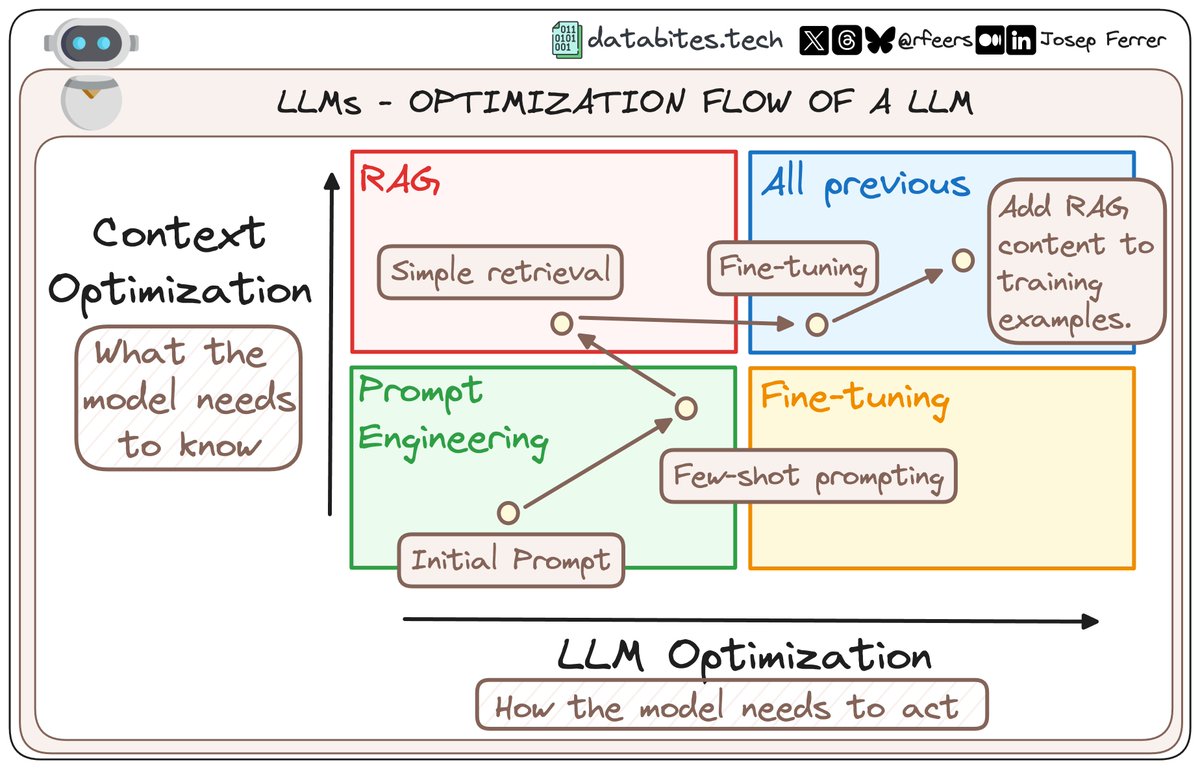
 Creating an LLM demo is a breeze.
 1️⃣ 𝗗𝗔𝗧𝗔 𝗚𝗔𝗧𝗛𝗘𝗥𝗜𝗡𝗚 𝗣𝗛𝗔𝗦𝗘


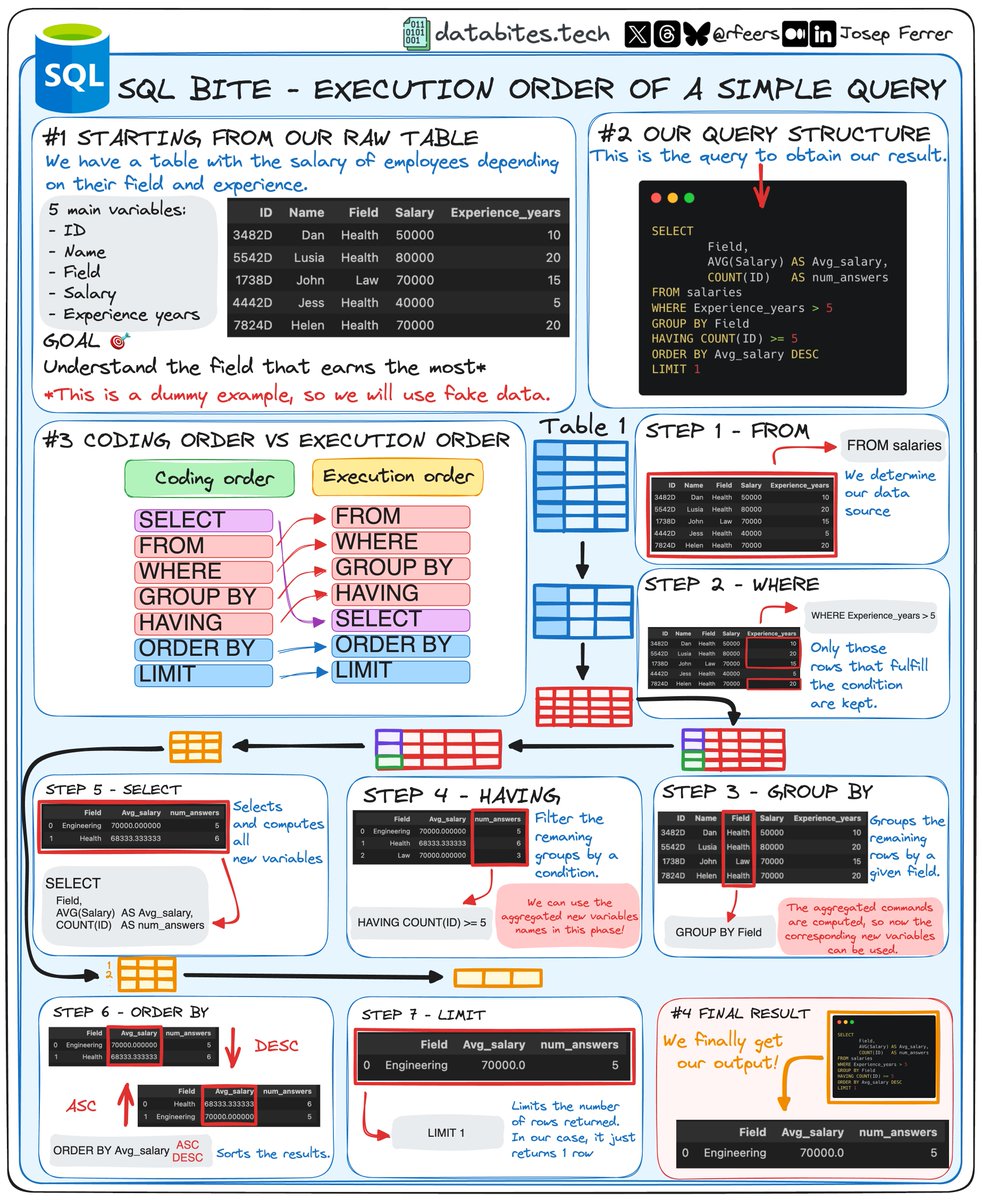
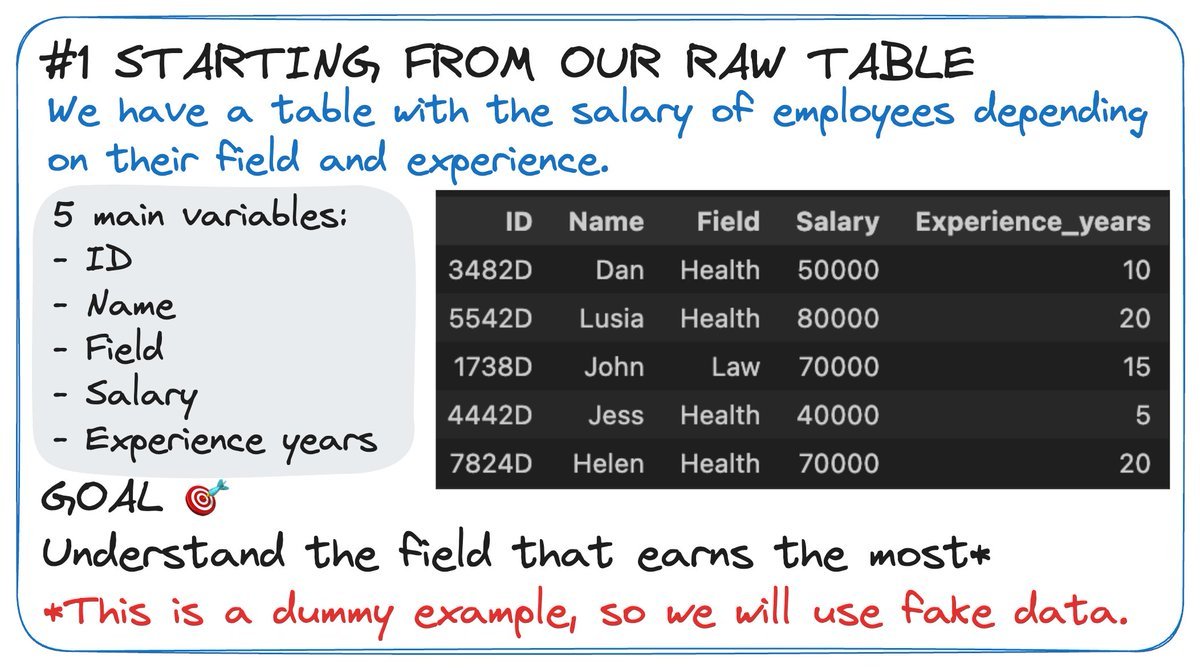
 1️⃣ 𝗦𝗧𝗔𝗥𝗧𝗜𝗡𝗚 𝗙𝗥𝗢𝗠 𝗢𝗨𝗥 𝗥𝗔𝗪 𝗧𝗔𝗕𝗟𝗘

 1️⃣ 𝗪𝗵𝗮𝘁 𝗶𝘀 𝗚𝗲𝗼𝘀𝗽𝗮𝘁𝗶𝗮𝗹 𝗗𝗮𝘁𝗮?

 1. 𝗟𝗲𝗮𝗿𝗻𝗶𝗻𝗴 𝘁𝗵𝗲 𝗕𝗮𝘀𝗶𝗰𝘀
 Charts are composed of two core components:
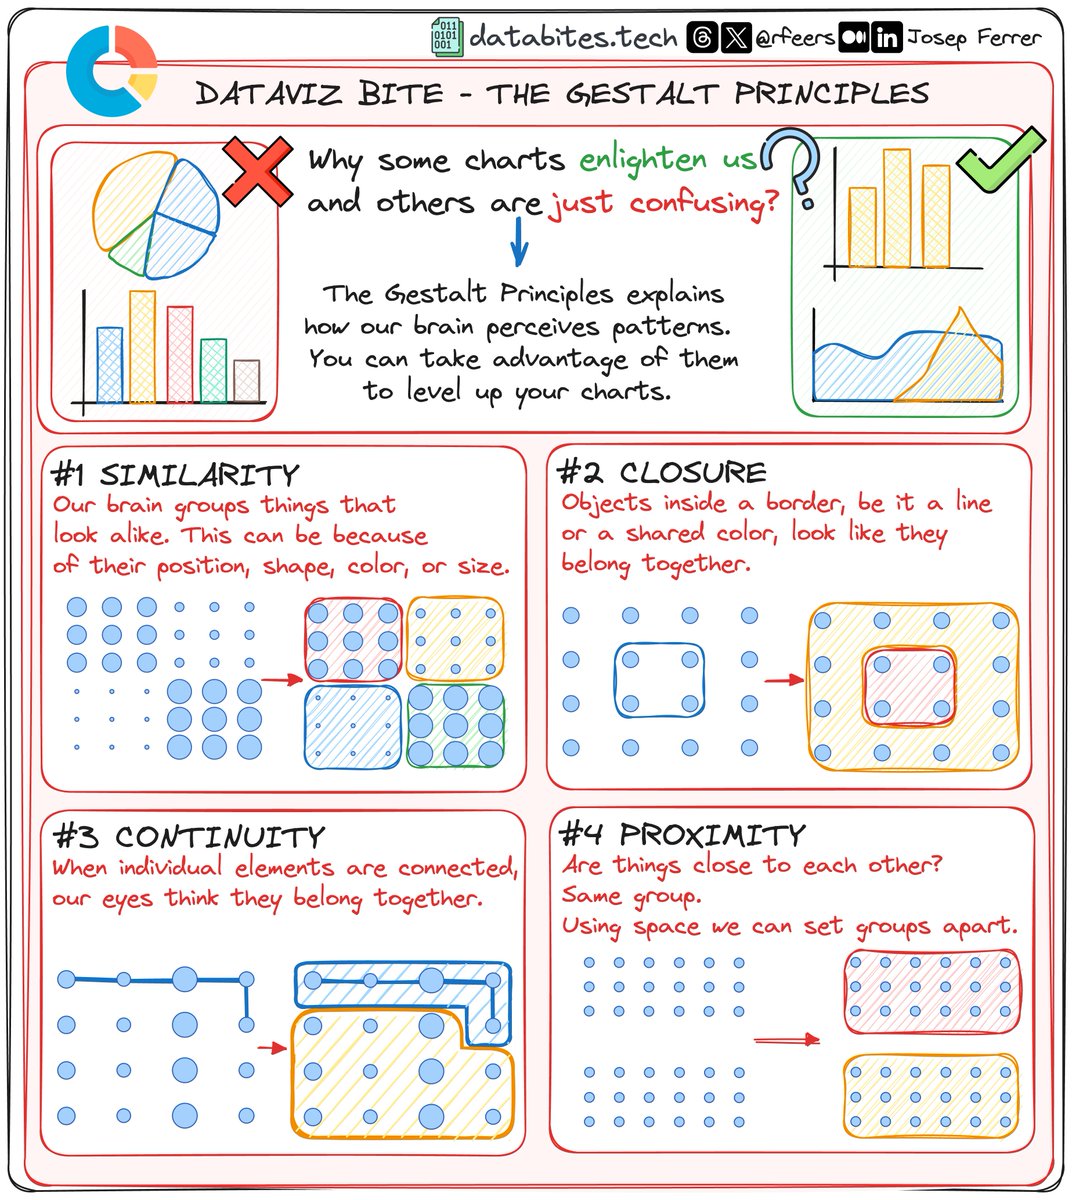
 Think of DataViz as your GPS in the world of numbers.
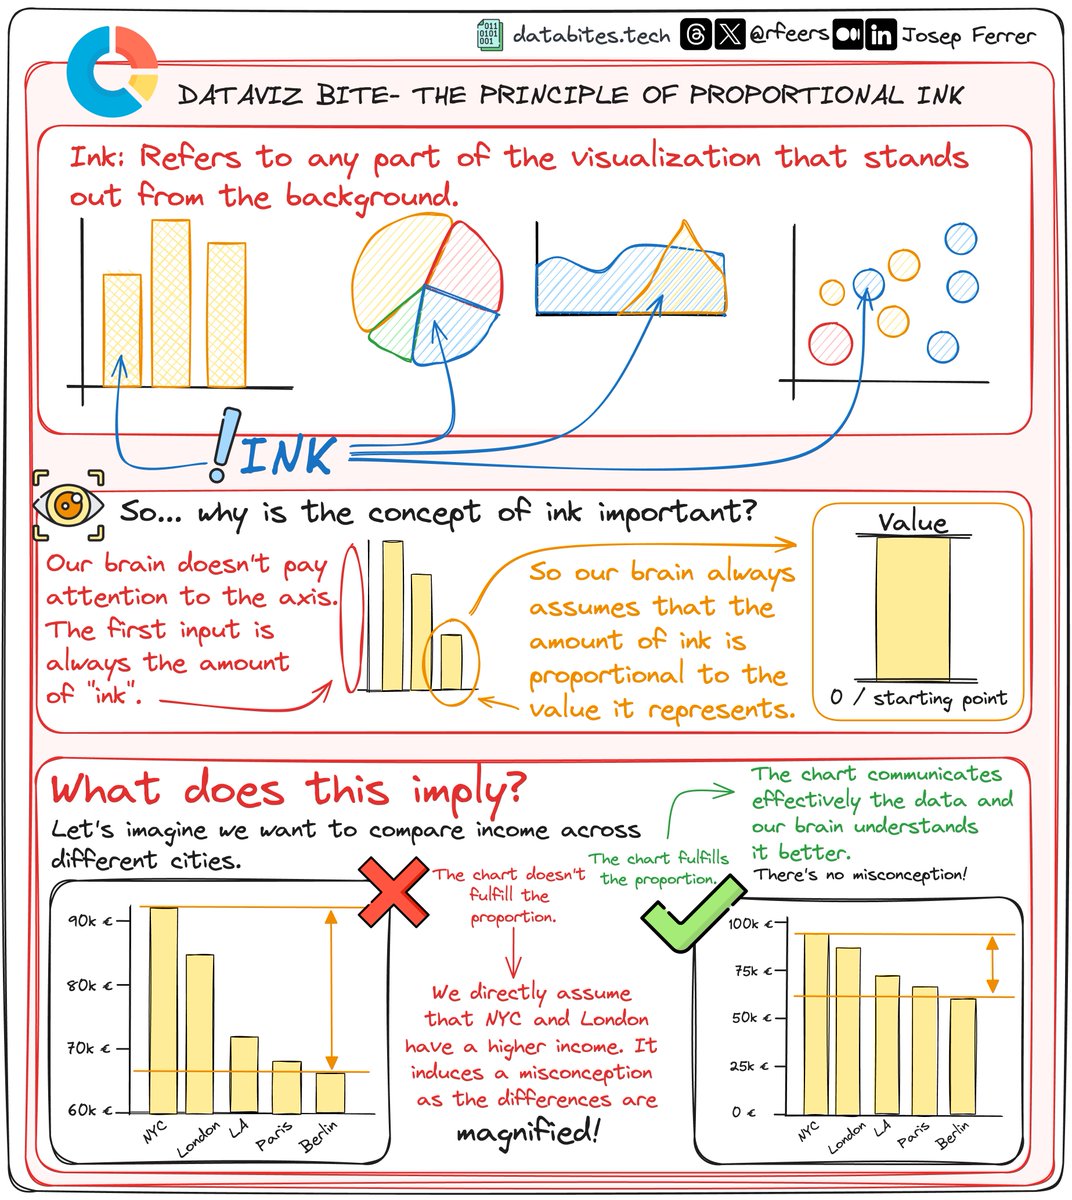
 First things first, ever heard of the term "ink" in data visualization?