As COVID transmission spikes, you may have opportunities to raise awareness about #LongCOVID.
These are a few of the the most popular videos I've shared that people found useful. A family member or friend might find one of them relatable too.
Video Thread 📽️🧵
2/ "I hope to god I'm wrong. I've never wanted to be more wrong in my life.... Worst case scenario... we are going to see a tsunami of cardiovascular disease over the next few decades." #LongCovid
At peak surge, we will have 2 million U.S. #COVID infections/day.
Nearly 1 in 3 Americans will get infected during the peak 2 months of this winter surge. That’s 105 million infections & >5 million resulting #LongCOVID cases.
2/ Today on Christmas, 3.5% of the U.S. population (1 in 29) is actively infectious with #COVID & rising toward a Jan 10 peak.
COVID transmission is higher than during 94.7% of the pandemic. There's a 50% chance of a COVID exposure if interacting with 20 people today.
3/ We posted our first “Christmas Risk” table on October 30, and as you can see, it performed exceedingly well.
These tables should lend confidence in the PMC dashboard, and raise concern about public health leadership and the news media.
Being able to accurately predict within a few percentage points the probability of infectiousness in a room of 20 people, for example, 8 weeks out is very helpful for planning. Moreover, many would estimate *today* that the risk in a room of 20 people is <1 percentage point. We’re talking about potentially magnitudes of difference in risk estimation, and this was highly predictable long ago. It’s not something unanticipated due to a new oddly-behaving sub-variant (there will always be a new sub-variant this time of year when no mitigation) or high rates of air travel (also unsurprising). It was highly predictable, and public health officials should not be given an out. The media will try to frame this as an unanticipated surge, and it simply was not, according to those who know how to forecast.
The formal PMC forecast keeps to 4 weeks, but sometimes a more speculative long-term estimate can help with planning, especially surrounding booking travel plans. People might want to take a wait-and-see approach to booking, purchase travel insurance, or cancel entirely. We characterized the table with appropriate caution, and hopefully it was helpful.
Putting out these forecasts requires putting one’s professional reputation as a scientist on the line. It’s very easy for anonymous and fake-name accounts to make speculative forecasts. The information we provide tends to be highly conservative within a much broader set of analyses, sensitivity analyses, and scenarios considered. Know that we are very cautious about what information we share, post considerable detail on the underlying methodology and assumptions in the online report, and carefully describe how estimates may be more precise or more speculative at times. A published peer-reviewed article will ultimately account for the strengths and limitations in the accuracy of the model.
We are headed into potentially the 2nd largest COVID surge all-time in the U.S.
If #wastewater levels follow historic trends, we will reach 2 million infections/day at peak surge with 4.2% of the population actively infectious on Jan 10.
2/ The winter peak should arrive between Jan 3 and Jan 17. The model estimates a peak of 1.7 to 2.2 million infections per day.
If unlucky, 1 in 20 people will be infectious, and it will be the 2nd largest wave. If lucky, more like 1 in 30, and the 4th largest wave.
Consider optimistic and pessimistic scenarios not captured by these models.
Optimism:
A rosy scenario would be that the peak occurs a week earlier at a slightly lower level (1.6-1.7 infections/day like last winter or the preceding summer). The level of acceleration in transmission argues against that, in favor of a higher peak, but Biobot is reporting some unusual regional variation (much lower transmission in the U.S. South and West). Moreover, historical patterns of how transmission should or should not accelerate cannot account for existing variation on population-level immunity due to variation in prior exposure history, recency of vaccination, and how well the current vaccine matches disseminating subvariants relative to prior vaccines. Finally, Biobot wastewater sites could be overreporting, and levels could get corrected downward. Each of these factors is highly plausible, but the “rosy” scenario remains quite bleak and suggests the pandemic remains far from “over.”
Pessimism:
Also, consider more pessimistic scenarios. Current vaccination rates remain extremely low, and several other countries are reporting atypically high acceleration via wastewater data. Placing plausible hypothetical values in the model, it is difficult to imagine a scenario where the U.S. reaches 2.5 million infections/day. Sometimes, people draw graphs showing a continued acceleration like BA.1, but such models seem to reflect imagination rather than data. The data do not suggest an evidence for a BA.1-level surge.
3/ COVID transmission is already very bad in the U.S. and getting worse.
Today:
🔹1.4 million daily infections
🔹1 in 35 infectious (2.9%)
In 4 weeks (Jan 15):
🔹1.9 million daily infections
🔹1 in 24 infectious (4.2%)
PMC COVID-19 Tracker, Dec 11, 2023
The surge continues.
Today:
🔹1.2 million daily infections
🔹1 in 41 infectious (2.5%)
In 4 weeks (Jan 8):
🔹1.6 million daily infections
🔹1 in 30 infectious (3.3%)
1/
A few key methodologic updates. 1) Biobot correct levels downward for the past two weeks, so you might notice that this week's estimates seem similar to last week's or marginally lower.
2) Our forecasting model uses a combination of historic data (situation past several years) and current data (past 4 weeks). In the historic model, we switched from using mean-type data to median-type data. This avoids overestimating levels based on the BA.1 surge and allows us to predict accurately a little faster, rather than predicting high and waiting for the current 4-week's data to correct it.
3) The forecasts depend a lot on the most recent week's data. To the extent Biobot is accurate or inaccurate in real-time, this leads to divergent forecasts.
You'll see the forecasts differ considerably (1.3 to 1.9 million daily infections) in 4 weeks.
2/
However, they mostly agree on the peak. It could be as early as Jan 1 or as late as Jan 15. It's a moot point. Transmission will be similar across that timespan and the weekly reports lack the precision to say whether it will peak on the 4th or 9th, for example. Early Jan will remain bad.
Details:
The real-time model (purple) anticipates the highest surge levels. This assumes that Biobot real-time reports are accurate, but they were substantially corrected for the past two weeks, and there were some issues with real-time accuracy during the summer wave. The turtle model (green) discount’s the most recent week’s data as an aberration, assumes transmission should be corrected upward a little, and predicts a steady rise with peak around January 1. The cheetah model (yellow) says that because last week’s data were corrected downward, this week’s estimate should be too, so it’s much more conservative on the next several weeks. The average of all models (red) guides forecasted numbers for the next four weeks. A month from now, we will see about 1.6 million new U.S. cases per day (range of 1.3 to 1.9 million across forecasting models), with 3.3% of the U.S. population or 1 in 30 people actively infectious.
Zooming out, you'll see that we're in a very bad place historically. With the divergent forecasts, it's merely a matter of whether this is the 2nd biggest U.S. COVID surge or 4th biggest.
The #LongCOVID cases resulting from these infections may top 400,000/week.
There's a lot of dichotomous thinking about #COVID risk on #airplanes.
Some believe it's completely safe, others completable dangerous.
I minimize flight travel and wouldn't fly without a fit-tested high-quality mask (N95 or elastomeric respirator). Here's why. 🧵
1/16
Field research from @sri_srikrishna found that across 3 models of aircrafts, they had an air cleaning rate of 10.9-11.8 air changes per hour (ACH).
A U.S. operating room should have 15 ACH, so flights are pretty good, right?
Wrong. I'll explain why.
2/16
10-12 air changes per hour (ACH) on a flight sounds good, even overkill, right?
Actually, no.
If the air has good mixing, the best case scenario is that each air change is still imperfectly efficient, cleaning out about 2/3 of the air each air change.
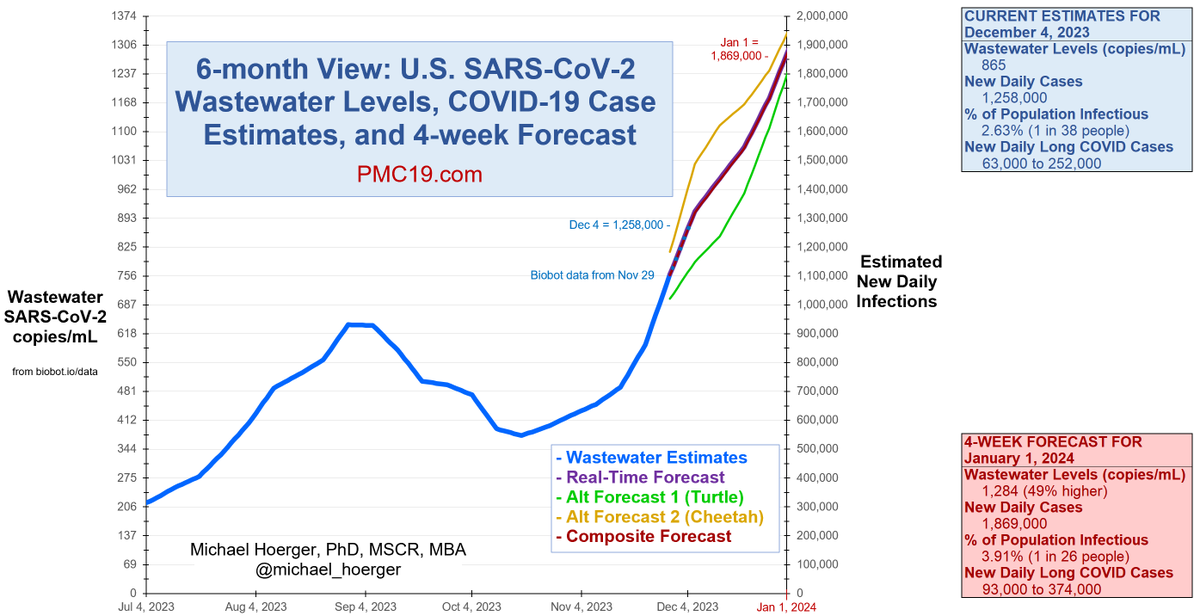
PMC COVID-19 Tracker, Dec 4, 2023
The U.S. surge is worsening faster than anticipated.
Today:
🔹1.2 million daily infections
🔹1 in 38 infectious (2.6%)
In 4 weeks (New Year's Day):
🔹1.8 million daily infections
🔹1 in 26 infectious (3.9%)
1/
You'll note the diverging forecasts. Biobot #wastewater levels increased more than anticipated this week, and they updated last week's numbers upward too.
The cheetah forecast (yellow) assumes this week's levels will also get revised upward like last week's. The turtle model (green) ignores this week's data as an aberration. The real-time forecast (purple), which assumes all real-time estimates are accurate, is barely visible behind the red line. The red line is the composite average of all 3 forecasts.
You'll notice the blue line (wastewater levels) and red line (forecast) overlap marginally. Biobot reports levels for Nov 29, and we carry them forward in the forecasting model through Dec 4 (today). Transmission is accelerating so much, usually this 5 day lag isn't even visible graphically.
2/
This table shows how additional social contacts increase risk today (Dec 4).
🔥10 people (daycare, team meeting) = about a 1 in 4 chance someone has infectious COVID
🔥🔥30 people (large K-12 class) = over a 50% chance someone has infectious COVID