Struggling with Machine Learning algorithms? 🤖
Then you better stay with me! 🤓
Today I am starting a new series of threads to simplify ML algorithms.
...and Linear Regression is the first one! 👇🏻
Then you better stay with me! 🤓
Today I am starting a new series of threads to simplify ML algorithms.
...and Linear Regression is the first one! 👇🏻
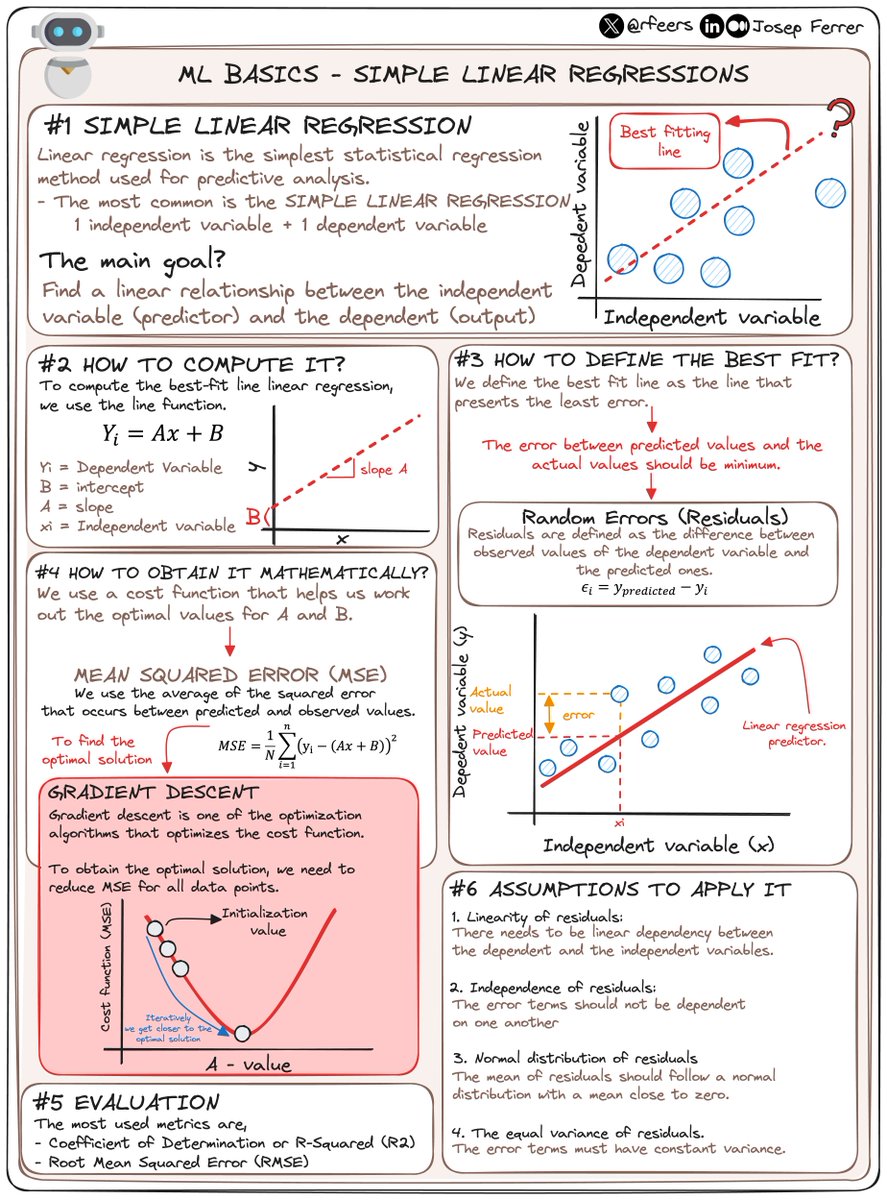
Linear regression is the simplest statistical regression method used for predictive analysis.
It can be performed with multiple variables.... but today we'll focus on a single one.
Also known as Simple Linear Regression.
It can be performed with multiple variables.... but today we'll focus on a single one.
Also known as Simple Linear Regression.
1️⃣ 𝗦𝗜𝗠𝗣𝗟𝗘 𝗟𝗜𝗡𝗘𝗔𝗥 𝗥𝗘𝗚𝗥𝗘𝗦𝗦𝗜𝗢𝗡
In Simple Linear Regression, we use one independent variable to predict a dependent one.
The main goal? 🎯
Finding a line of best fit.
It's simple yet powerful, revealing hidden trends in data.
In Simple Linear Regression, we use one independent variable to predict a dependent one.
The main goal? 🎯
Finding a line of best fit.
It's simple yet powerful, revealing hidden trends in data.

2️⃣ 𝗛𝗢𝗪 𝗗𝗢𝗘𝗦 𝗜𝗧 𝗪𝗢𝗥𝗞?
Linear regression takes advantage of a line to calculate the slope (A) and intercept (B).
We need:
- A dependent and an independent variable.
- A linear dependency between them.
Linear regression takes advantage of a line to calculate the slope (A) and intercept (B).
We need:
- A dependent and an independent variable.
- A linear dependency between them.

3️⃣ 𝗛𝗢𝗪 𝗗𝗢 𝗪𝗘 𝗗𝗘𝗙𝗜𝗡𝗘 𝗧𝗛𝗘 𝗕𝗘𝗦𝗧 𝗙𝗜𝗧?
The best-fit line is the line that presents the least error.
Huh? 🤔
well...
Errors are the difference between:
- Observed values of the dependent variable
- The predicted ones
With this definition, we get the error.
The best-fit line is the line that presents the least error.
Huh? 🤔
well...
Errors are the difference between:
- Observed values of the dependent variable
- The predicted ones
With this definition, we get the error.

4️⃣ 𝗛𝗢𝗪 𝗗𝗢 𝗪𝗘 𝗢𝗕𝗧𝗔𝗜𝗡 𝗜𝗧 𝗠𝗔𝗧𝗛𝗘𝗠𝗔𝗧𝗜𝗖𝗔𝗟𝗟𝗬?
We use a cost function that helps us work out the optimal values for A and B.
In linear regression, this cost function is Mean Squared Errors (MSE).
It is the average of the squared errors.
We use a cost function that helps us work out the optimal values for A and B.
In linear regression, this cost function is Mean Squared Errors (MSE).
It is the average of the squared errors.

✚ 𝗕𝗢𝗡𝗨𝗦
To find our optimal solutions, we use the gradient descent.
It is one of the optimization algorithms that optimizes the cost function.
To obtain the optimal solution, we need to reduce MSE for all data points.
Iteratively we get closer to the optimal solution.
To find our optimal solutions, we use the gradient descent.
It is one of the optimization algorithms that optimizes the cost function.
To obtain the optimal solution, we need to reduce MSE for all data points.
Iteratively we get closer to the optimal solution.

5️⃣ 𝗘𝗩𝗔𝗟𝗨𝗔𝗧𝗜𝗢𝗡
The most used metrics are:
- Coefficient of Determination or R-Squared (R2)
- Root Mean Squared Error (RSME)
The most used metrics are:
- Coefficient of Determination or R-Squared (R2)
- Root Mean Squared Error (RSME)

6️⃣ 𝗔𝗦𝗦𝗨𝗠𝗣𝗧𝗜𝗢𝗡𝗦 𝗧𝗢 𝗔𝗣𝗣𝗟𝗬 𝗜𝗧
Linear Regression isn't just about drawing lines. It assumes certain conditions like linearity, independence, and normal distribution of residuals.
Ensuring these make our model more reliable.
Linear Regression isn't just about drawing lines. It assumes certain conditions like linearity, independence, and normal distribution of residuals.
Ensuring these make our model more reliable.

And this is all for now... next week I will exemplify this model with a project, so stay tuned! 🤓
Linear Regression is more than just a statistical method.
It's the simplest tool that helps us predict and understand our world better.
Linear Regression is more than just a statistical method.
It's the simplest tool that helps us predict and understand our world better.
And that's all for now
If you liked this thread, I am sharing Data Science and AI content.
So don't forget to follow me to get more content like this! (@rfeers)
RT the tweet below to help me share the word! :D
If you liked this thread, I am sharing Data Science and AI content.
So don't forget to follow me to get more content like this! (@rfeers)
RT the tweet below to help me share the word! :D
https://twitter.com/739042635390816256/status/1738840115043025313
• • •
Missing some Tweet in this thread? You can try to
force a refresh